
Relationship between transport use and income in Australia
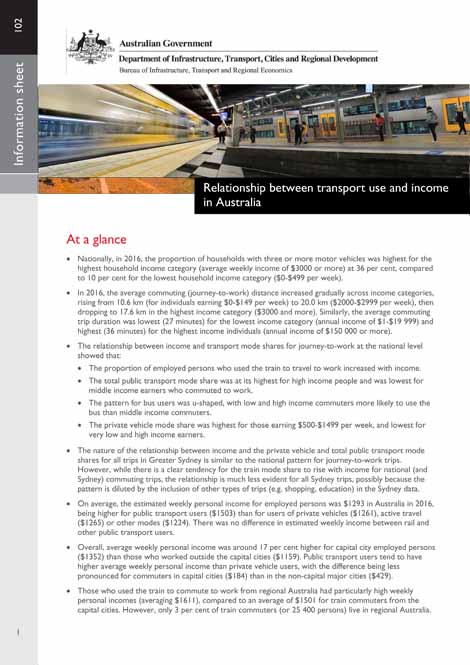
This Information Sheet explores the relationship between income and transport use in Australia by identifying the nature of the relationship between income and different types of transport use and how public transport use (especially rail) varies with income in different locations. The information in this publication will be useful in understanding the equity implications of government investment in transport infrastructure, particularly new urban rail infrastructure and implementation of regional development policy for regional cities located within commuting distance of the capital cities.
Economies of scope and regional services
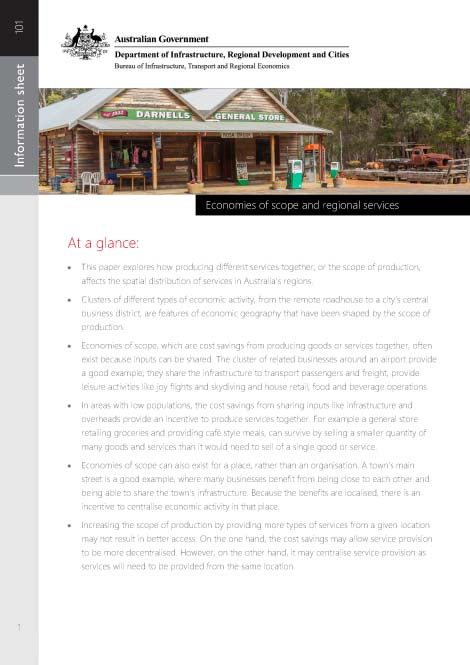
This paper explores how producing different services together, or the scope of production, affects the spatial distribution of services in Australia's regions. Clusters of different types of economic activity, from the remote roadhouse to a city's central business district, are features of economic geography that have been shaped by these economic forces.
- Economies of scope and regional services
Measuring Gross Regional Product
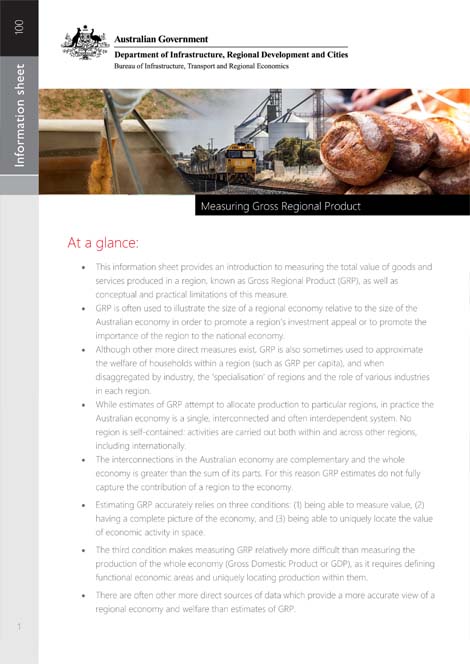
This information sheet provides an introduction to measuring the total value of goods and services produced in a region, known as Gross Regional Product (GRP), as well as conceptual and practical limitations of this measure.
- Measuring Gross Regional Product
Economies of scale and regional services
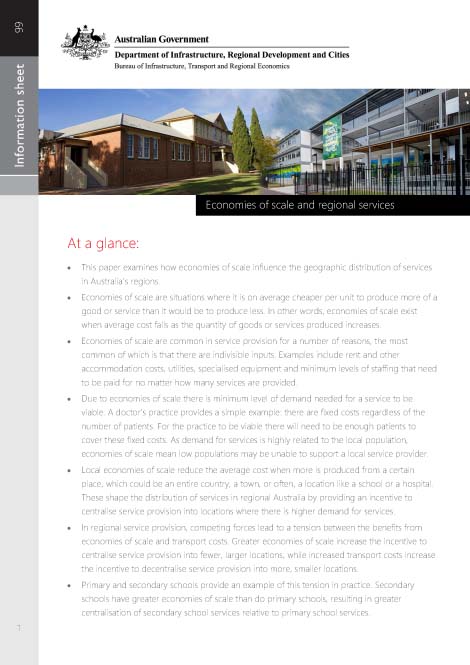
Economies of scale are a common feature of the cost structure of service providers. This paper discussed how economies of scale incentivise the geographic centralisation of services because they make it cheaper to supply services from fewer centralised locations. The paper also articulates the trade-off between centralising to gain the benefits from economies of scale and the costs of centralisation. These costs include extra transport costs for people who access the services and the costs to society from people not using the services due to difficulty accessing them. This creates a tension between the benefits from economies of scale and the benefits from having more geographically dispersed services.
- Economies of scale and regional services
What are services and who provides them?
In this paper we define services and provide an overview of who produces them and why. The first section defines a service as a type of product that can only be consumed while production is taking place. This rests on the concept of inseparability, which refers to the characteristic that the consumption and production of a service are inseparable. The second section provides an overview of the private, the not-for-profit and the government sectors in Australia.
- What is Access?
- What is Access?
An introduction to where Australians live
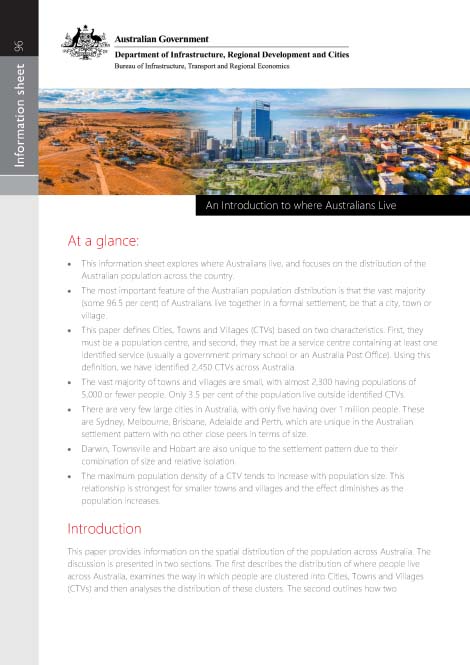
This paper provides an introduction to how people are distributed spatially across Australia. The discussion is broken into two sections. The first describes the distribution of where people live across Australia, examines the way in which people are clustered into Cities, Towns and Villages (CTVs) and then analyses the distribution of these clusters. The second outlines how two characteristics, isolation and density, changes across cities, towns and villages, with a particular focus on the link to population size.
- An introduction to where Australians live
- An introduction to where Australians live
This paper sets out a framework of access, with a particular focus on access to services. Previous research has examined dimensions of access, often in terms of a particular field and with an emphasis on the consumer. The work of Penchansky and Thomas (1981) has been drawn on for decades, with its 'five As' of access: availability, accessibility, accommodation, affordability and acceptability. In this paper we expand the scope of these access dimensions, consider both the consumer and producer perspectives, and frame the dimensions in terms of a spectrum of accessibility. The framework includes eight dimensions of access: time, space, price, quantity, quality, acceptability, information and awareness.
- What is Access?
- What is Access?
Progress in Australian Regions Yearbook 2018
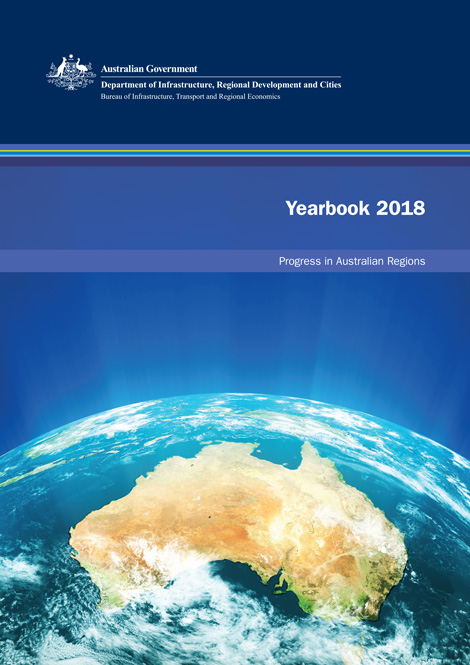
The Progress in Australian Regions–Yearbook is a statistical resource that measures progress in a region against social, economic, environmental and governance indicators. The Yearbook brings together information about Australia's regions from a range of different sources and presents that data in a consistent format over time.
This fifth edition updates information from previous editions of the Yearbook. It incorporates updated data where possible, and also presents previously published census data as newly released 2016 ASGS Remoteness Area geographies.
Excel files with additional geographic boundaries have also been provided, where data is available at that scale (Local Government Areas, Statistical Urban Areas, Statistical Areas Level 2, Statistical Areas Level 3). These are additional to the data in the published Yearbook.
Note that data for areas with very small populations should be used with caution, as small numbers can be significantly impacted by random adjustment.
Where possible, component data used to calculate indicators has been included.
- Progress in Australian Regions Yearbook 2018
- Introduction
- Foreword
- Contents, list of tables, list of figures
Progress indicators
Contextual indicators
Appendices
- Abbreviations and acronyms; Endnotes and definitions; and References
Previous yearbooks
- Progress in Australian Regions–Yearbook 2017
- Progress in Australian Regions–Yearbook 2016
- Progress in Australian Regions–Yearbook 2015
- Progress in Australian Regions–Yearbook 2014
Society
- Progress 1: Society
- P 1.1 Health and wellbeing
- P 1.1.1 Life expectancy at birth
- P 1.1.2 Psychological distress
- P 1.1.3 Suicide rate
- P 1.1.4 Overweight or obese
- P 1.1.5 Physical activity
- P 1.1.6 Smoking rates
- P 1.2 Close relationships
- P 1.2.1 Children developmentally vulnerable due to physical health and wellbeing
- P 1.3 Home
- P 1.3.1 Homelessness
- P 1.3.1 Homelessness–Additional boundaries
- P 1.3.2 Overcrowded conditions
- P 1.3.2 Overcrowded conditions–Additional boundaries
- P 1.3.3 Households that own their own home
- P 1.3.3 Households that own their own home–Additional boundaries
- P 1.3.4 Recognising traditional country
- P 1.4 Safety
- P 1.4.1 Victims of physical assault
- P 1.4.2 Victims of malicious property damage
- P 1.4.3 Road fatalities
- P 1.5 Learning and knowledge
- P 1.5.1 Vocational or higher educational qualifications
- P 1.5.1 Vocational or higher educational qualifications–Additional boundaries
- P 1.5.2 Year 5 and 9 reading standards
- P 1.5.3 Year 5 and 9 numeracy standards
- P 1.6 Community connections
- P 1.6.1 Voluntary work
- P 1.6.1 Voluntary work–Additional boundaries
- P 1.7 Fair opportunity
- P 1.7.1 Disposable household income for low and middle income households
- P 1.8 Enriched lives
- P 1.8.1 Unpaid help
- P 1.8.2 Attendance at cultural venues and events
Economy
- Progress 2: Economy
- P 2.1 Opportunities
- P 2.1.1 Having a qualification or working in a skilled occupation
- P 2.1.1 Having a qualification or working in a skilled occupation–Additional boundaries
- P 2.1.2 Young people earning or learning
- P 2.1.2 Young people earning or learning–Additional boundaries
- P 2.1.3 Net business entry rate
- P 2.1.3 Net business entry rate–Additional boundaries
- P 2.2 Jobs
- P 2.2.1 Employed persons
- P 2.2.2 Unemployment rate
- P 2.2.3 Youth unemployment rate
- P 2.3 A resilient economy
- P 2.3.1 Proportion of unemployed persons unemployed for 12 months or more
- P 2.3.2 Labour force underutilisation rate
- P 2.3.3 Value of new building approvals
- P 2.3.3 Value of new building approvals–Additional boundaries
- P 2.4 Enhanced living standards
- P 2.4.1 Real median weekly household income
- P 2.4.1 Real median weekly household income–Additional boundaries
- P 2.4.2 Real household net worth
- P 2.4.3 Labour force participation
- P 2.5 Fair outcomes
- P 2.5.1 Inequality in household income
- P 2.5.1 Inequality in household income–Additional boundaries
- P 2.6 International economic engagement
- P 2.6.1 International visits to resident ratio
Environment
- Progress 3: Environment
- P 3.1 Healthy natural environment
- P 3.1.1. Air pollution
- P 3.2 Appreciating the environment
- P 3.2.1 Domestic trips involving nature activities
- P 3.3 Protecting the environment
- P 3.3.1 Protected areas of land
- P 3.4 Sustaining the environment
- P 3.4.1 Greenhouse gas emissions from road transport
- P 3.5 Healthy built environments
- P 3.5.1 Average commuting time
- P 3.5.2 Active travel
- P 3.5.2 Active travel–Additional boundaries
- P 3.5.3 Number of solar panel systems
- P 3.5.3 Number of solar panel systems–Additional boundaries
Governance
- Progress 4: Governance
- P 4.1 Trust
- P 4.1.1 Generalised trust
- P 4.1.2 Informal votes
- P 4.2 Participation
- P 4.2.1 Voter turnout
- P 4.2.2 Participation in a civic or political group
- P 4.2.3 Uptake of Australian citizenship
- P 4.2.3 Uptake of Australian citizenship–Additional boundaries
Population and demographics
- Context 1: Population and demographics
- C 1.1 Population
- C 1.1.1 Estimated resident population
- C 1.1.1 Estimated resident population–additional boundries
- C 1.1.2 Population projections
- C 1.1.2 Population projections–Additional boundaries
- C 1.1.3 Internal migration
- C 1.1.4 Overseas arrivals
- C 1.1.4 Overseas arrivals–Additional boundaries
- C 1.1.5 Aboriginal and Torres Strait Islander people
- C 1.1.5 Aboriginal and Torres Strait Islander people–Additional boundaries
- C 1.2 Age structure
- C 1.2.1 Age profile
- C 1.2.1 Age profile–Additional boundaries
- C 1.2.2 Proportion of people who are working age
- C 1.2.2 Proportion of people who are working age–Additional boundaries
- C 1.3 Housing
- C 1.3.1 Average household size
- C 1.3.1 Average household size–Additional boundaries
- C 1.3.2 Multi-unit dwellings
- C 1.3.2 Multi-unit dwellings–Additional boundaries
- C 1.3.4 Dwelling approvals
- C 1.3.4 Dwelling approvals–Additional boundaries
- C 1.4 Social characteristics
- C 1.4.1 People who speak a language other than English at home
- C 1.4.1 People who speak a language other than English at home–Additional boundaries
- C 1.4.2 People on selected pensions or allowances
- C 1.4.2 People on selected pensions or allowances–Additional boundaries
- C 1.4.3 Single parent families
- C 1.4.3 Single parent families–Additional boundaries
Transport and infrastructure
- Context 2: Transport and infrastructure
- C 2.1 Moving people
- C 2.1.1 Transport mode for journey to work
- C 2.1.1 Transport mode for journey to work–Additional boundaries
- C 2.1.2 Passengers through airports
- C 2.1.3 Dwellings with no motor vehicle
- C 2.1.3 Dwellings with no motor vehicle–Additional boundaries
- C 2.1.4 Kilometres travelled by passenger vehicles
- C 2.1.5 Network delays due to congestion
- C 2.2 Moving freight
- C 2.2.1 Road freight activity
- C 2.2.2 Volume of freight through ports
- C 2.2.3 Value of international freight through ports
- C 2.3 Communications and utilities
- C 2.3.1 Dwellings with an internet connection
- C 2.3.1 Dwellings with an internet connection–Additional boundaries
- C 2.3.2 Residential water supply
- C 2.4 Land use
- C 2.4.1 Land area and land use
Industry and innovation
- Context 3: Industry and Innovation
- C 3.1 Industry
- C 3.1.1 Top employing industry
- C 3.1.2 Main growth and decline industry
- C 3.1.3 Structural change index
- C 3.2 Business activity
- C 3.2.1 Actively trading businesses
- C 3.2.1 Actively trading businesses–Additional boundaries
- C 3.2.2 Business size
- C 3.2.2 Business size–Additional boundaries
- C 3.3 Innovation
- C 3.3.1 Employment in knowledge-intensive industries
Spending by Australian households on owning and operating vehicles in 2015–16
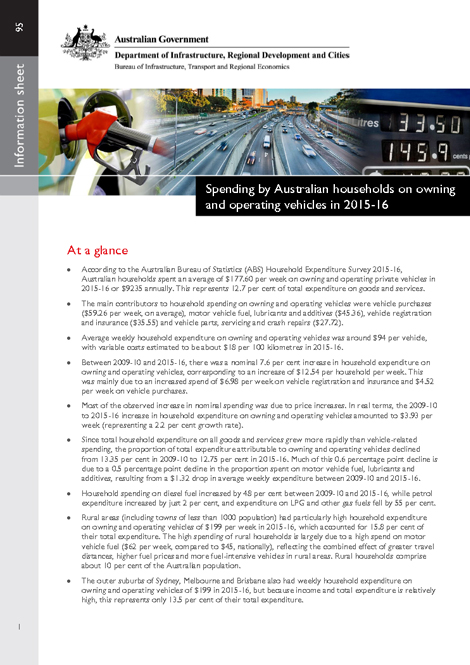
This Information Sheet presents data on Australian households' expenditure patterns, based on the ABS Household Expenditure Survey (HES) for 2015–16. It updates BITRE Information Sheet 86 Spending by Australian households on owning and operating vehicles (BITRE 2017a), which relied on 2009–10 HES data. It details the composition of household expenditure on owning and operating vehicles and explores variation in the incidence of these costs across different types of households, such as capital city and regional households, and high income and low income households. This updated analysis also investigates changes in vehicle-related spending since 2009–10, with the aim of identifying any significant changes that have occurred for particular types of regions or particular demographic groups.
- Spending by Australian households on owning and operating vehicles in 2015–16
Progress in Australian Regions Yearbook 2017
The Progress in Australian Regions–Yearbook is a statistical resource that measures progress in a region against social, economic, environmental and governance indicators. The Yearbook brings together information about Australia's regions from a range of different sources and presents that data in a consistent format over time.
This fourth edition updates information from previous editions of the Yearbook and is incorporating newly released data from the 2016 Census where appropriate.
Update (July 2018): New Excel files have been added with additional geographic boundaries, where data is available at that scale (Local Government Areas, Statistical Urban Areas, Statistical Areas Level 2, Statistical Areas Level 3). These are additional to the data in the published Yearbook.
Note that data for areas with very small populations should be used with caution, as small numbers can be significantly impacted by random adjustment.
- Progress in Australian Regions Yearbook 2017
- Introduction
- Foreword
- Contents, list of tables, list of figures
Progress indicators
Contextual indicators
Appendices
- Abbreviations and acronyms; Endnotes and definitions; and References
Previous yearbooks
- Progress in Australian Regions–Yearbook 2016
- Progress in Australian Regions–Yearbook 2015
- Progress in Australian Regions–Yearbook 2014
Society
- Progress 1: Society
- P 1.1 Health and wellbeing
- P 1.1.1 Life expectancy at birth
- P 1.1.2 Psychological distress
- P 1.1.3 Suicide rate
- P 1.1.4 Overweight or obese
- P 1.1.5 Physical activity
- P 1.1.6 Smoking rates
- P 1.2 Close relationships
- P 1.2.1 Children developmentally vulnerable due to physical health and wellbeing
- P 1.3 Home
- P 1.3.1 Homelessness
- P 1.3.1 Homelessness–Additional boundaries
- P 1.3.2 Overcrowded conditions
- P 1.3.2 Overcrowded conditions–Additional boundaries
- P 1.3.3 Households that own their own home
- P 1.3.3 Households that own their own home–Additional boundaries
- P 1.3.4 Recognising traditional country
- P 1.4 Safety
- P 1.4.1 Victims of physical assault
- P 1.4.2 Victims of malicious property damage
- P 1.4.3 Road fatalities
- P 1.5 Learning and knowledge
- P 1.5.1 Vocational or higher educational qualifications
- P 1.5.1 Vocational or higher educational qualifications–Additional boundaries
- P 1.5.2 Year 5 and 9 reading standards
- P 1.5.3 Year 5 and 9 numeracy standards
- P 1.6 Community connections
- P 1.6.1 Voluntary work
- P 1.6.1 Voluntary work–Additional boundaries
- P 1.7 Fair opportunity
- P 1.7.1 Disposable household income for low and middle income households
- P 1.8 Enriched lives
- P 1.8.1 Unpaid help
- P 1.8.2 Attendance at cultural venues and events
Economy
- Progress 2: Economy
- P 2.1 Opportunities
- P 2.1.1 Having a qualification or working in a skilled occupation
- P 2.1.1 Having a qualification or working in a skilled occupation–Additional boundaries
- P 2.1.2 Young people earning or learning
- P 2.1.2 Young people earning or learning–Additional boundaries
- P 2.1.3 New business entry rate
- P 2.1.3 New business entry rate–Additional boundaries
- P 2.2 Jobs
- P 2.2.1 Employed persons
- P 2.2.1 Employed persons–Additional boundaries
- P 2.2.2 Unemployment rate
- P 2.2.2 Unemployment rate–Additional boundaries
- P 2.2.3 Youth unemployment rate
- P 2.2.3 Youth unemployment rate–Additional boundaries
- P 2.3 A resilient economy
- P 2.3.1 Proportion of unemployed persons unemployed for 12 months or more
- P 2.3.2 Labour force underutilisation rate
- P 2.3.3 Value of new building approvals
- P 2.4 Enhanced living standards
- P 2.4.1 Real median weekly household income
- P 2.4.2 Real household net worth
- P 2.4.3 Labour force participation
- P 2.4.3 Labour force participation–Additional boundaries
- P 2.5 Fair outcomes
- P 2.5.1 Inequality in household income
- P 2.5.1 Inequality in household income–Additional boundaries
- P 2.6 International economic engagement
- P 2.6.1 International visits to resident ratio
Environment
- Progress 3: Environment
- P 3.1 Healthy natural environment
- P 3.1.1. Air pollution
- P 3.2 Appreciating the environment
- P 3.2.1 Domestic trips involving nature activities
- P 3.3 Protecting the environment
- P 3.3.1 Protected areas of land
- P 3.4 Sustaining the environment
- P 3.4.1 Greenhouse gas emissions from road transport
- P 3.5 Healthy built environments
- P 3.5.1 Average commuting time
- P 3.5.2 Active travel
- P 3.5.2 Active travel–Additional boundaries
- P 3.5.3 Number of solar panel systems
- P 3.5.3 Number of solar panel systems–Additional boundaries
Governance
- Progress 4: Governance
- P 4.1 Trust
- P 4.1.1 Generalised trust
- P 4.1.2 Informal votes
- P 4.2 Participation
- P 4.2.1 Voter turnout
- P 4.2.2 Participation in a civic or political group
- P 4.2.3 Uptake of Australian citizenship
- P 4.2.3 Uptake of Australian citizenship–Additional boundaries
Population and demographics
- Context 1: Population and demographics
- C 1.1 Population
- C 1.1.1 Estimated resident population
- C 1.1.1 Estimated resident population–additional boundries
- C 1.1.2 Population projections
- C 1.1.2 Population projections–Additional boundaries
- C 1.1.3 Internal migration
- C 1.1.4 Overseas arrivals
- C 1.1.4 Overseas arrivals–Additional boundaries
- C 1.1.5 Aboriginal and Torres Strait Islander people
- C 1.1.5 Aboriginal and Torres Strait Islander people–Additional boundaries
- C 1.2 Age structure
- C 1.2.1 Age profile
- C 1.2.1 Age profile–Additional boundaries
- C 1.2.2 Proportion of people who are working age
- C 1.2.2 Proportion of people who are working age–Additional boundaries
- C 1.3 Housing
- C 1.3.1 Average household size
- C 1.3.1 Average household size–Additional boundaries
- C 1.3.2 Multi-unit dwellings
- C 1.3.2 Multi-unit dwellings–Additional boundaries
- C 1.3.4 Dwelling approvals
- C 1.3.4 Dwelling approvals–Additional boundaries
- C 1.4 Social characteristics
- C 1.4.1 People who speak a language other than English at home
- C 1.4.1 People who speak a language other than English at home–Additional boundaries
- C 1.4.2 People on selected pensions or allowances
- C 1.4.2 People on selected pensions or allowances–Additional boundaries
- C 1.4.3 Single parent families
- C 1.4.3 Single parent families–Additional boundaries
Transport and infrastructure
- Context 2: Transport and infrastructure
- C 2.1 Moving people
- C 2.1.1 Transport mode for journey to work
- C 2.1.1 Transport mode for journey to work–Additional boundaries
- C 2.1.2 Passengers through airports
- C 2.1.3 Dwellings with no motor vehicle
- C 2.1.3 Dwellings with no motor vehicle–Additional boundaries
- C 2.1.4 Kilometres travelled by passenger vehicles
- C 2.1.5 Network delays due to congestion
- C 2.2 Moving freight
- C 2.2.1 Road freight activity
- C 2.2.2 Volume of freight through ports
- C 2.2.3 Value of international freight through ports
- C 2.3 Communications and utilities
- C 2.3.1 Dwellings with an internet connection
- C 2.3.1 Dwellings with an internet connection–Additional boundaries
- C 2.3.2 Residential water supply
- C 2.4 Land use
- C 2.4.1 Land area and land use
Industry and innovation
- Context 3: Industry and Innovation
- C 3.1 Industry
- C 3.1.1 Top employing industry
- C 3.1.2 Main growth and decline industry
- C 3.1.3 Structural change index
- C 3.2 Business activity
- C 3.2.1 Actively trading businesses
- C 3.2.1 Actively trading businesses–Additional boundaries
- C 3.2.2 Business size
- C 3.2.2 Business size–Additional boundaries
- C 3.3 Innovation
- C 3.3.1 Employment in knowledge-intensive industries