Road and Rail Supply Chain Resilience Review
BITRE is leading a review into the resilience of Australian road and rail supply chains.
This review will identify the supply chains that are most critical to Australian communities and businesses, the risks they face, and a stocktake of any work underway to mitigate risks. This work will help to inform action by government on how to effectively and efficiently mitigate risks in supply chains for the benefit of all Australians.
The Terms of Reference for the review are presented below.
Phase One of the review was released on 6 February 2023.
Enquiries about the review can be addressed to: RoadandRailResilience@infrastructure.gov.au
All media enquiries should be addressed to: media@infrastructure.gov.au
Road and Rail Supply Chain Resilience Review – Terms of Reference
All Australians depend on strong and resilient supply chains. The impacts of COVID-19, natural disasters and a growing freight task have shown the increasing importance of Australian on-land supply chains, and their critical importance to the national economy, and the lives and livelihoods of Australians. Understanding which supply chains are of national importance, the risks they face, and how government and industry can work to mitigate these risks is essential to ensure supply chains remain resilient and fit-for-purpose now and in the future.
In March 2022, the Department of Infrastructure, Transport, Regional Development, Communications and the Arts was asked to conduct a review into Australia’s road and rail supply chain resilience, supported by independent advice as required.
The review will:
- Define and determine key risks to critical supply routes – routes that transport large quantities of freight or are critical to supply of essential goods or services across Australia;
- Identify key risks to critical supply routes in the short, medium and long term — including weather events or natural disasters, limited alternative routes, and limited and difficult to access alternative transport modes;
- Assess the potential vulnerabilities in critical supply routes;
- Complete a stocktake of recent relevant work by government and industry intended to identify and mitigate Australian domestic road and rail supply chain risks;
- Identify data generation, capture and use requirements necessary to assess, inform best‑practice and improve road and rail supply chain resilience;
- Determine the critical routes at highest risk of failure; and
- Develop and present pragmatic options for governments to mitigate or address risks to critical road and rail supply chains, in alignment with the Government-agreed framework to identify and mitigate critical supply chain risks.
The focus of the review is on Australia’s road and rail infrastructure and linked infrastructure. Matters such as international supply chain vulnerability, costs of freight, the transport workforce and critical inputs to the transport sector are outside the scope of the review.
The review will take into consideration supporting work, including but not limited to the:
- Australian Infrastructure Plan;
- National Freight and Supply Chain Strategy, including the National Freight Data Hub;
- National Urban Freight Planning Principles;
- Final Report of the Royal Commission into National Natural Disaster Arrangements;
- Final Report of the Productivity Commission Study into Vulnerable Supply Chains;
- National Rail Action Plan;
- Supply Chain Resilience Initiative; and
- DITRDC’s Key Freight Routes Map.
The review will engage closely with the Freight Industry Reference Panel, and also consult with:
- Key infrastructure owners and operators;
- Freight industry stakeholders – including freight customers;
- State and territory governments;
- National Recovery and Resilience Agency (NRRA);
- Infrastructure Australia;
- CSIRO;
- The Department of the Prime Minister and Cabinet, including the Office of Supply Chain Resilience;
- The Department of Home Affairs (including Emergency Management Australia and the National Coordination Mechanism);
- The Department of Agriculture, Water and the Environment, including the Australian Climate Service; and
- Any other groups DITRDC deems necessary.
Phase 1 – Building the evidence base
This report presents the Bureau of Infrastructure and Transport Research Economics’ (BITRE) findings for the first six components of the Terms of Reference based on an initial assessment of Australia’s road and rail supply chain resilience.
The evidence in this report draws on a literature review, extensive stakeholder consultation and geospatial analysis, including scenario modelling. Scenario modelling provides greater insight into a number of key critical and vulnerable routes, including an assessment of the likelihood and expected impact of various hazards on road and rail supply chains. The Review also presents a number of case studies to provide real-world illustrations of the impact of natural and human induced risks, as well as examples of initiatives to address supply chain issues.
Supplementary materials
- Appendix B – Resilience analysis of key freight roads and railways using CSIRO’s TraNSIT
- Appendix C – Analysis of risks impacting the resilience of supply chains
- Appendix F – Summary of risks and impacts on critical KFRs
- Appendix G – Stocktake of current or recently completed resilience initiatives across government
Australian Infrastructure and Transport Statistics Yearbook 2025: Roads chapter
Chapter 4: Roads
- Australian Infrastructure and Transport Statistics Yearbook 2025 - Download full report PDF
- Road—Yearbook 2025 (266 KB) - Download Excel file
- For information on road-related revenue and expenditure - see chapter 3 of the 2025 Yearbook
This chapter provides information on Australian roads including length, use, the vehicle fleet, and the number of vehicle licences.
- An estimated 264 billion vehicle kilometres were travelled on Australia's roads in 2024–25.
- In 2024, there were 476,000 km of paved roads in Australia.
- 20 million Australians had vehicle licences at 2024–25.
- In 2024–25, Sports Utility Vehicles (SUVs) comprised 59% of new motor vehicle sales (excluding motorcycles) compared with only 33% ten years earlier.
Figure 8 shows total vehicle kilometres by vehicle type. Figure 9 shows Australia’s national road network. Total vehicle kilometres travelled fell significantly during the COVID pandemic, only surpassing their previous 2017–18 peak in 2023–24.
Figure 8 Vehicle kilometres travelled by vehicle type
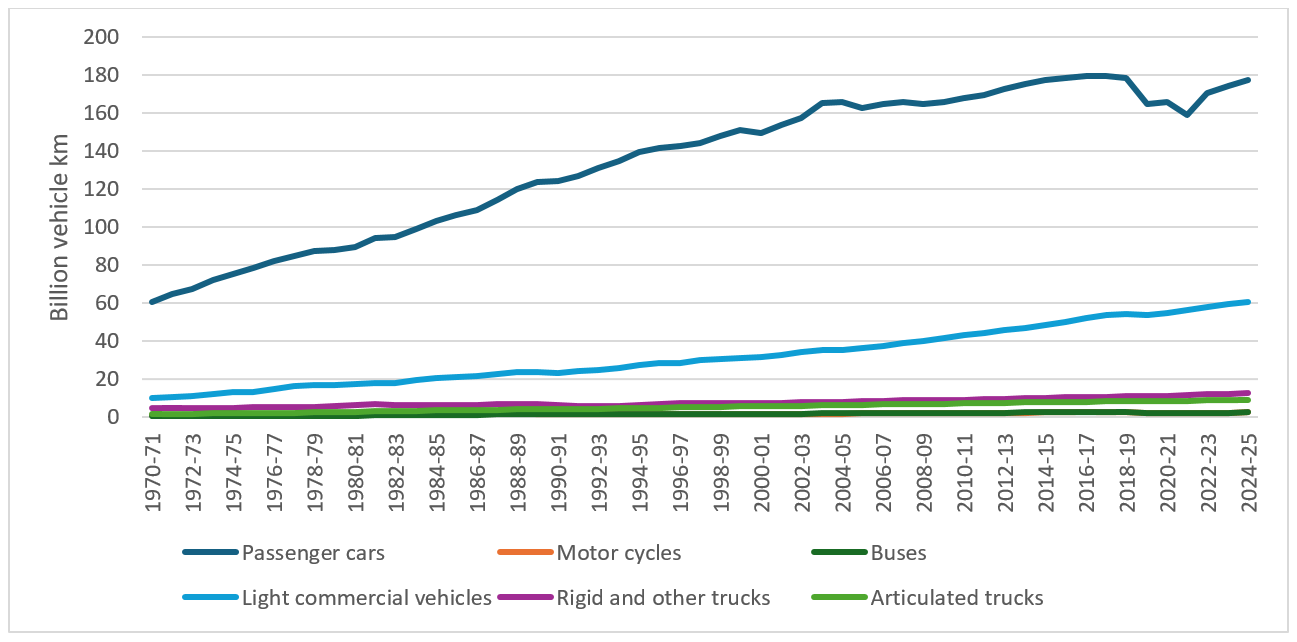
Source: Table 4.2
Figure 9 Map of national road network
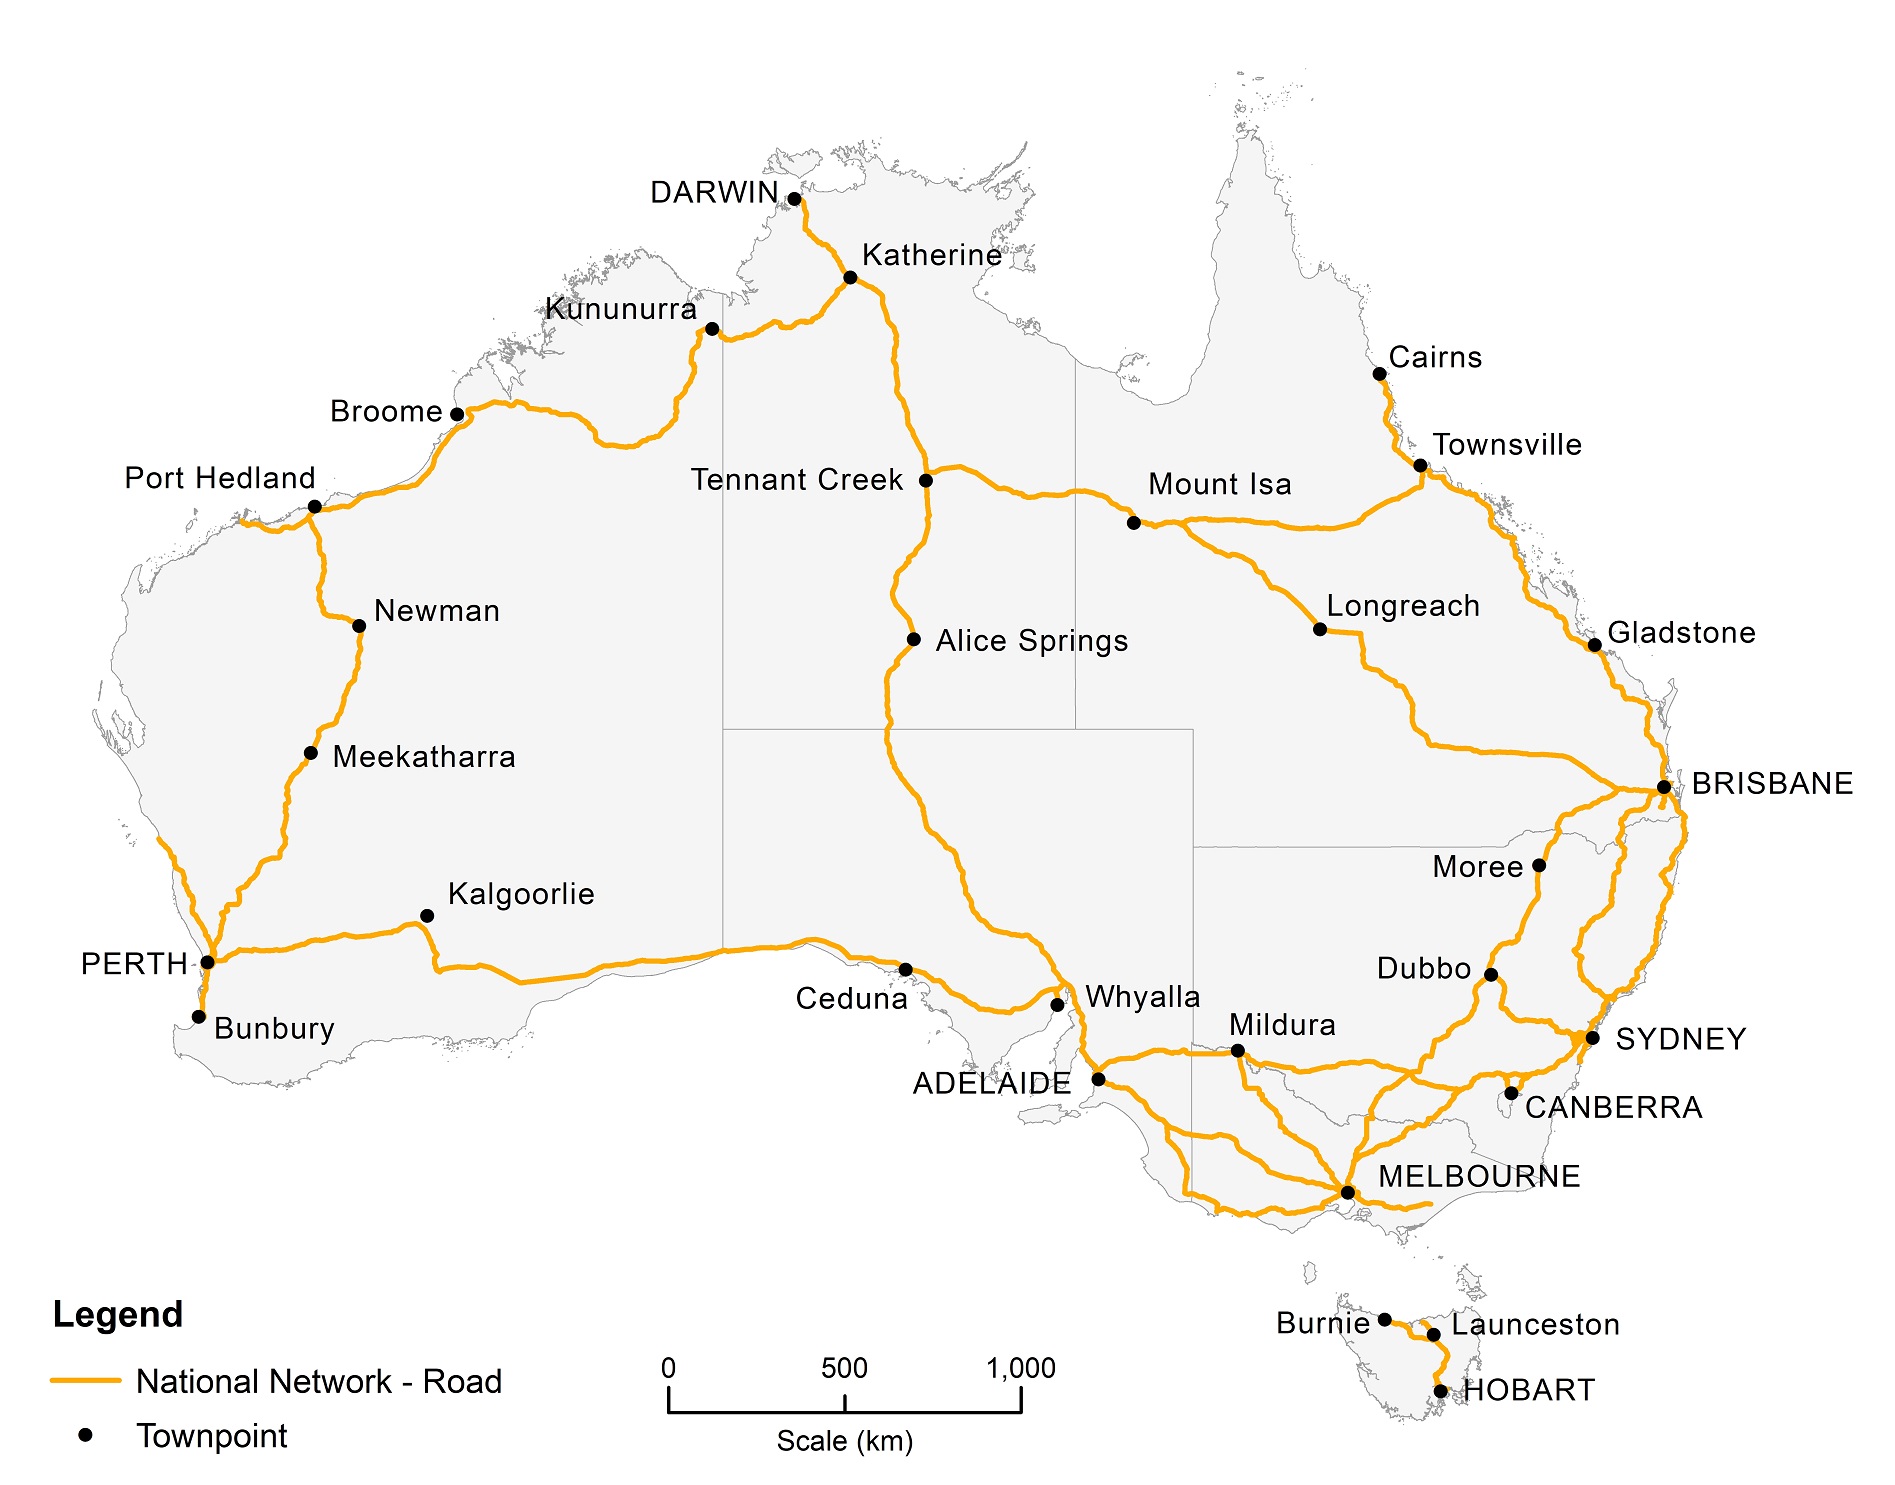
Source: DITRDCSA, 2022
Data on the latest national and state/territory road deaths and fatal crashes can be found on the National Road Safety Data Hub website.
Use the national road safety tracker dashboard to explore how Australia is tracking on national strategic targets for 2030, including the number of road deaths over the last 12 months, the rate of road deaths per 100,000 population and the number of serious injuries due to road incidents (data lags by approximately 3 years due to sources).
Road-related Revenue and Expenditure
Chapter 3
This chapter provides information on the Government’s total expenditures and sources of revenue for road-related activities for the Commonwealth, state and local Government (noting only expenditure is shown at the local level). A variety of sources are used for this data, including data from the Australian Tax Office, the Australian Bureau of Statistics, the Department of Infrastructure, Transport, Regional Development, Communications and the Arts, BITRE estimates and State and Territory Governments.
- Road related expenditure by all government slightly increased from $33 billion in 2020-21 to $36 billion in 2021-22 (latest available year).
- $28 billion in road-related revenue was collected by all government (excluding road-related revenue from the Goods and Services Tax, Fringe Benefits Tax and the Luxury Car Tax).
Figure 1 Road-related expenditure, by level of government (constant 2021-22 prices, adjusted by CPI)
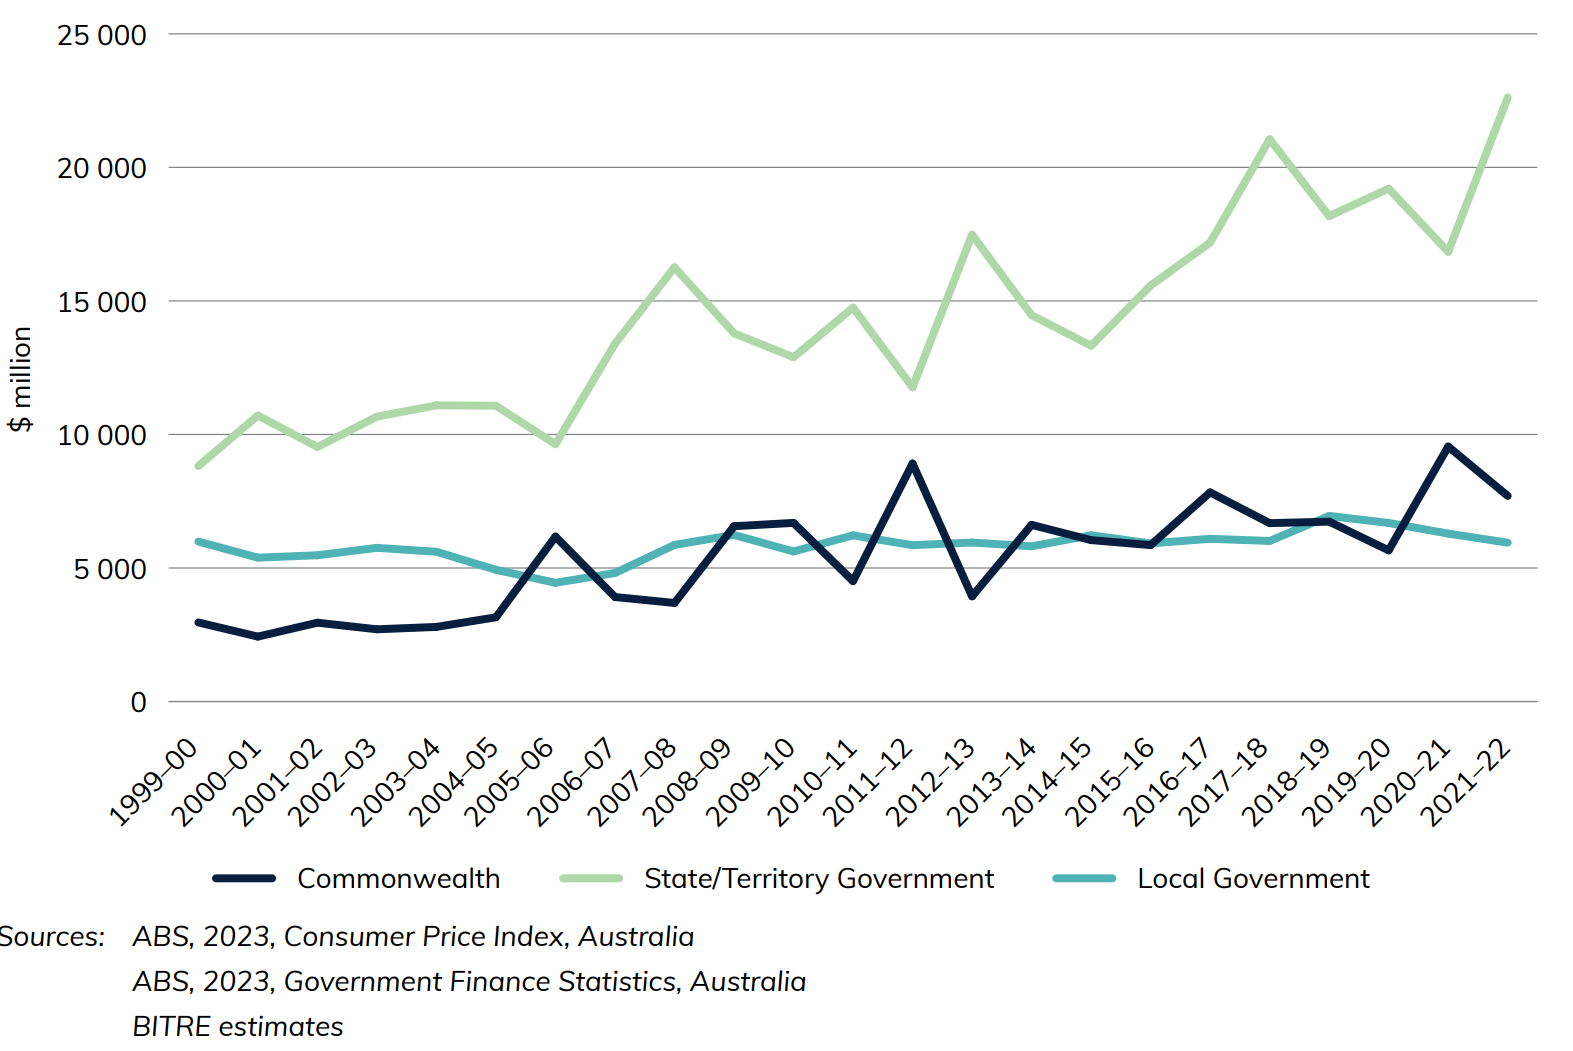
Government’s road-related expenditure over time can be seen in Figure 1. The State/Territory Government expenditure is at an all-time high in 2021-22 at 23 billion dollars. The Commonwealth’s expenditure fell to 7.7 billion dollars in 2021-22 from a record high of 9.5 billion dollars the previous year. Local government expenditure has remained relatively stable over time, with an average of 5.8 billion dollars over the past 24 years.
Figure 2 Australian Government Road-Related Revenues
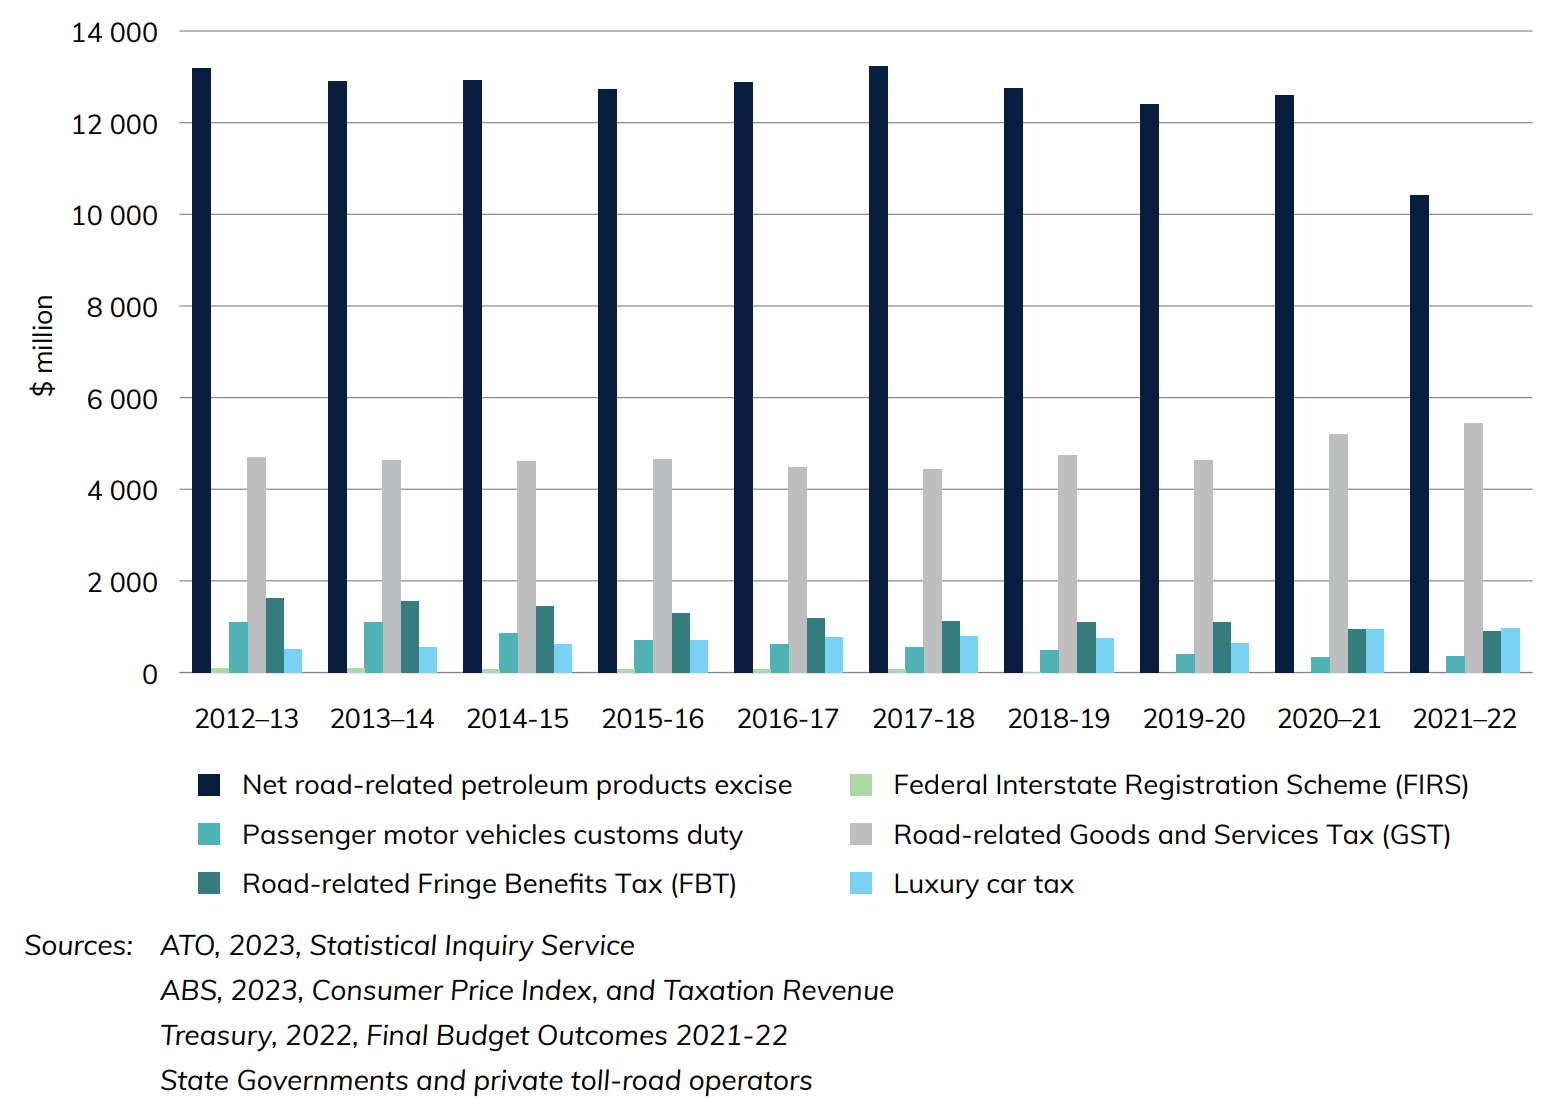
Figure 2 shows road-related revenues for the Australian Government, while Figure 3 shows revenues for the States and Territories (excluding tolls). Figure 2 highlights how the Commonwealth’s main source of road-related revenue is from the net road-related petroleum excise with an average of 12.6 billion dollars over 10 years.
Figure 3 State and Territory Government Road-Related Revenues (excluding tolls)
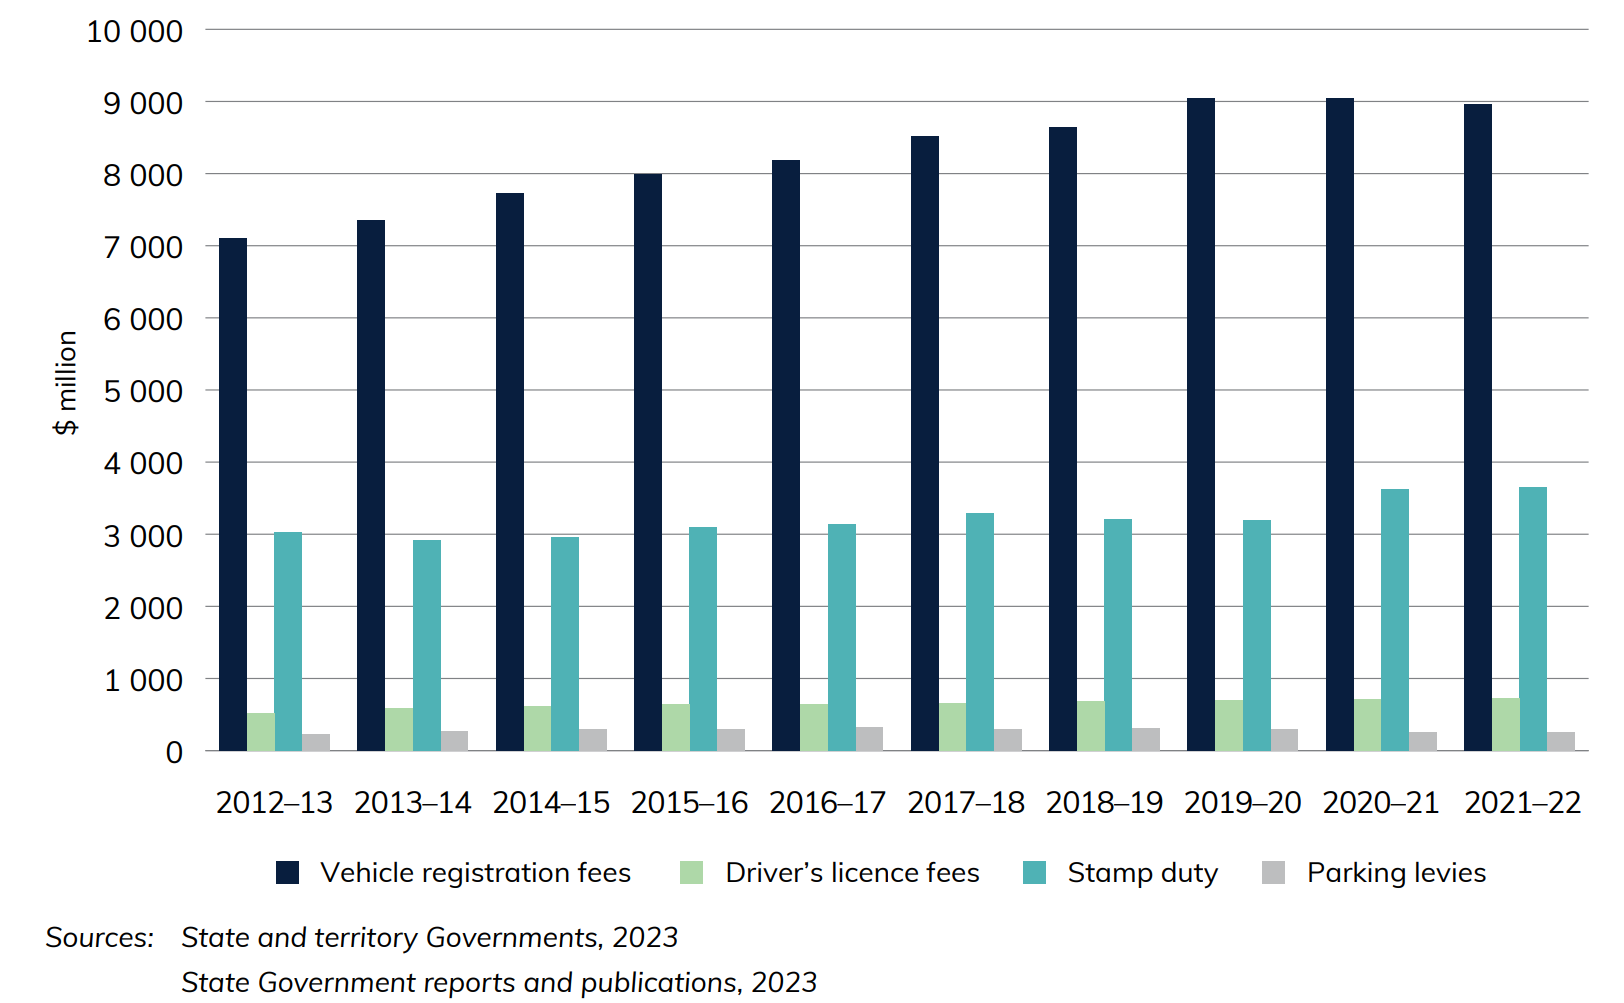
Figure 3 illustrates that the majority of revenue for the states/territories is vehicle registration fees with an average of 8.3 billion dollars per year over 10 years and a maximum of 9.1 billion dollars in 2020-21.
Download data
Also see
Chapter 6
This chapter provides the following information on Australian roads: road distances, road length in kilometres, licence registration transactions over different vehicle types, electric vehicles attributes and registration transactions.
A variety of sources are used for this data, including data from the Australian Bureau of Statistics, the Department of Infrastructure, Transport, Regional Development, Communications and the Arts, Federal Chamber of Automotive Industries (FCAI), VFACTS, BITRE estimates and State and Territory Governments.
- Australia’s total estimated paved road length was 427,000 kilometres in 2022.
- An estimated 254 billion vehicle kilometres were travelled on Australia's roads in 2022-23.
- In 2022-23, Sports Utility Vehicles (SUVs) comprised 55% of new motor vehicle sales (excluding motor cycles) compared with only 28% 10 years earlier.
- In 2022, there were 33 000 electric vehicle sales in Australia, up from 17 000 the previous year.
Figure 1 Map of national road network
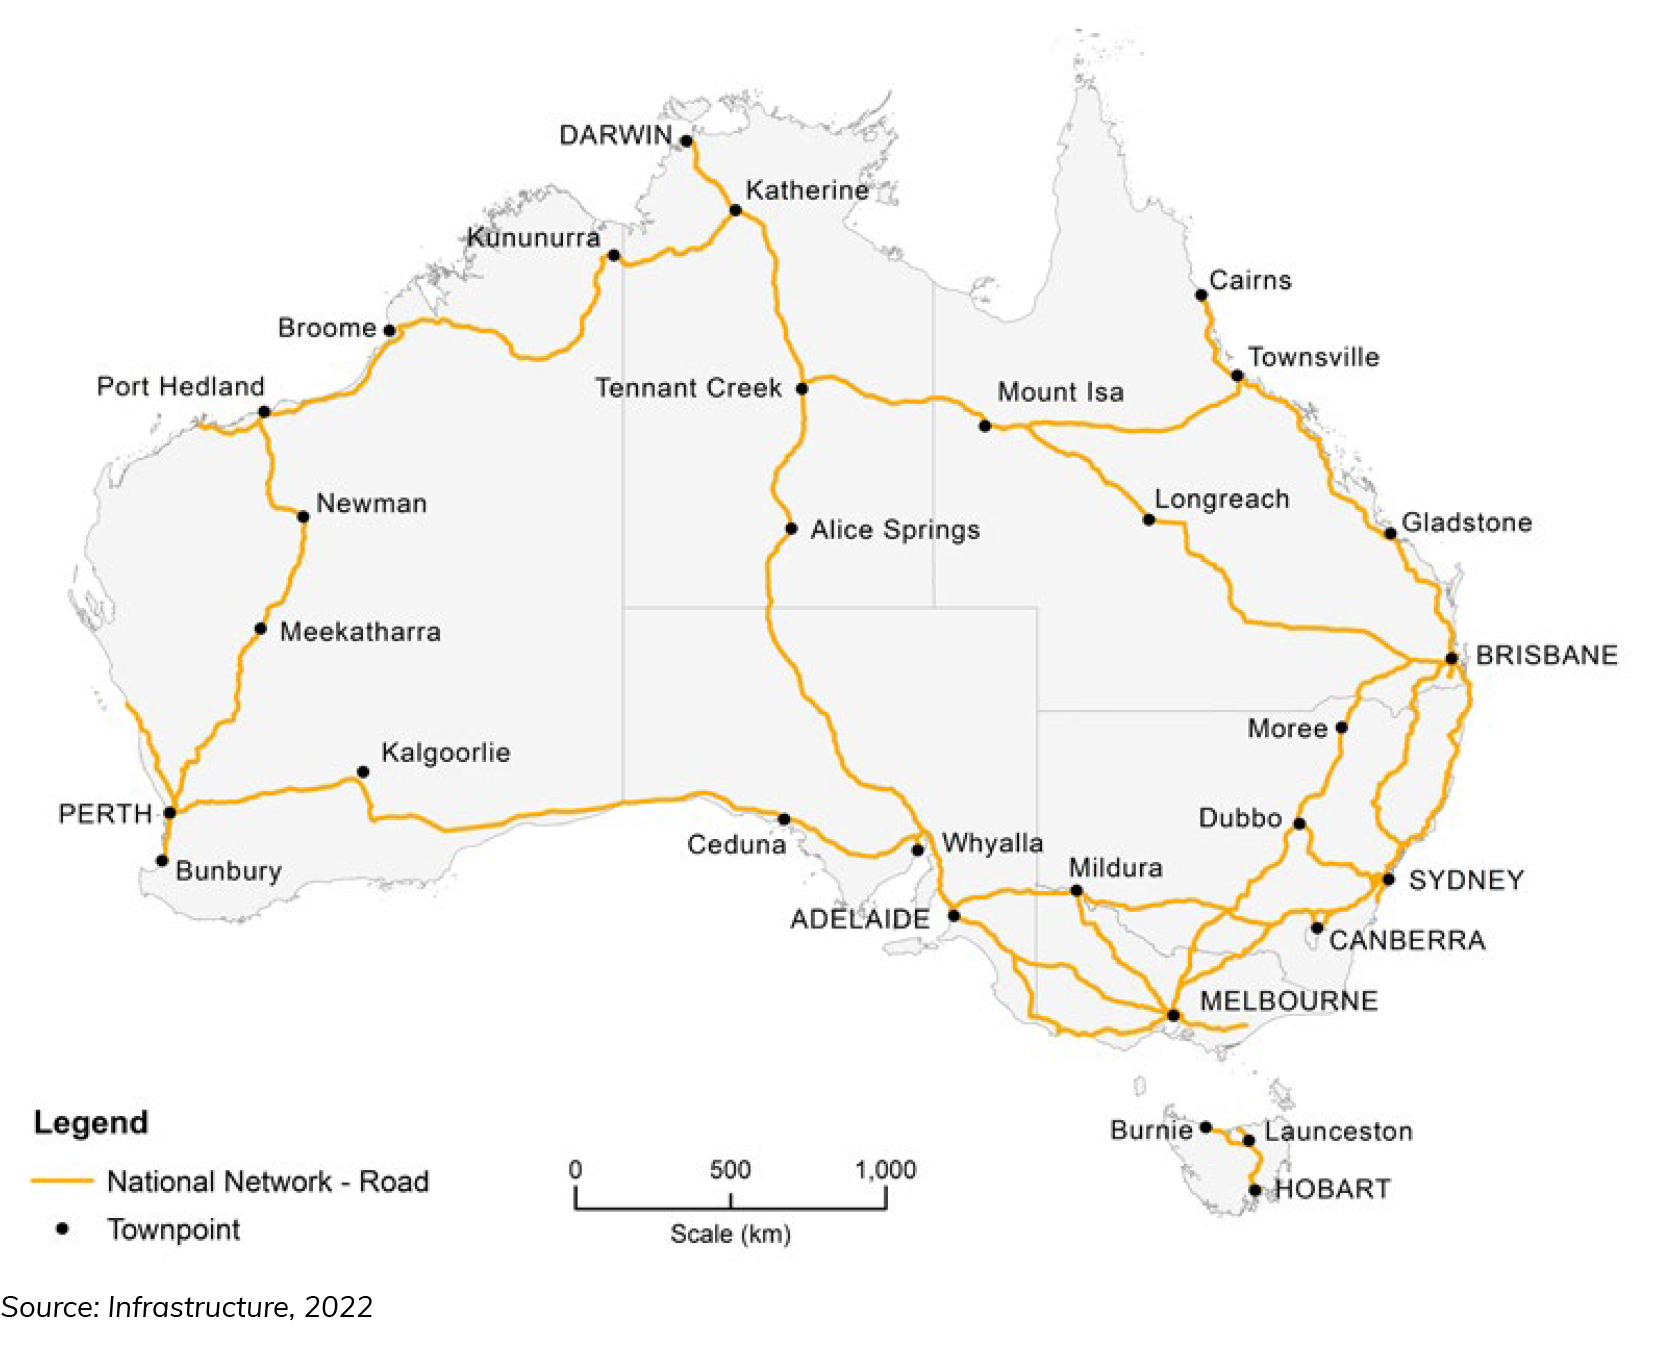
Figure 1 shows Australia’s national road network. The lines and dots shown here are the roads and town points that were open for traffic at December 2021.
Figure 2 Sales of electric vehicles
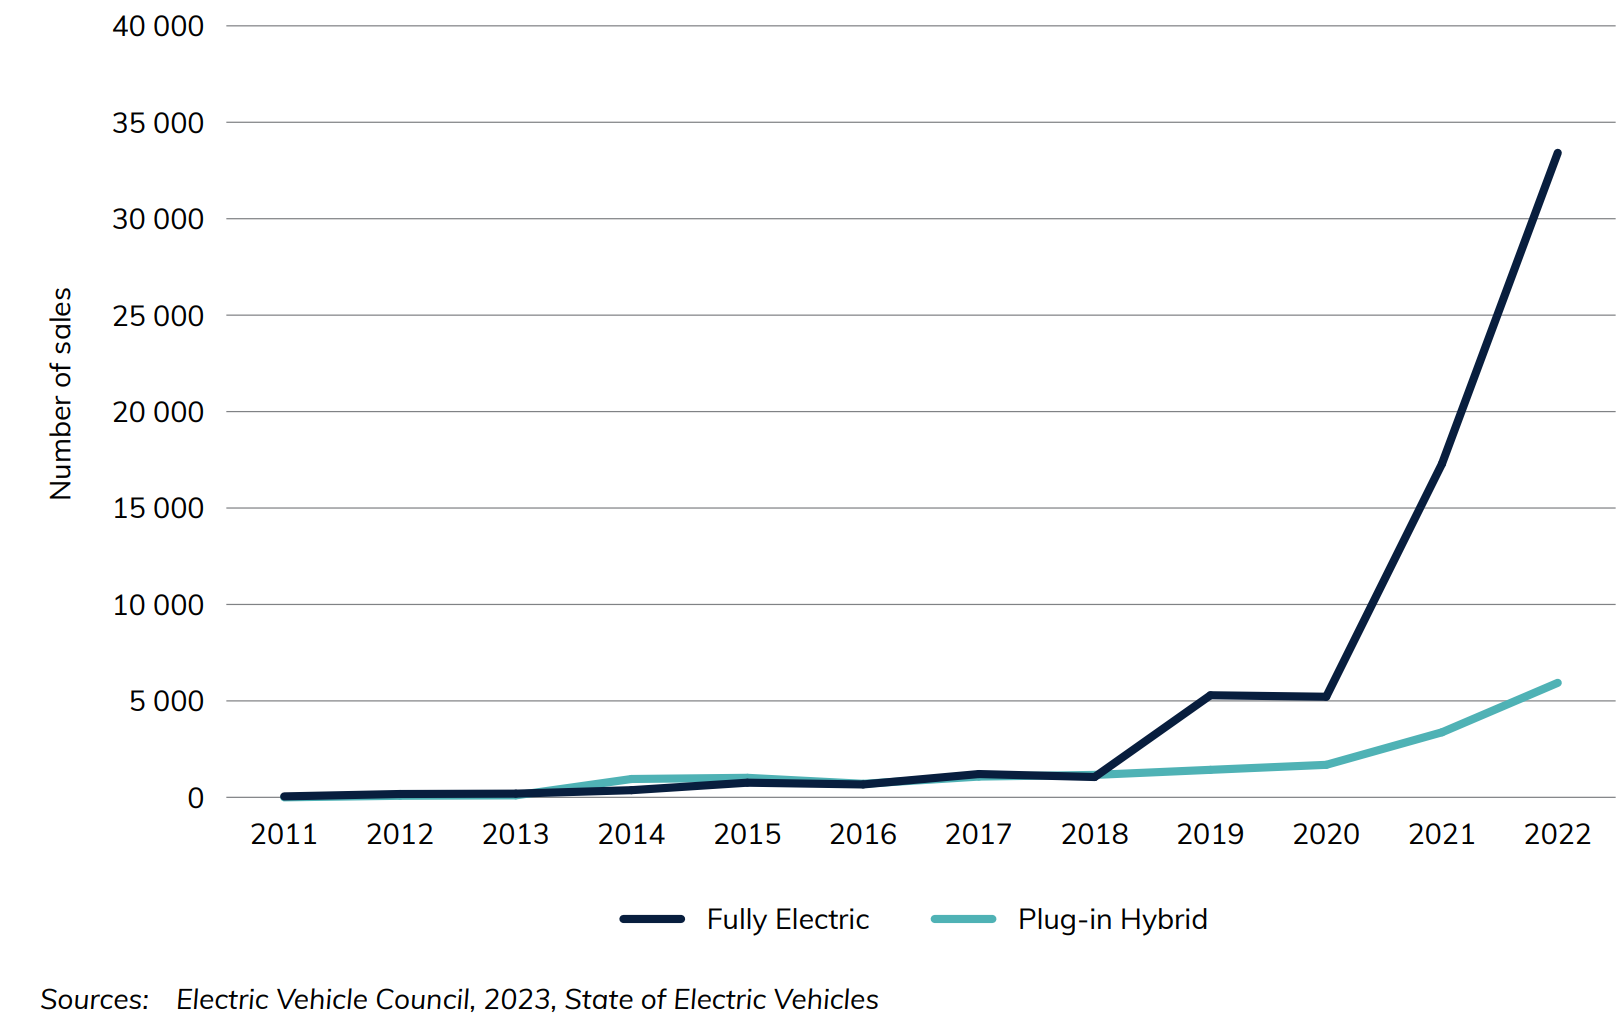
Figure 2 shows the sale of registered battery electric vehicles and Plug-in Hybrids over time. Fully battery electric vehicles sales increased by 93 per cent between 2021 and 2022.
Download data
Also see
Chapter 10
This chapter provides data on Australian safety for road, aviation, rail and maritime transport types. This includes data relating to crashes, fatalities, injuries and their rates of occurrence, as well as how this can differ for different demographics, states and territories (subject to data availability).
- In 2022, 1,180 people died in road crashes in Australia, down from 1 737 in 2001.
- 34 aviation fatalities occurred in Australia in 2022.
- Road crashes caused 40 000 people in Australia to be with hospitalized injuries in 2021 up from 27 000 in 2001.
- On Australia’s railways, 13 people died and 47 were seriously injured in 2022 (excludes suspected suicide).
Figure 1 Number of fatal crashes, by transport mode
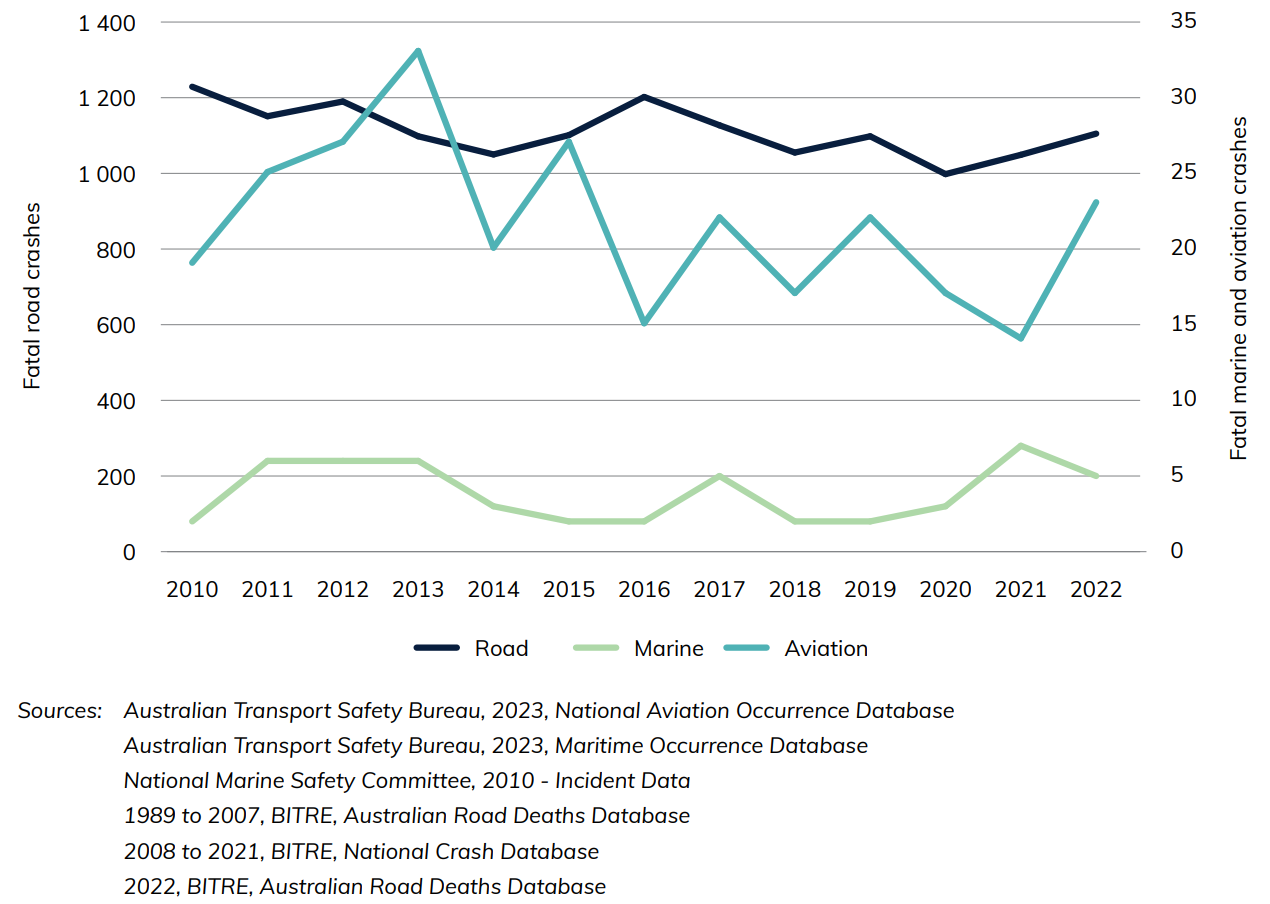
This graph shows the number of fatal crashes over time, by transport mode (with road crashes on the left axis and marine and aviation crashes on the right axis). Fatal road crashes (the number of crashes or accidents which resulted in at least one death) have been slowly trending downwards between 2010 and 2022, falling from 1 229 to 1 105, with an average of 1 112 over this period. There were 33 fatal aviation crashes in 2013 and they have remained between 14 and 23 since 2016. Marine fatal crashes have remained between 2 and 6 from 2010 to 2022.
Download data
Also see
Road-related Revenue and Expenditure
Chapter 3
This chapter provides information on the Government's total expenditures and sources of revenue for road-related activities for the Commonwealth, state and local Government (noting only expenditure is shown at the local level). A general overview for the Commonwealth is presented first, before expenditures (Table 3.1) and revenues (Table 3.2) are broken down at state/territory level. A variety of sources are used for this data, including data from the Australian Tax Office, the Australian Bureau of Statistics, the Department of Infrastructure, Transport, Regional Development, Communications and the Arts, the Commonwealth Budget, BITRE estimates and State and Territory Governments. For a more detailed breakdown, please refer to the endnotes for Chaptere 3.
- The public sector (National, state and local) spent $39 billion in roads in 2022–23.
- $31 billion in road-related revenue was collected (excluding road-related revenue from the Goods and Services Tax, Fringe Benefits Tax and the Luxury Car Tax).
Public sector road-related expenditure over time can be seen in Figuree 6.
Figure 6 Road-related expenditure, by level of government (constant 2022–23 prices, adjusted by CPI)
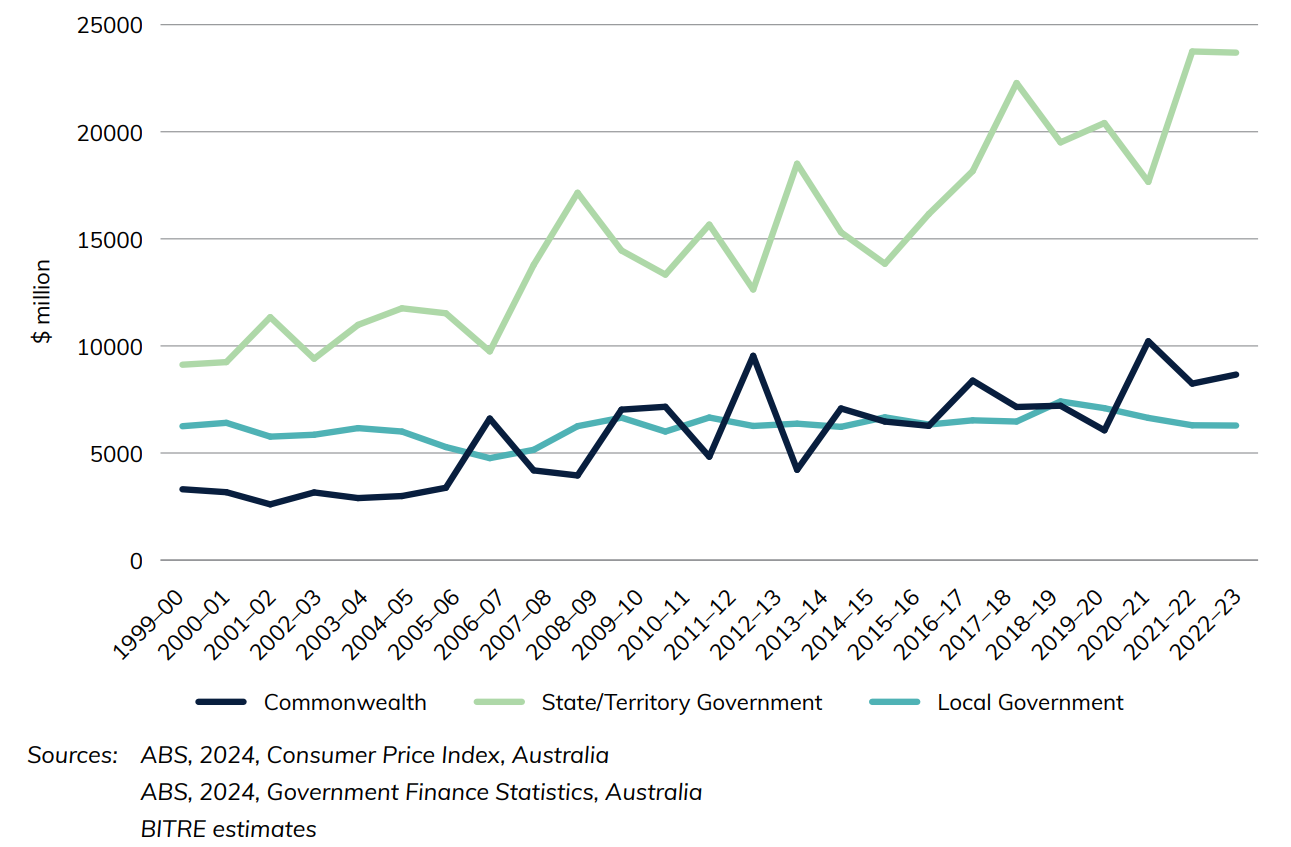
Figure 7 shows selected road-related revenues
Figure 7 Selected road-related revenues
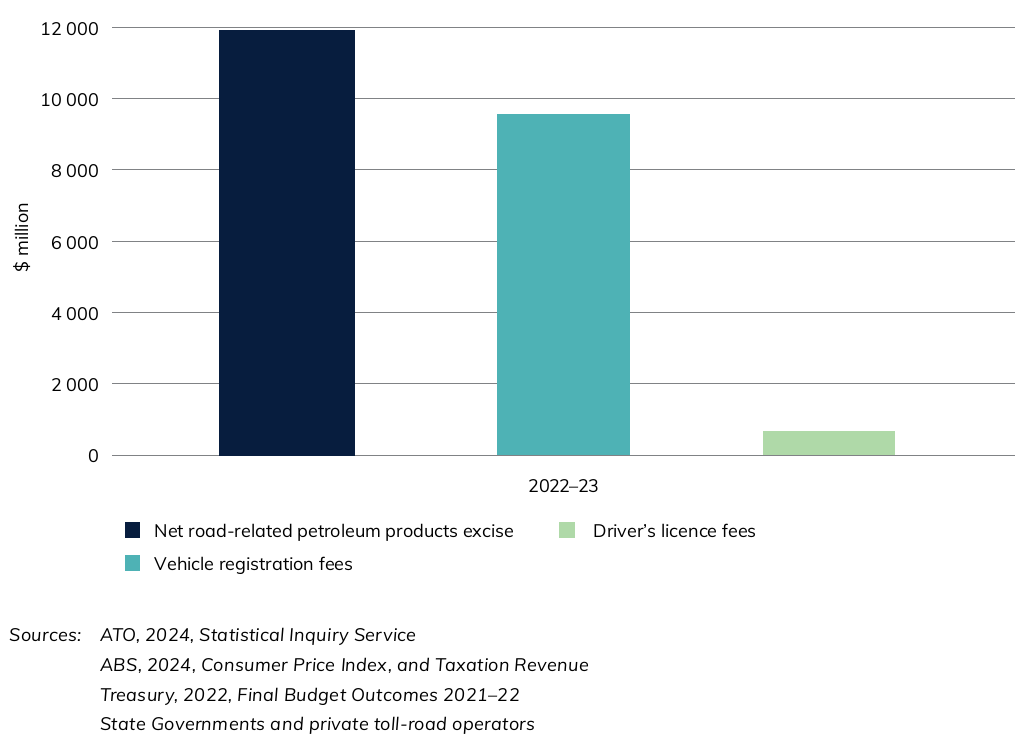
Figure 8 illustrates that the majority of revenue for the states/territories is vehicle registration fees.
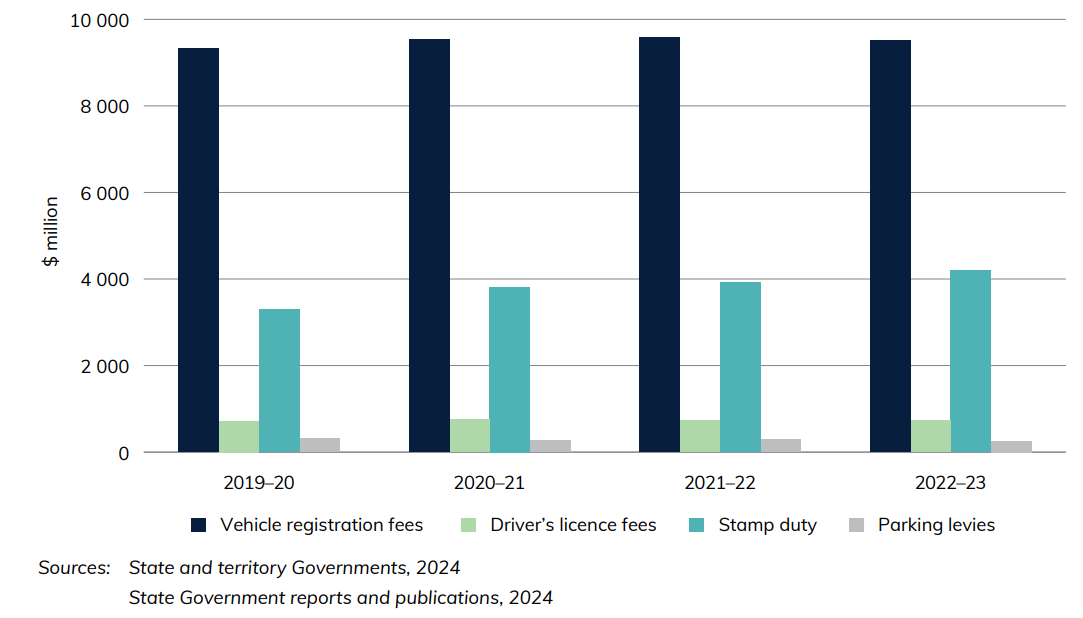
Figure 8 State and Territory Government Road-related revenues (excluding tolls)
Download data
- Road-related Revenue and Expenditure—Yearbook 2024 (234 KB) - Download Excel file
- Australian Infrastructure and Transport Statistics—Yearbook 2024 - Download PDF
Also see
Road-related Revenue and Expenditure
Chapter 3
This chapter provides information on the Government’s total expenditures and sources of revenue for road-related activities for the Commonwealth, state and local government (noting only expenditure is shown at the local level).
A general overview for the Commonwealth is presented first, before expenditures and revenues are broken down at state/territory level. A variety of sources are used for this data, including data from the Australian Tax Office, the Australian Bureau of Statistics, the Department of Infrastructure, Transport, Regional Development, Communications, Sport and the Arts, the Commonwealth Budget, BITRE estimates and State and Territory Governments.
- The public sector (national, state and local) spent $44 billion on roads in 2023-24.
- $36 billion in road-related revenue was collected by all governments (excluding road-related revenue from the Goods and Services Tax, Fringe Benefits Tax and the Luxury Car Tax).
Public sector road-related expenditure over time can be seen in Figure 5.
Figure 5 Road-related expenditure, by level of Government (constant 2023-24 prices, adjusted by CPI)
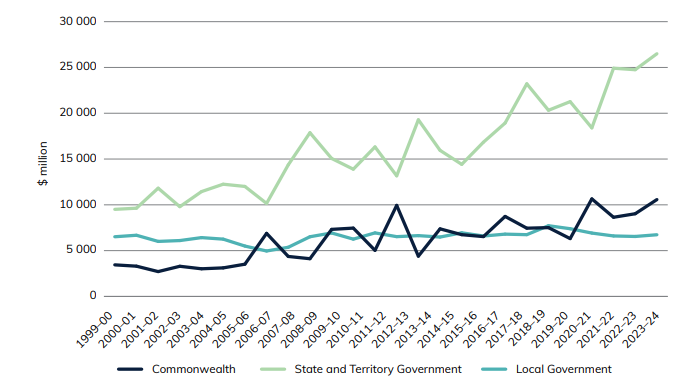
Sources: ABS (2025), Consumer Price Index, Australia
ABS (2025), Government Finance Statistics, Australia
BITRE estimates
Figure 6 illustrates that the majority of revenue for the states/territories is vehicle registration fees, and Figure 7 shows how road-related excise and registration revenue has changed over time.
Figure 6 Selected road-related revenues
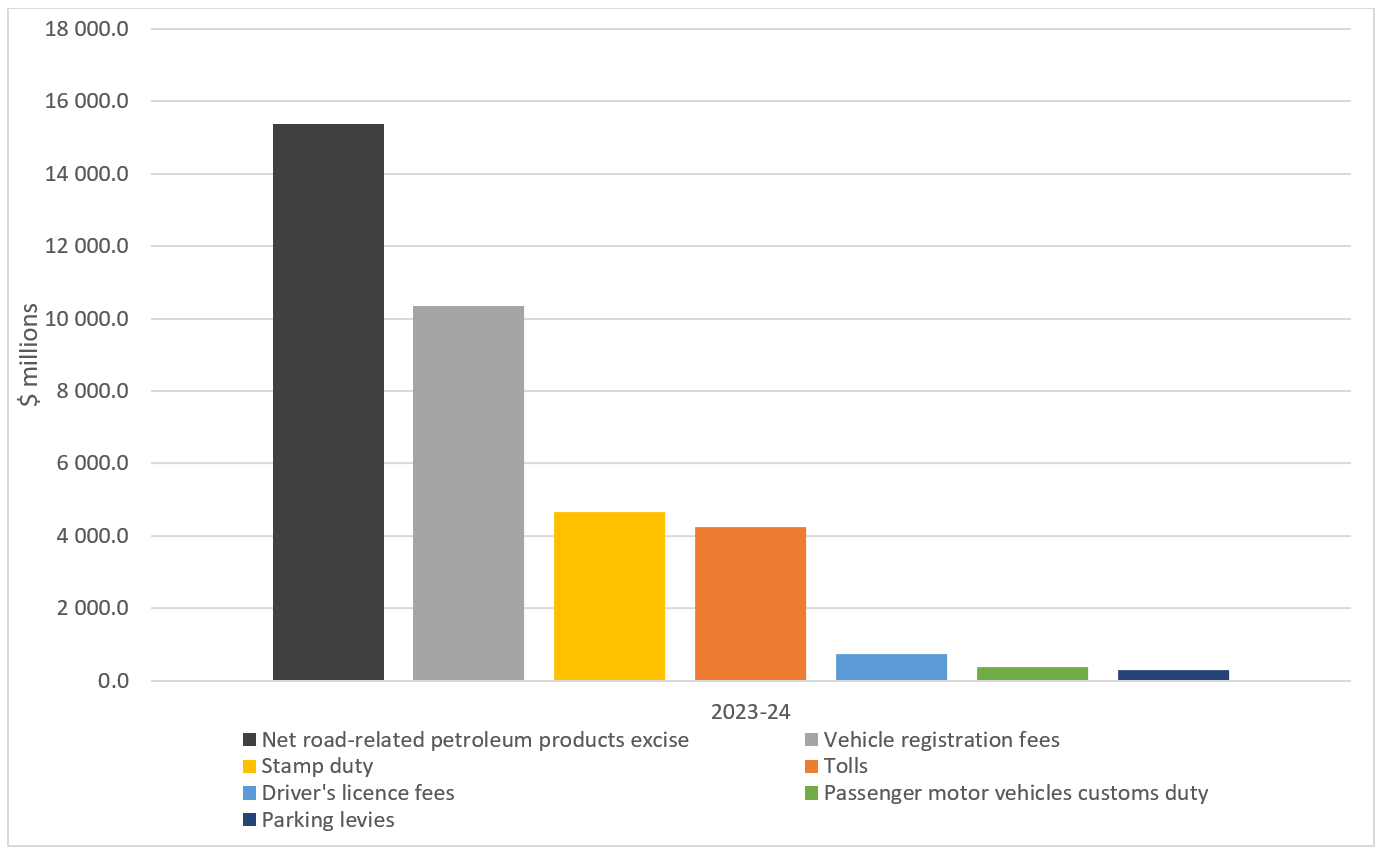
Sources: ATO (2025), Statistical Inquiry Service
ABS (2025), Consumer Price Index, and Taxation Revenue
Treasury (2022), Final Budget Outcomes 2021-22
State Governments and private toll-road operators
Figure 7 Road-related excise and registration revenue (2023-24 prices)
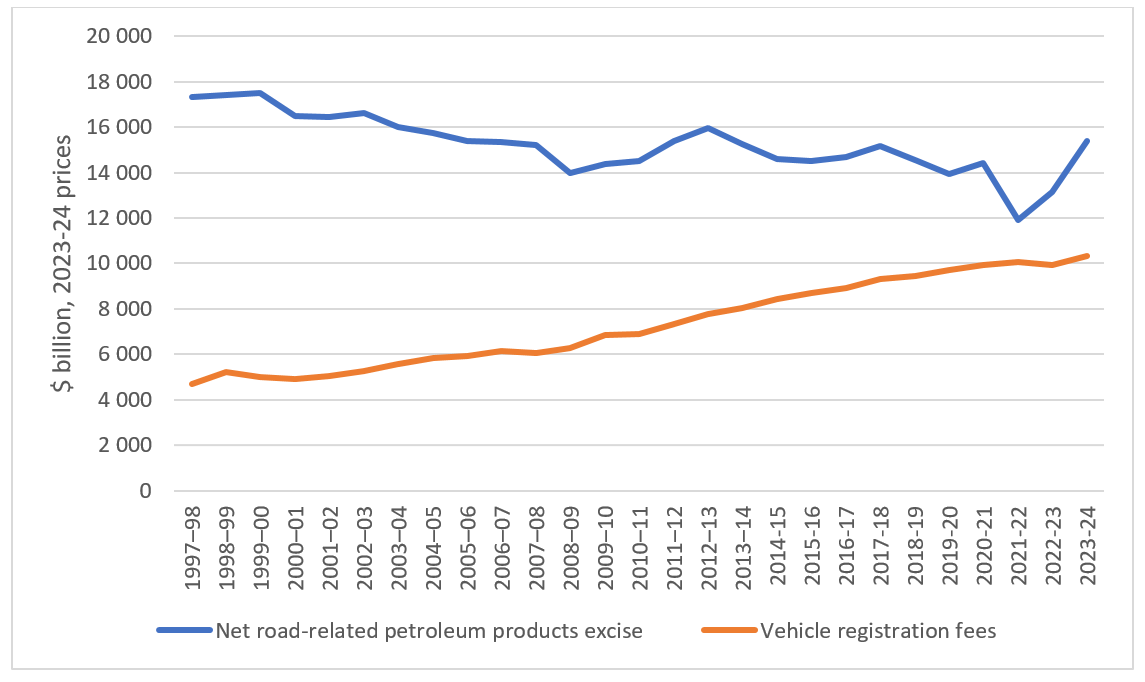
Sources: State and territory Governments, 2025
State Government reports and publications, 2025
ATO, BITRE estimates
Download data
- Road-related Revenue and Expenditure—Yearbook 2025 (153 KB) - Download Excel file
- Australian Infrastructure and Transport Statistics Yearbook 2025 - Download PDF
Also see
Chapter 4
This chapter provides information on Australian roads including length, use, the vehicle fleet, and the number of vehicle licences.
- An estimated 264 billion vehicle kilometres were travelled on Australia's roads in 2024–25.
- In 2024, there were 476,000 km of paved roads in Australia.
- 20 million Australians had vehicle licences at 2024–25.
- In 2024–25, Sports Utility Vehicles (SUVs) comprised 59% of new motor vehicle sales (excluding motorcycles) compared with only 33% ten years earlier.
Figure 8 shows total vehicle kilometres by vehicle type. Figure 9 shows Australia’s national road network. Total vehicle kilometres travelled fell significantly during the COVID pandemic, only surpassing their previous 2017–18 peak in 2023–24.
Figure 8 Vehicle kilometres travelled by vehicle type
Source: Table 4.2
Figure 9 Map of national road network
Source: DITRDCSA, 2022
Download data
- Road—Yearbook 2025 (266 KB) - Download Excel file
- Australian Infrastructure and Transport Statistics Yearbook 2025 - Download PDF