Related freight reports
For additional freight related information select the relevant publication below.
Freight chapter - Yearbook 2024
Chapter 4
Download data
- Australian Infrastructure and Transport Statistics Yearbook 2024 - Download PDF
- Freight—Yearbook 2024 (146 KB) - Download Excel file
Freight transport activity (Figures 9 and 10) is measured in terms of tonne kilometres (the number of tonnes moved by a vehicle multiplied by the distance the load travelled in kilometres). The Australian domestic freight task has experienced strong growth over the last 40 years, with road and rail freight now dominating domestic freight activity.
- Melbourne had the most metropolitan road freight estimated at 17.8 billion tonne-kilometres in 2023–24.
- NSW's estimated road freight for 2023–24 was the highest on record at 86 billion tonne-kilometres.
Figure 9 shows a map of Australia's major domestic freight flows by transport mode. Line and arrow thickness indicate the volume of freight carried on each route, not the value of freight or performance of supply chains. The map shows that the highest volume domestic freight route is iron ore transported by rail in the Pilbara region. This next largest individual flow is coal carried by rail in Central Queensland and the Hunter Valley, followed by bauxite shipped from Weipa and Gove to Gladstone.
Figure 9 Australia's Freight Flows Map
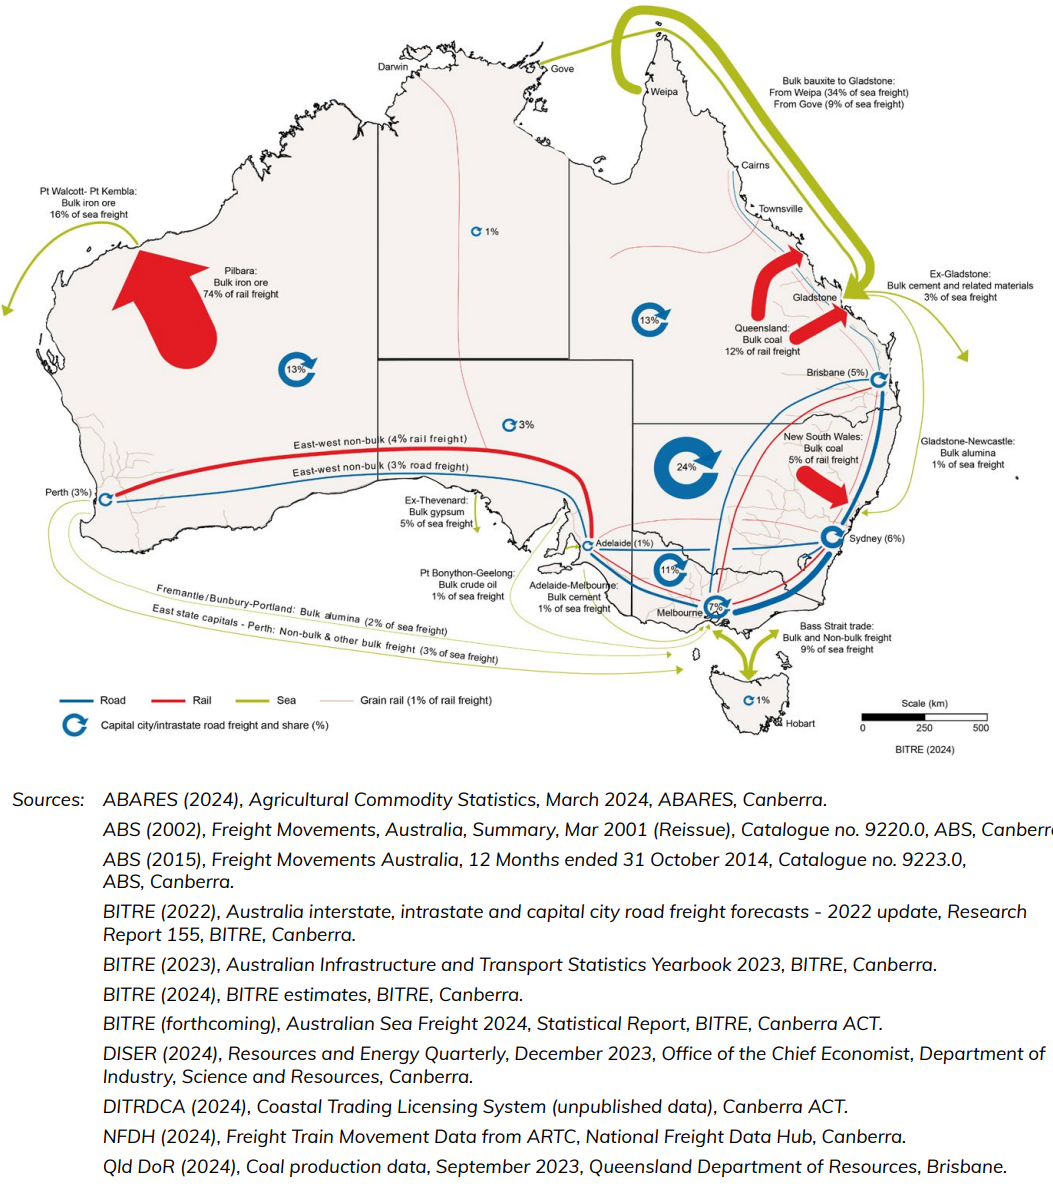
Figure 10 Australian domestic freight task, by mode of transport
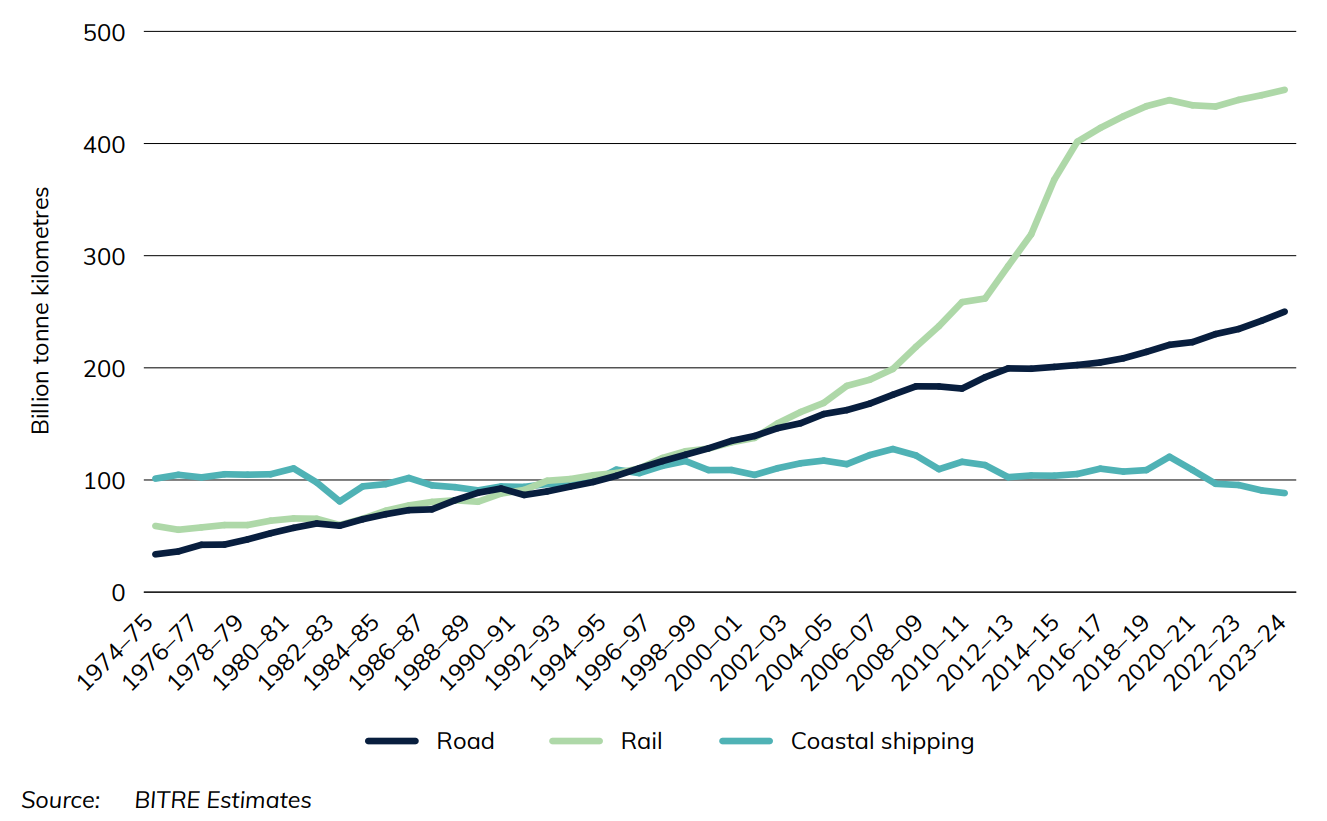
The Australian domestic freight task (Figure 2) has experienced strong growth over the last 40 years, with road and rail freight now dominating domestic freight activity.
Also see
Freight vehicle congestion in Australian capital cities – 2023
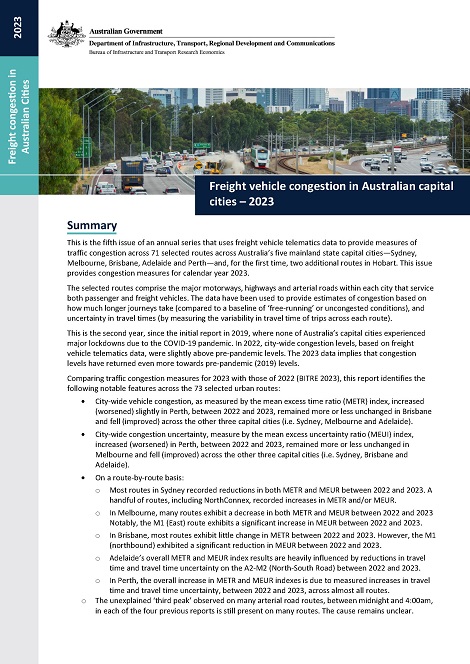
This publication is the fifth in an annual series that uses vehicle telematics data to provide measures of traffic congestion for freight vehicles on selected routes across Australia’s five mainland state capital cities – Sydney, Melbourne, Brisbane, Adelaide and Perth – and, for the first time, two additional routes in Hobart. The selected routes comprise the major motorways, highways and arterial roads within each city that service both passenger and freight vehicles. This release includes congestion measures for 73 separate routes. The estimates presented in this report cover calendar year 2023.
This is the second year, since the initial report in 2019, where none of Australia’s capital cities experienced major lockdowns as part of the COVID-19 pandemic, and city-wide congestion levels have more or less returned to pre-pandemic levels. City-wide freight vehicle congestion, as measured by the mean excess travel time index, increased (worsened) slightly in Perth, remained more or less unchanged in Brisbane, and declined (improved) in the Sydney, Melbourne and Adelaide between 2022 and 2023. Copies of the summary measure data displayed in the report are also available here.
Freight vehicle congestion in Australia's five major cities – 2022
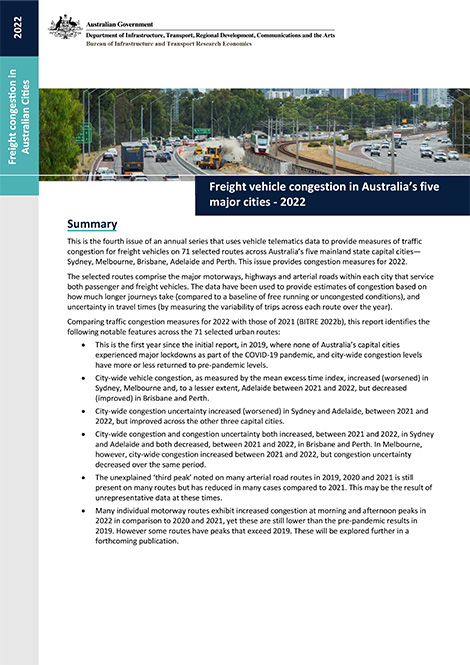
This publication is the fourth in an annual series that uses vehicle telematics data to provide measures of traffic congestion for freight vehicles for selected routes across Australia’s five mainland state capital cities—Sydney, Melbourne, Brisbane, Adelaide and Perth. The selected routes comprise the major motorways, highways and arterial roads within each city that service both passenger and freight vehicles. This release includes measures for 71 routes. The estimates presented in this report cover calendar year 2022, and include comparisons with 2021 traffic congestion levels.
This is the first year since the initial report, in 2019, where none of Australia’s capital cities experienced major lockdowns as part of the COVID-19 pandemic, and city-wide congestion levels have more or less returned to pre-pandemic levels. In particular, city-wide vehicle congestion, as measured by the mean excess time index, increased (worsened) in Sydney, Melbourne and, to a lesser extent, Adelaide between 2021 and 2022, but decreased (improved) in Brisbane and Perth. Many individual motorway routes exhibit increased congestion at morning and afternoon peaks in 2022, compared to 2020 and 2021. On some routes measured congestion is still lower than the pre-pandemic results in 2019. On other routes, congestion peaks exceed 2019 levels. Copies of the data displayed in the report are available here and on data.gov.au.
Freight vehicle congestion in Australia’s five major cities – 2021
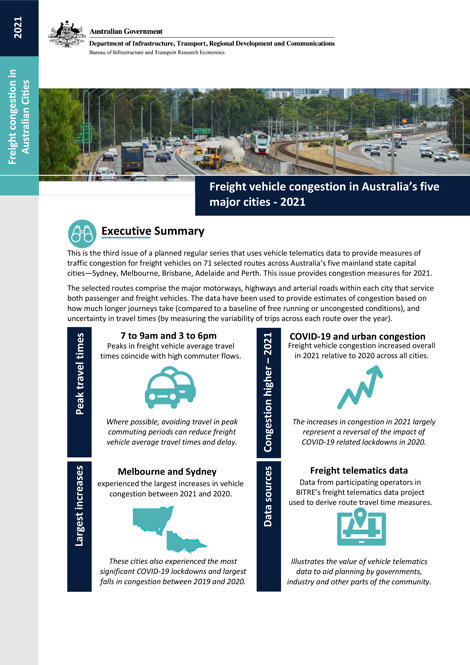
This publication is the third in the series that uses vehicle telematics data to provide measures of traffic congestion for freight vehicles for selected routes across Australia’s five mainland state capital cities—Sydney, Melbourne, Brisbane, Adelaide and Perth. The selected routes comprise the major motorways, highways and arterial roads within each city that service both passenger and freight vehicles. This release includes measures for 71 routes. The estimates presented in this report cover calendar year 2021, and include comparisons with 2020 traffic congestion levels.
The results show that freight vehicle congestion returned to pre-pandemic levels across all five mainland Australian capital cities in 2021, largely due to the return of commuter traffic in our cities, particularly during peak periods, following the impact of COVID-19 lockdowns in 2020. In particular, freight vehicle traffic congestion increases in 2021 were larger in Melbourne, and to a lesser extent Sydney, where lockdown-related reductions in congestion observed in 2020 were most significant. Relative to pre-COVID-19 congestion levels in 2019, freight vehicle congestion increases have been most significant in proportionate terms across Brisbane routes, even higher than experienced across Sydney and Melbourne routes. Brisbane routes also experienced the largest increases in average excess travel time variability (uncertainty) since 2019, greater than in Sydney and Melbourne. Copies of the data displayed in the report are available here and on data.gov.au.
Freight vehicle congestion in Australia’s five major cities – 2020
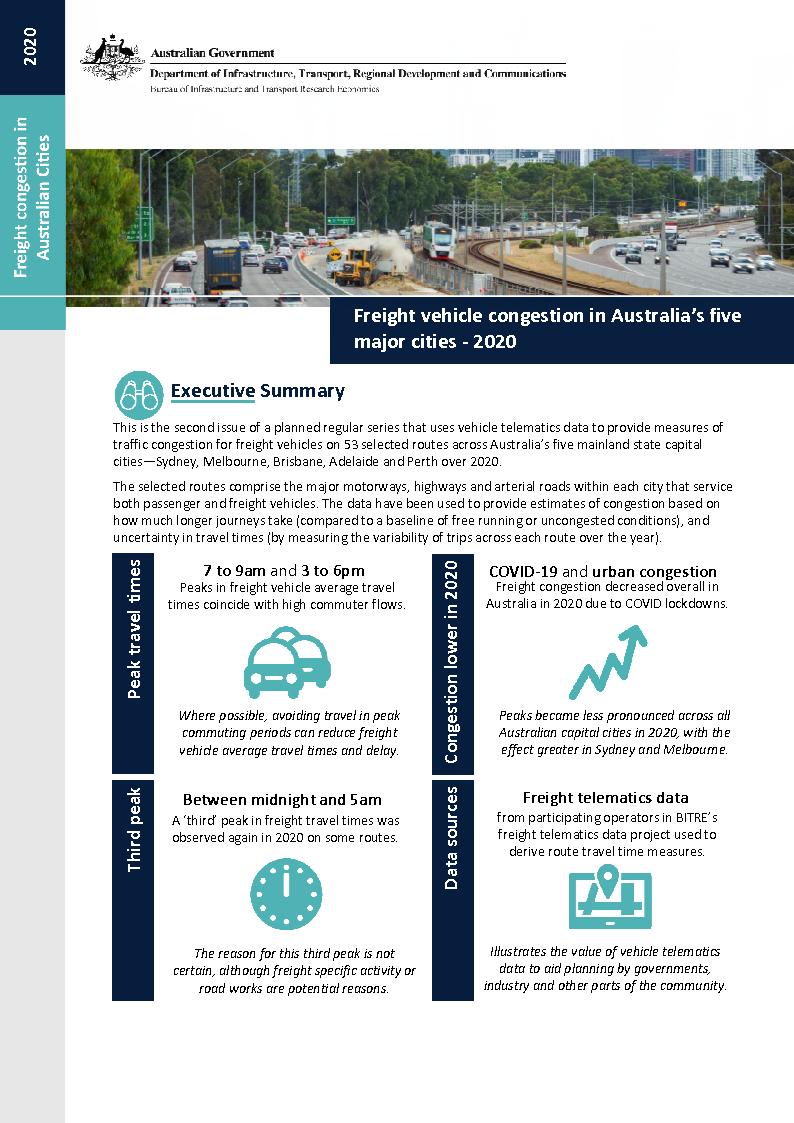
This publication is the second in a planned regular series that uses vehicle telematics data to provide measures of traffic congestion for freight vehicles on 53 selected routes across Australia’s five mainland state capital cities—Sydney, Melbourne, Brisbane, Adelaide and Perth. The selected routes comprise the major motorways, highways and arterial roads within each city that service both passenger and freight vehicles. The estimates presented in this report cover calendar year 2020, and includes a comparison with 2019 traffic congestion measures.
The results show that freight vehicle congestion decreased across all five mainland Australian capital cities in 2020, largely due to lower commuter activity on roads, particularly in peak periods, as a result of COVID-19 lockdowns. Whilst peak period travel times were less pronounced in 2020 across all cities, this effect was more significant in Sydney and Melbourne, because those cities had larger pre-COVID-19 traffic peaks and experienced longer lockdowns (particularly Melbourne), and less significant in other state capital cities. Copies of the data displayed in the report are available here and on data.gov.au.
Freight vehicle congestion in Australia’s five major cities - 2019

This publication is the first of a planned annual series that uses vehicle telematics data to provide measures of traffic congestion for freight vehicles on 53 selected routes across Australia’s five mainland state capital cities—Sydney, Melbourne, Brisbane, Adelaide and Perth. The selected routes comprise the major motorways, highways and arterial roads within each city that service both passenger and freight vehicles. The estimates presented in this report cover calendar year 2019.
The results show peaks in freight vehicle average travel times coincide with morning and evening peak commuter flows—for instance motorways tend to show morning peaks moving towards city CBDs and afternoon peaks moving away from it. Urban motorways exhibit more distinct travel time peak periods than non-motorway routes.