Trainline is a compendium of Australia's railways, providing insights, analysis and an understanding of the railway industry. Australia's railways are evolving via changes inside and outside the industry, including changes in logistics, commodity flows, technology, urban patronage and regional passenger services.
Australian Sea Freight 2023-24
Statistical reports providing information on Australian sea freight movements, vessel activity, the use of coastal trading licences and the size and composition of the Australian trading fleet.
Waterline reports on trends in throughput, container handling productivity on the waterfront and landside of ports in Australia and the cost of importing and exporting containers via 5 major container ports.
Australian Infrastructure and Transport Statistics Yearbook 2023 and Freight chapter
Chapter 4
Download data
Australian
This chapter focuses on Freight and explores the amount of goods moved in the Australian economy. The data from this chapter is sourced from BITRE’s Trainline and Australian Sea Freight publications, along with other unpublished estimates.
- Melbourne had the most metropolitan road fright estimated at 17.1 billion tonne‑kilometres in 2022‑23.
- NSW’s estimated road freight for 2022-23 was the highest on record at 84 billion tonne‑kilometres.
Figure 1 Australia’s Domestic freight, 2022-23
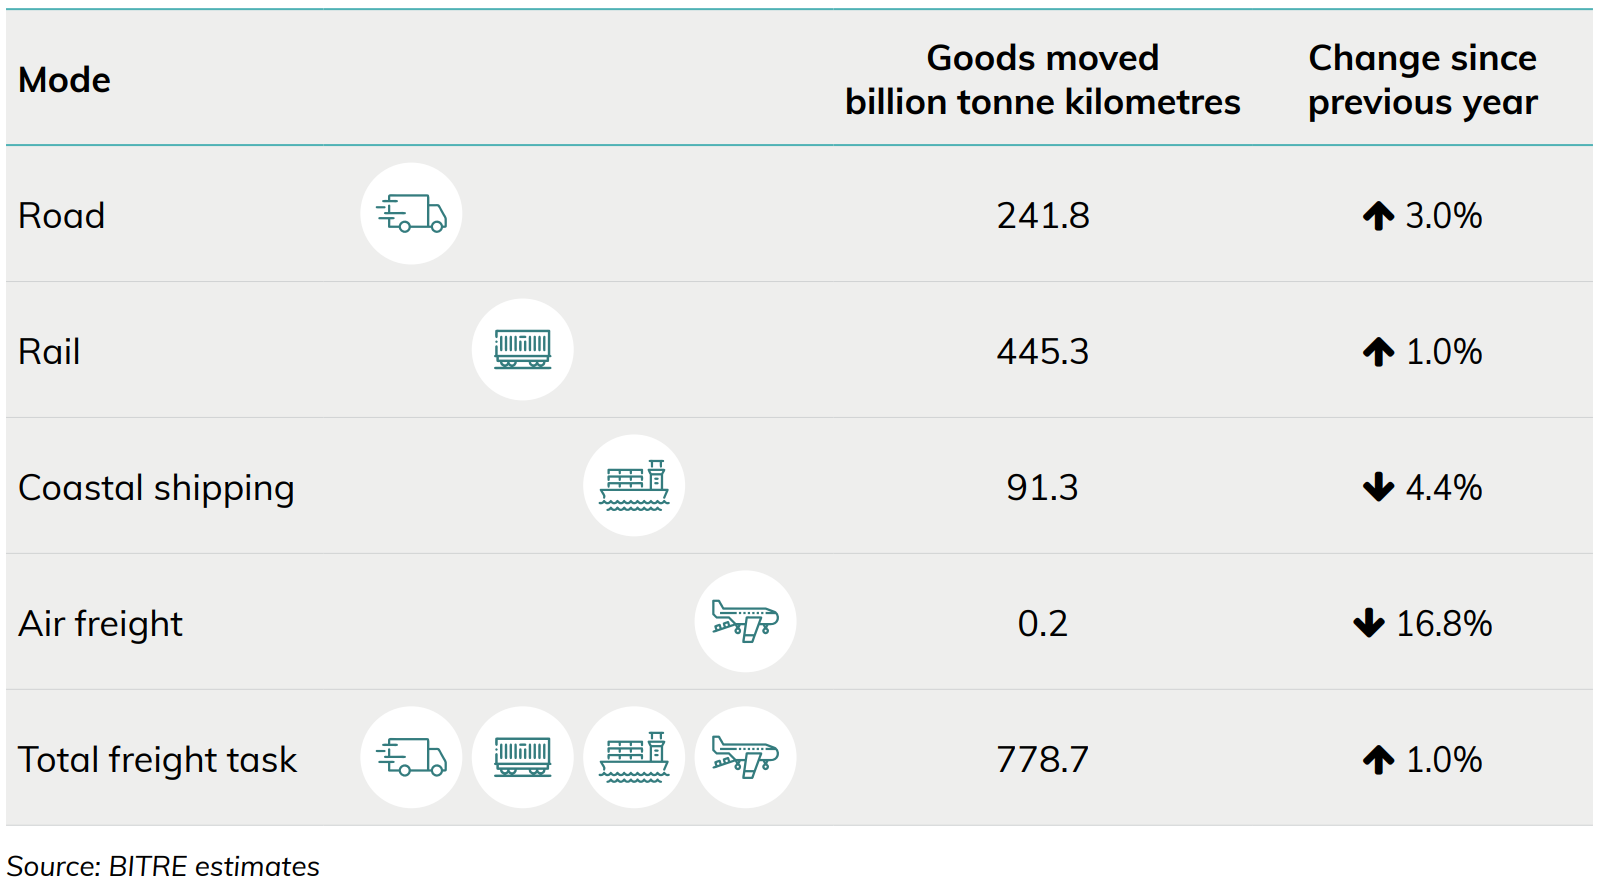
Freight transport activity (Figure 1) is measured in terms of tonne kilometres (the number of tonnes moved by a vehicle multiplied by the distance the load travelled in kilometres).
Figure 2 Australian domestic freight task, by mode of transport
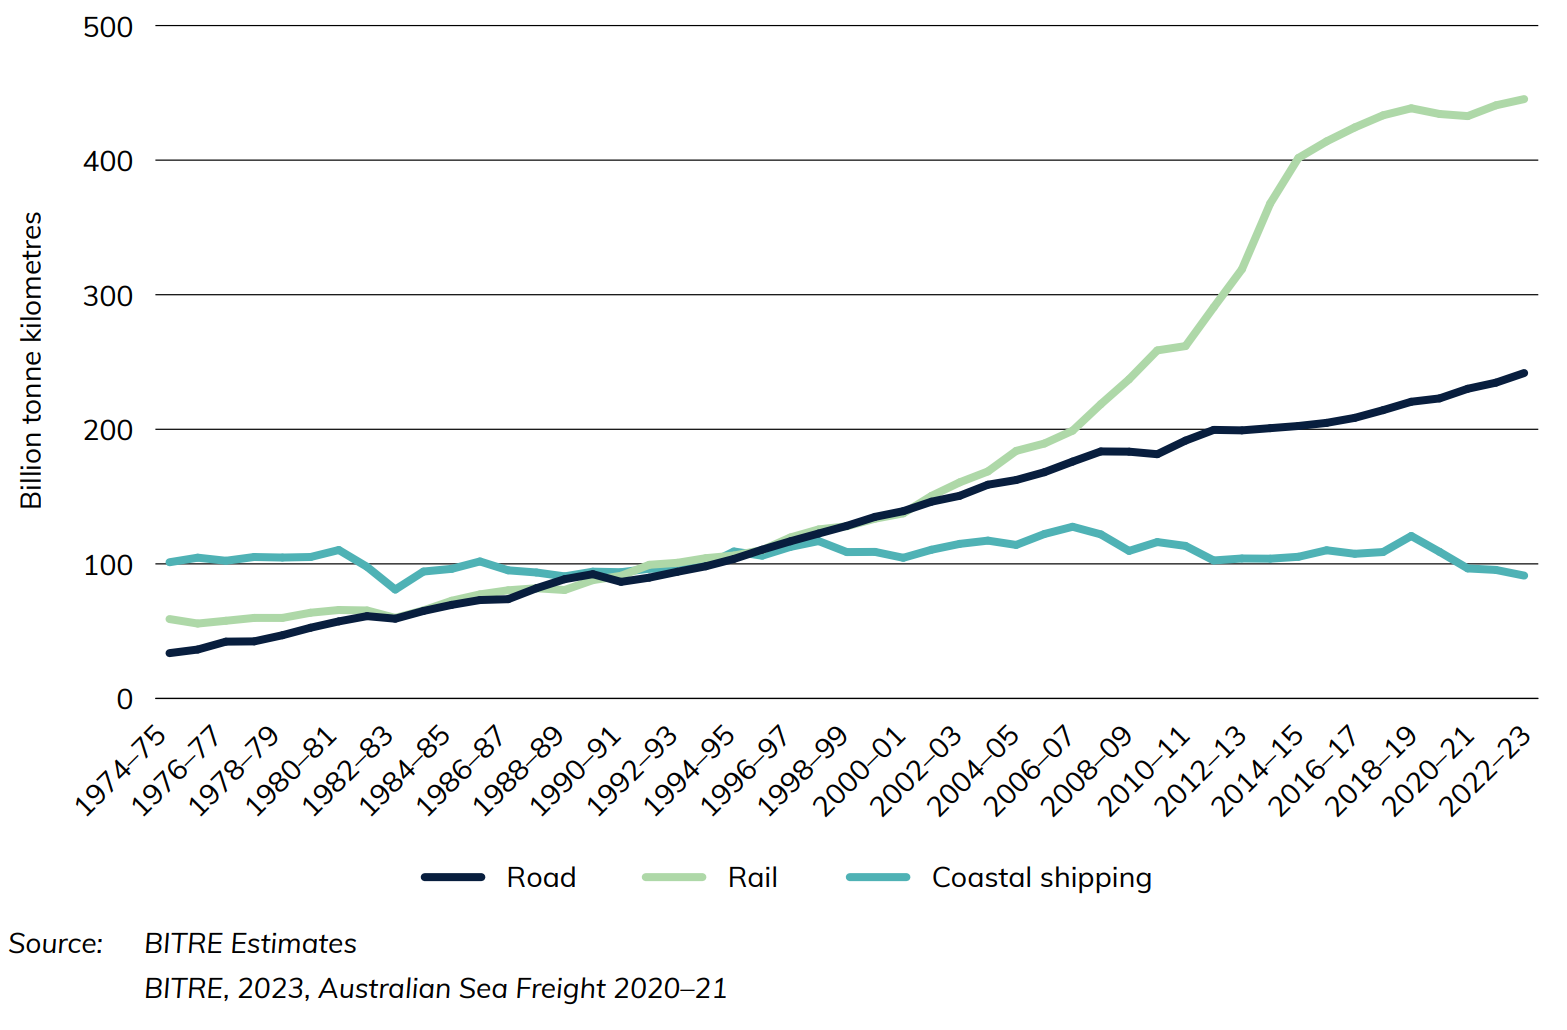
The Australian domestic freight task (Figure 2) has experienced strong growth over the last 40 years, with road and rail freight now dominating domestic freight activity. During the COVID-19 pandemic, the total bulk and non-bulk freight task fell slightly, from its height of 780.0 billion tkm in 2018-19 to 759.7 billion tkm in 2020-21. It has grown over the last two years, however, reaching its second-highest point in 2022-23 of 778.7 billion tkm.
Also see
Australian Infrastructure and Transport Statistics Yearbook 2023 and Shipping chapter
Chapter 9
Download data
This chapter provides information on Australian ships, cargo, ports and fleet including mileage, tonnage and number of vessels. The data is sourced from BITRE’s Australian Sea Freight publication, BITRE’s Waterline publication and BITRE estimates based on Lloyds List Intelligence Data.
- There were 55 Australian registered vessels in the Australian trading fleet, including small vessels, and 73 overseas registered vessels in 2021-22.
- Queensland had the largest discharged volume with 40 million tonnes in 2020-21. Following Queensland, was New South Wales and Victoria with 33 million tonnes discharged each.
- Western Australian ports loaded 1 004 million tonnes of maritime cargo in 2020-21, the largest volume in Australia. Next, Queensland and New South Wales loaded 289 million tonnes and 176 million tonnes respectively. Together the ports in these three states loaded 94 per cent of Australia's maritime cargo by volume in 2020‑21.
- 8.6 million TEUs (twenty-foot equivalent units) were exchanged at container terminals in Brisbane, Sydney, Melbourne, Fremantle and Adelaide in 2022-23.
Figure 1 Principal Australian ports, by commodity
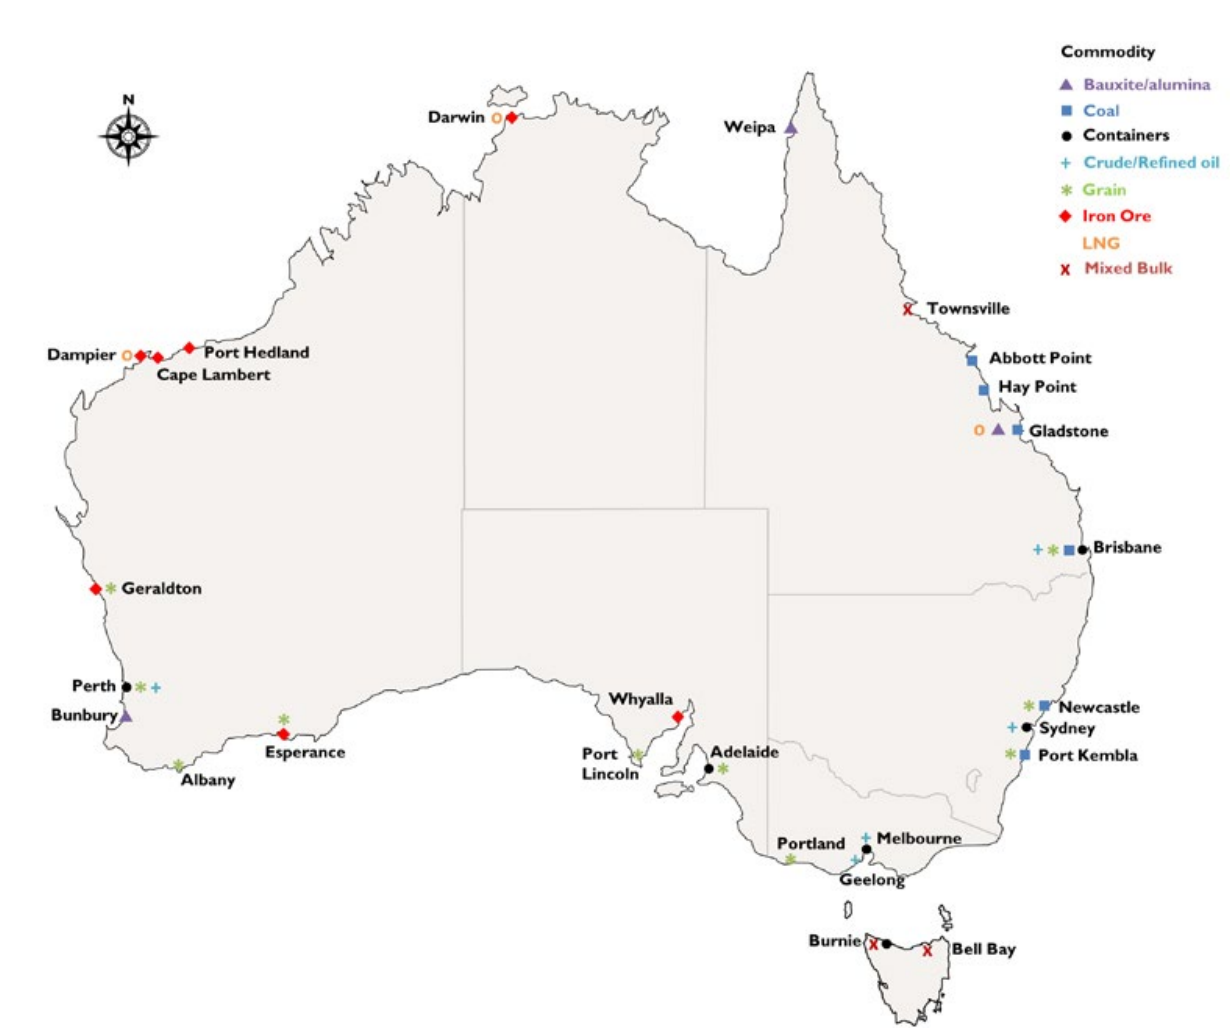
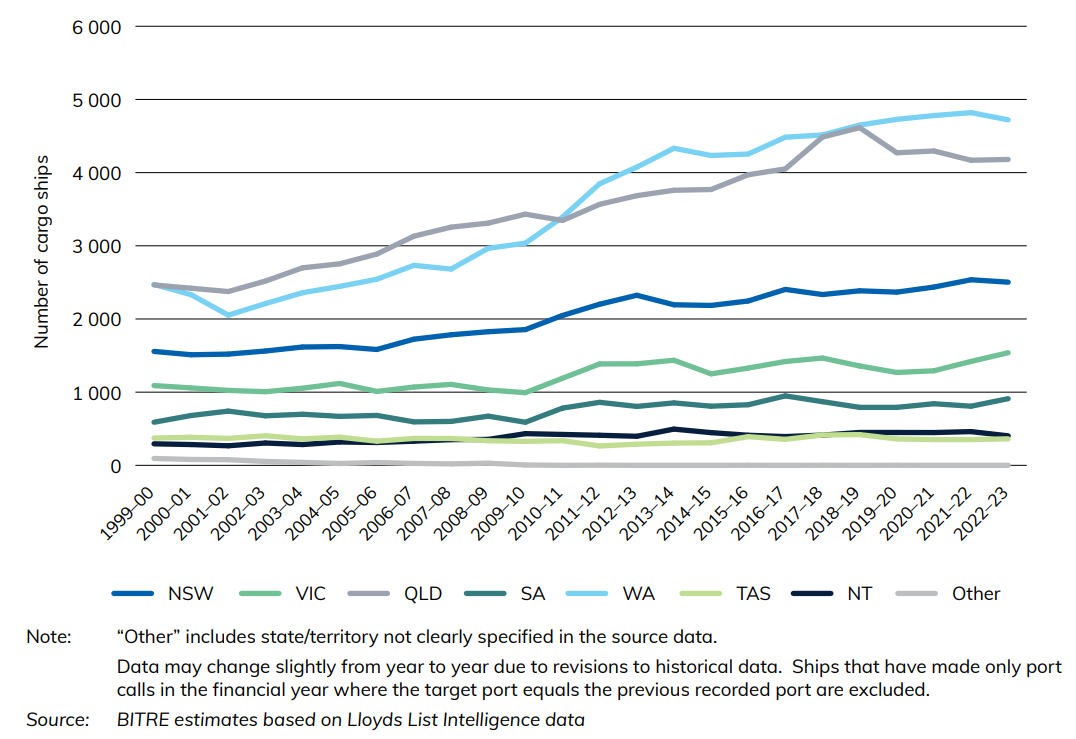
Figure 2 Number of cargo ships involved in coastal or international voyages that made port calls, by state/territory
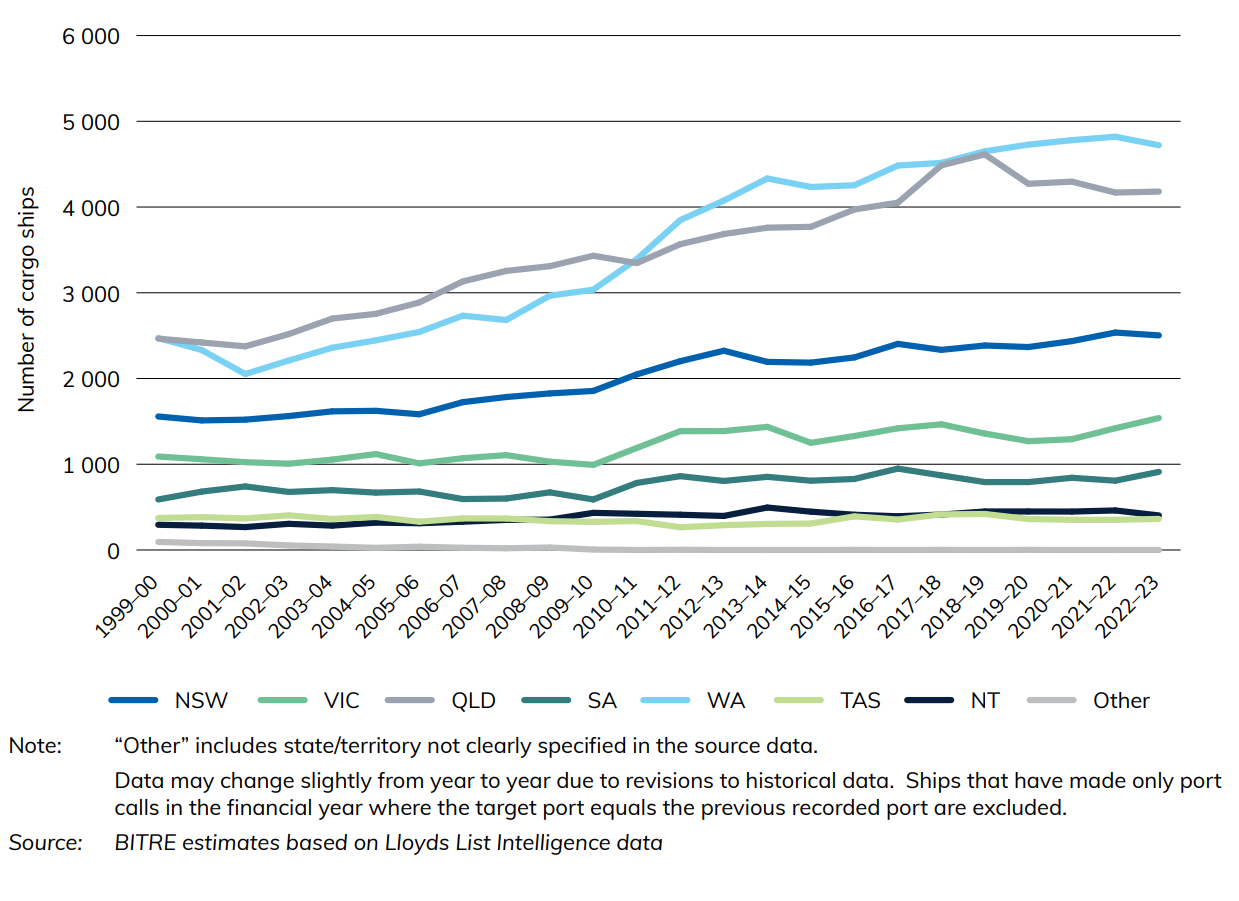
Figure 2 provides a state breakdown of the number of cargo ships on coastal or international voyages who made port calls, from 1999-00 to 2021-22. The majority of states saw increases during this time period. Queensland and Western Australia experienced the largest numerical increases and were consistently Australia’s two most visited states by cargo ships.
Also see
Transport Energy and Environment
Chapter 11
This chapter provides information on the Australian measures of transport energy and the environment. Data is sourced from the Department of Climate Change, Energy, the Environment and Water’s petroleum statistics and BITRE estimates.
- Road vehicles made up 84 percent of full fuel cycle greenhouse gas emissions from all domestic transport modes in 2022-23, compared to 9 per cent from aviation.
- The national average price for petrol was 182.9 cents per litre in the 2022‑23 financial year.
- In 2022-23, domestic road vehicle full fuel cycle greenhouse gas emissions estimates (carbon dioxide equivalent) reached a record high level of 106 000 gigagrams of CO2 equivalent.
- In 2022-23, there was an estimated 56 billion litres of transport petroleum sold in Australia.
Figure 1 Selected refined petroleum products—Australian production
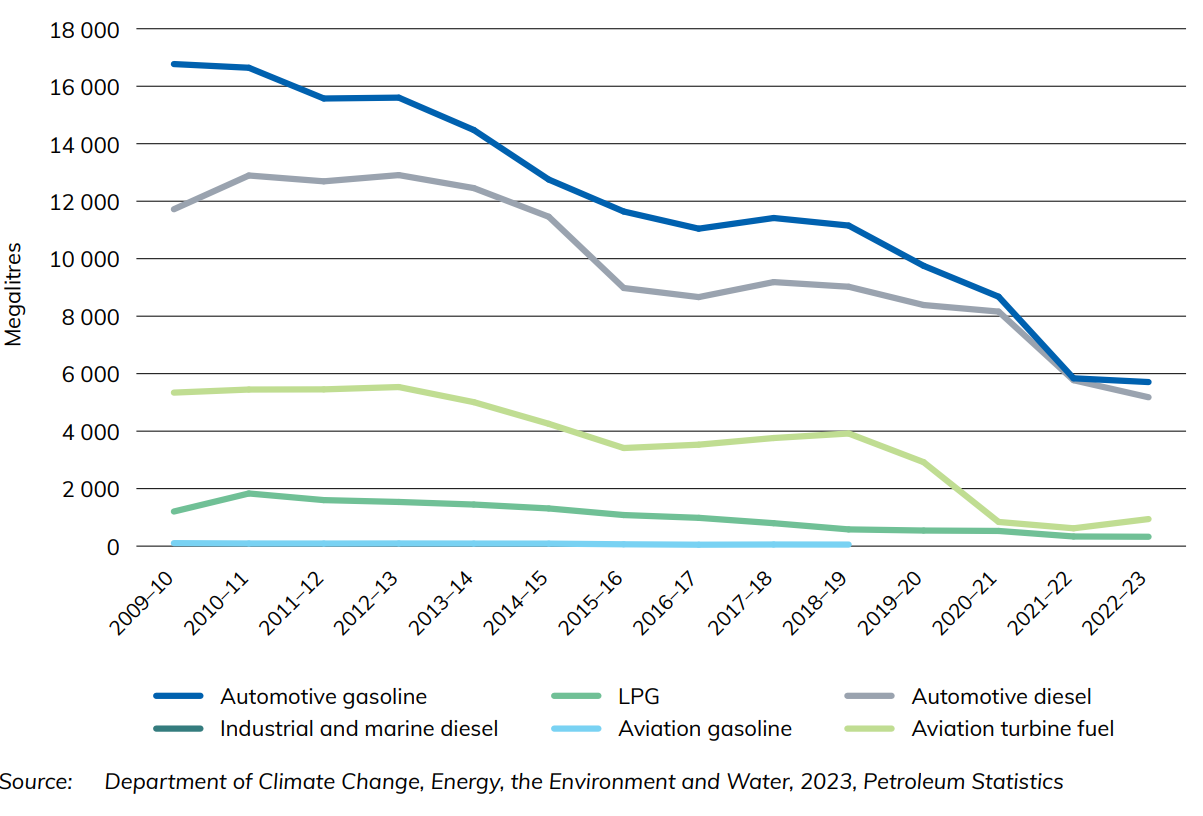
Figure 1 shows the change in production of selected refined petroleum products in Australia since 2009-10. It highlights how Australia’s production of these selected refined petroleum products is declining with time.
Figure 2 Selected refined petroleum products—imports to Australia

Figure 2 depicts the change in selected refined Australian petroleum imported for various transport industries as at June of each financial year.
Figure 3 Selected refined petroleum products—exports from Australia

Figure 3 shows the change in selected refined Australian petroleum exported for various transport industries as at June of each financial year.
Figure 4 Transport full fuel cycle greenhouse gas emissions
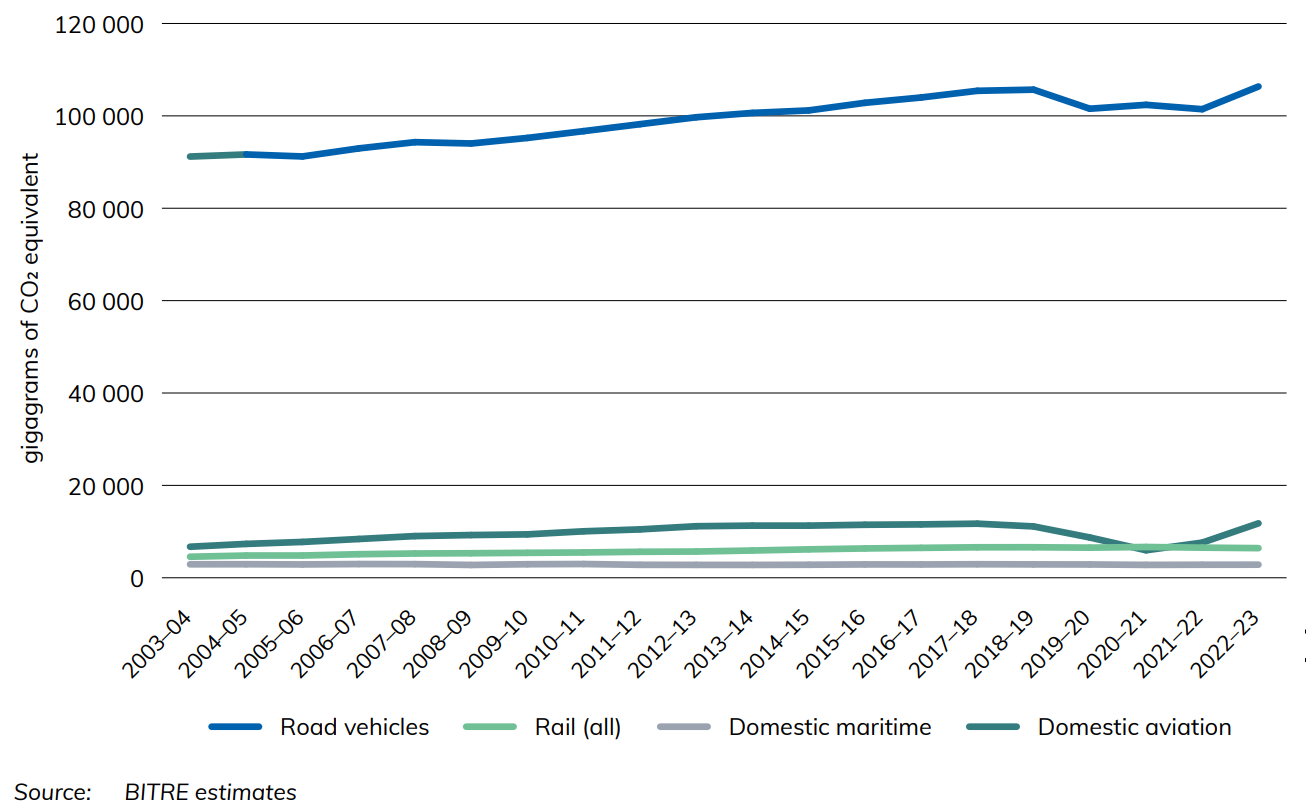
Figure 4 shows full fuel cycle greenhouse gas emissions by transport mode in gigagrams of CO2 equivalent. Transport emissions estimates in Australia have risen steadily since 1974-75, except over the COVID-19 pandemic period, which saw them dip temporarily for road vehicles and domestic aviation. Domestic aviation emissions were most affected, almost halving from 11 116 gigagrams of CO2 equivalent in 2018-19 to 5 955 gigagrams of CO2 equivalent in 2020-21, while road vehicle emissions fell by roughly 3 per cent over the same period. In 2022-23, estimates of emissions from domestic aviation and road vehicles both increased to their new highest levels, 11 784 and 106 355 gigagrams of CO2 equivalent respectively.
Download data
Also see
Tasmanian Freight Equalisation Scheme Monitoring Reports
The Tasmanian Freight Equalisation Scheme (TFES) provides financial assistance for cost incurred by shippers of eligible non-bulk goods moved by sea across the Bass Strait. More information about the operation of the Scheme can be found at Tasmanian Freight Equalisation Scheme | Department of Infrastructure, Transport, Regional Development, Communications and the Arts.
Under the TFES Ministerial Directions, BITRE provides a statistical report on all components of the Scheme every four years. The Monitoring Reports and other reports related to the scheme are linked below.
Monitoring Reports
- Tasmanian Freight Equalisation Scheme Monitoring Report 2024
- Consultation Draft Tasmanian Freight Equalisation Scheme Monitoring Report 2024
- Monitoring report 2020 Tasmanian Freight Equalisation Scheme
Other Reports
- Tasmanian Freight Equalisation Scheme - Review of the expanded component: Final Report (2018)
- Tasmanian Freight Equalisation Scheme: A 'Landbridge' Approach to the Estimation of Subsidy Rates (1981)
- Tasmanian Freight Equalisation Scheme: Recommended Rates of Assistance for Southbound Cargoes, Livestock and Timber at 31 January 1979
- Tasmanian Freight Equalisation Scheme: Recommended Northbound Assistance Rates at 1 January 1978
- Tasmanian Freight Equalisation Scheme: Discussion Paper September 1996
Tasmanian Freight Schemes Parameter Reviews
Freight chapter - Yearbook 2024
Chapter 4
Download data
- Australian Infrastructure and Transport Statistics Yearbook 2024 - Download PDF
- Freight—Yearbook 2024 (146 KB) - Download Excel file
Freight transport activity (Figures 9 and 10) is measured in terms of tonne kilometres (the number of tonnes moved by a vehicle multiplied by the distance the load travelled in kilometres). The Australian domestic freight task has experienced strong growth over the last 40 years, with road and rail freight now dominating domestic freight activity.
- Melbourne had the most metropolitan road freight estimated at 17.8 billion tonne-kilometres in 2023–24.
- NSW's estimated road freight for 2023–24 was the highest on record at 86 billion tonne-kilometres.
Figure 9 shows a map of Australia's major domestic freight flows by transport mode. Line and arrow thickness indicate the volume of freight carried on each route, not the value of freight or performance of supply chains. The map shows that the highest volume domestic freight route is iron ore transported by rail in the Pilbara region. This next largest individual flow is coal carried by rail in Central Queensland and the Hunter Valley, followed by bauxite shipped from Weipa and Gove to Gladstone.
Figure 9 Australia's Freight Flows Map
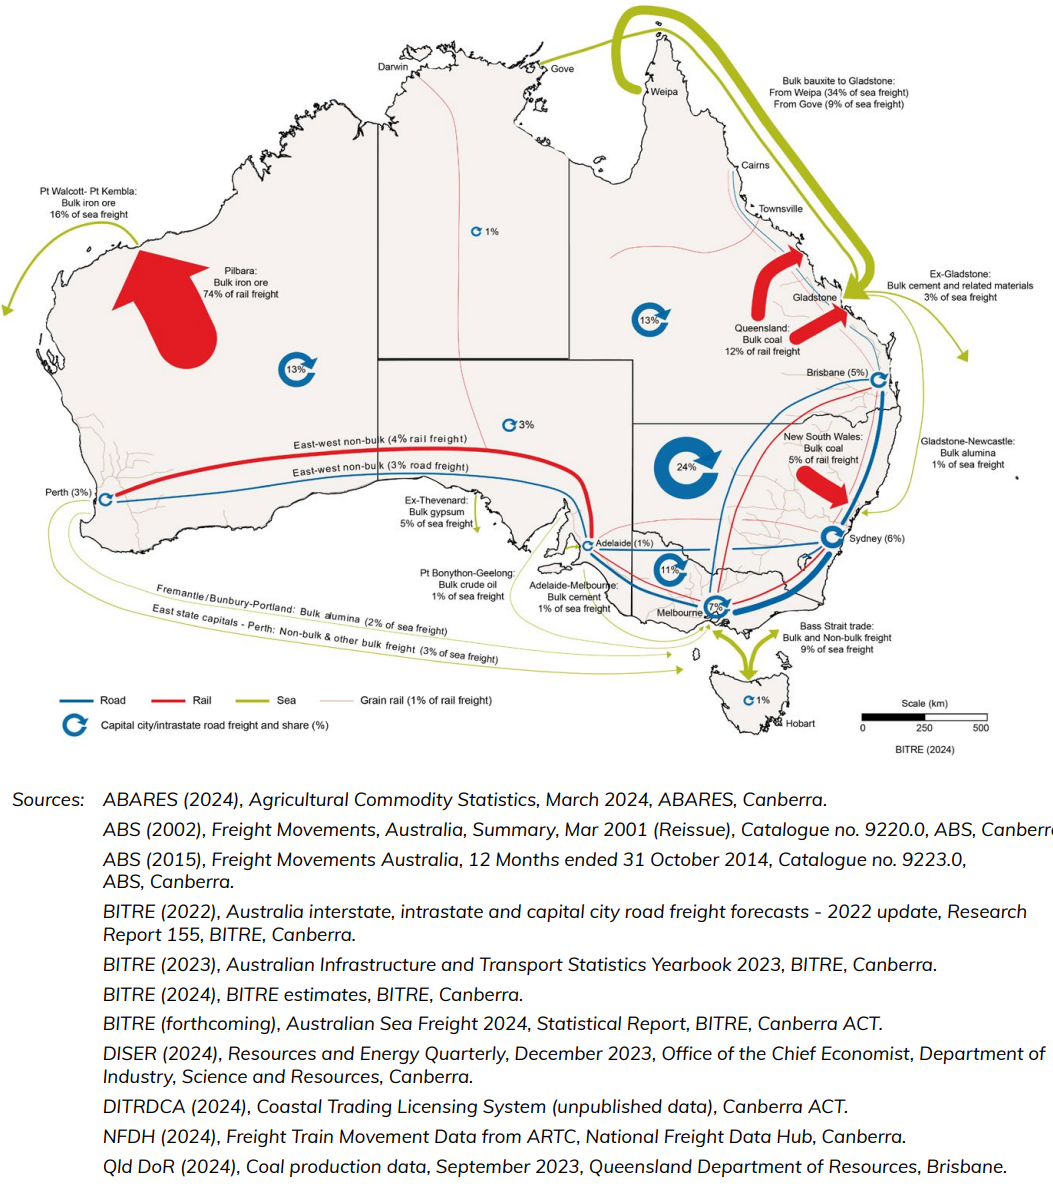
Figure 10 Australian domestic freight task, by mode of transport
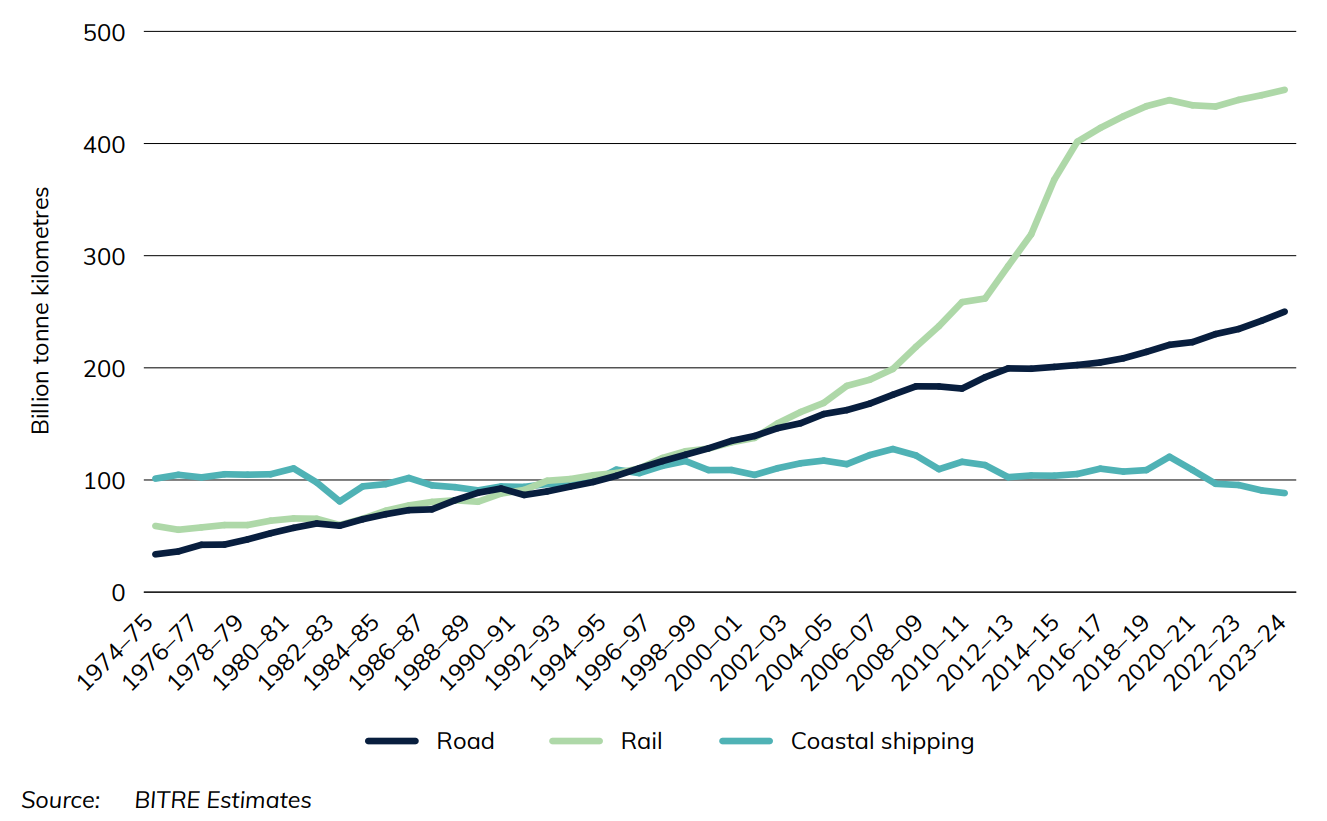
The Australian domestic freight task (Figure 2) has experienced strong growth over the last 40 years, with road and rail freight now dominating domestic freight activity.
Also see
Chapter 9: shipping
Download data
- Shipping—Yearbook 2024 (136 KB) - Download Excel file
- Australian Infrastructure and Transport Statistics—Yearbook 2024 - Download PDF
This chapter provides information on Australian ships, cargo, ports and fleet including mileage, tonnage and number of vessels. The data is sourced from BITRE's Australian Sea Freight publication, BITRE's Waterline publication and BITRE estimates based on Lloyds List Intelligence Data.
- There were 53 Australian registered vessels in the Australian trading fleet, including small vessels, and 83 overseas registered vessels in 2022–23.
- Queensland had the largest discharged volume with 40 million tonnes in 2020–21. Following Queensland was New South Wales and Victoria with 33 million tonnes discharged each.
- Western Australian ports loaded 1 billion tonnes of maritime cargo in 2020–21, the largest volume in Australia. Next, Queensland and New South Wales loaded 289 million tonnes and 176 million tonnes respectively. Together the ports in these 3 states loaded 94% of Australia's maritime cargo by volume in 2020–21.
- 8.6 million TEUs (twenty-foot equivalent units) were exchanged at container terminals in Brisbane, Sydney, Melbourne, Fremantle and Adelaide in 2022–23.
Figure 19 Principal Australian ports, by commodity
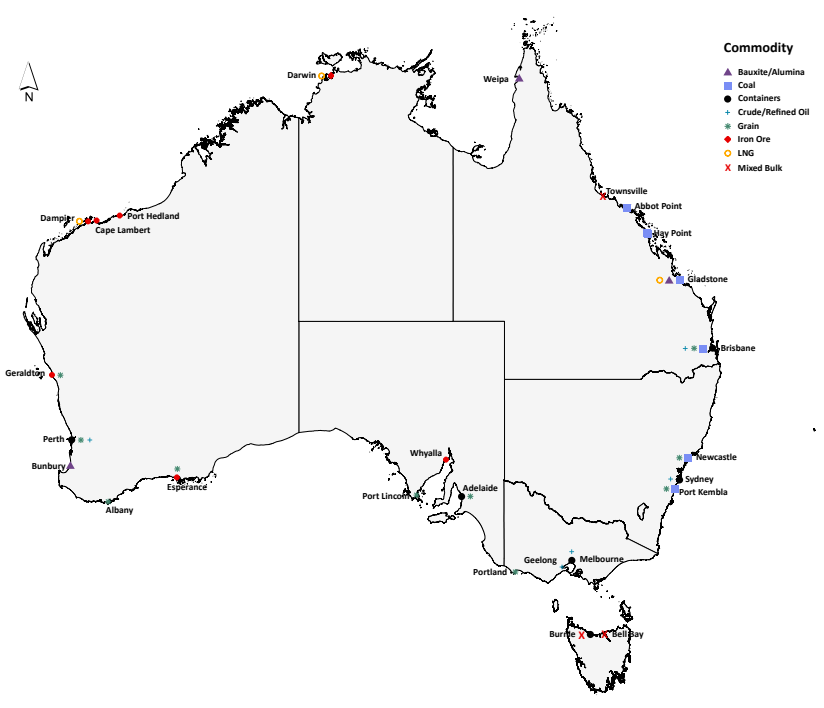
Figure 20 provides a state breakdown of the number of cargo ships on coastal or international voyages that made port calls from 1999-00 to 2022-23. The majority of states saw increases during this time period. Queensland and Western Australia experienced the largest numerical increases and were consistently Australia's 2 most-visited states by cargo ships.
Figure 20 Number of cargo ships involved in coastal or international voyages that made port calls, by state/territory
Also see
Australian Infrastructure and Transport Statistics Yearbook 2025: Freight chapter
Chapter 1: Freight
- Australian Infrastructure and Transport Statistics Yearbook 2025 - Download full report PDF
- Freight—Yearbook 2025 (128 KB) - Download Excel file
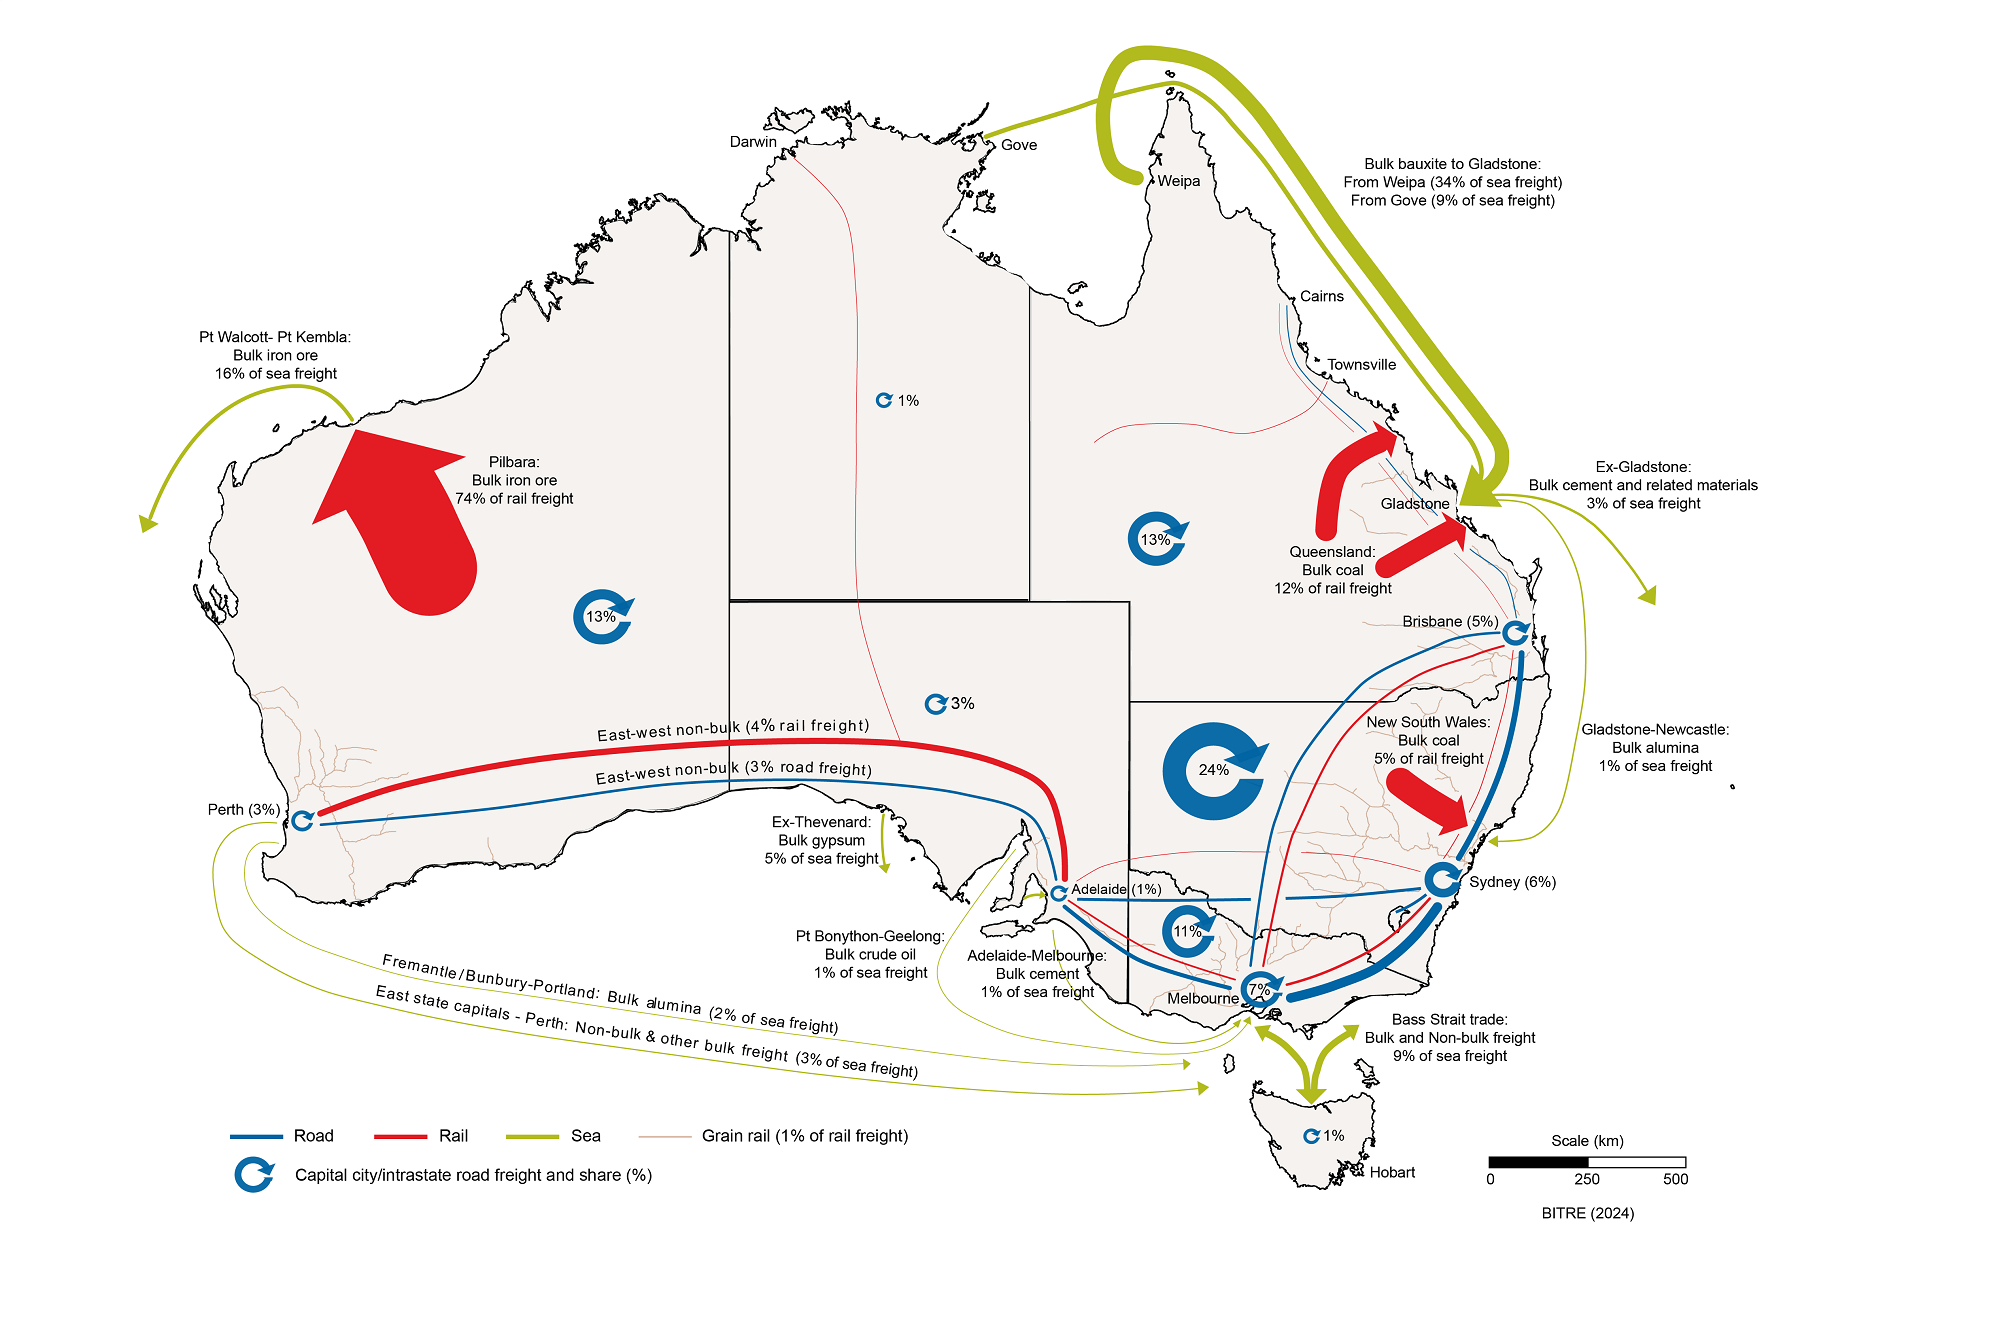
Freight transport activity (Figures 1 and 2) is measured in terms of tonne kilometres (the number of tonnes moved by a vehicle multiplied by the distance the load travelled in kilometres). The Australian domestic freight task has experienced strong growth over the last 40 years, with road and rail freight now dominating domestic freight activity.
During the COVID-19 pandemic, the total bulk and non-bulk freight task fell slightly, from 780 billion tonne kilometres in 2018–19 to 760 billion tonne kilometres in 2020–21. It has grown over the last three years and is estimated to have reached its highest point in 2024–25 at 786 billion tonne kilometres.
- Melbourne had the most metropolitan road freight estimated at 18.2 billion tonne kilometres in 2024–25.
- NSW’s estimated road freight for 2024–25 was the highest on record at 87.6 billion tonne kilometres.
Figure 1 shows a map of Australia's major domestic freight flows by transport mode (based on 2023–24 figures). Line and arrow thickness indicate the volume of freight carried on each route, not the value of freight or performance of supply chains. The map shows that the highest volume domestic freight route is iron ore transported by rail in the Pilbara region. This next largest individual flow is coal carried by rail in Central Queensland and the Hunter Valley, followed by bauxite shipped from Weipa and Gove to Gladstone.
Figure 1 Australian Freight Flows Map
Sources:
ABARES (2024), Agricultural Commodity Statistics, March 2024, ABARES, Canberra.
ABS (2002), Freight Movements, Australia, Summary, Mar 2001 (Reissue), Catalogue no. 9220.0, ABS, Canberra.
ABS (2015), Freight Movements Australia, 12 Months ended 31 October 2014, Catalogue no. 9223.0, ABS, Canberra.
BITRE (2022), Australia interstate, intrastate and capital city road freight forecasts - 2022 update, Research Report 155, BITRE, Canberra.
BITRE (2023), Australian Infrastructure and Transport Statistics Yearbook 2023, BITRE, Canberra.
BITRE (2024), BITRE estimates, BITRE, Canberra.
BITRE, Australian Sea Freight 2023–24, Statistical Report, BITRE, Canberra ACT.
DISER (2024), Resources and Energy Quarterly, December 2023, Office of the Chief Economist, Department of Industry, Science and Resources, Canberra.
DITRDCA (2024), Coastal Trading Licensing System (unpublished data), Canberra ACT.
NFDH (2024), Freight Train Movement Data from ARTC, National Freight Data Hub, Canberra.
Qld DoR (2024), Coal production data, September 2023, Queensland Department of Resources, Brisbane.
Figure 2 illustrates Australian domestic freight activity by transport mode from 1974–75 to 2024–25. The chart indicates that rail and road account for the majority of domestic freight movement. In 2024–25, rail transported approximately 447 billion tonne kilometres of freight, while road accounted for approximately 253 billion tonne kilometres.
Figure 2 Australian domestic freight task, by mode of transport
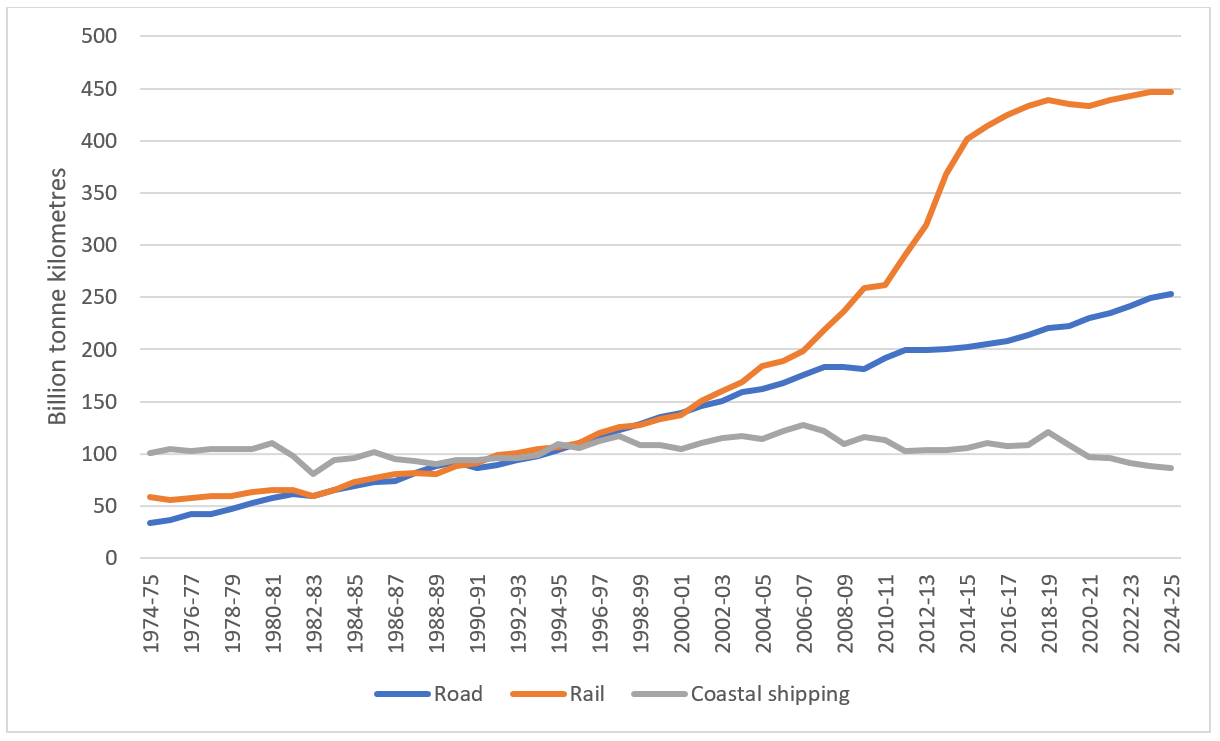
Source: BITRE Estimates