
Passengers
Chapter 2
- Passengers—Yearbook 2025 (188 KB) - Download Excel file
- Australian Infrastructure and Transport Statistics Yearbook 2025 - Download PDF
This chapter provides information on passenger transport activity, including nationally, by city pair, by capital city and by method of travel to work. The data in this chapter comes from a variety of sources, including BITRE estimates, ABS Census and Tourism Research Australia.
- 166 billion passenger kilometres were travelled by car on capital city roads in 2024-25, of a total of 280 billion passenger kilometres nationwide.
- 16 billion passenger kilometres were travelled on rail in 2024-25 compared to 18 billion in 2018-19, prior to any COVID impacts.
Passenger transport activity is measured by passenger kilometres (the number of kilometres travelled by passenger vehicles multiplied by the number of occupants in the vehicle). As shown in Figure 3, the passenger task is dominated by road transport, mainly passenger cars. Passenger travel on other modes has generally been increasing, albeit with a dip over the pandemic. Air travel fell most significantly, however by 2024-25, it had surpassed its pre-pandemic level. Prior to COVID, public transport use was growing relatively quickly, as shown in Figure 4. By 2024-25 it has returned close to its 2018-19 peak.
Figure 3 Total national motorised passenger travel, by mode
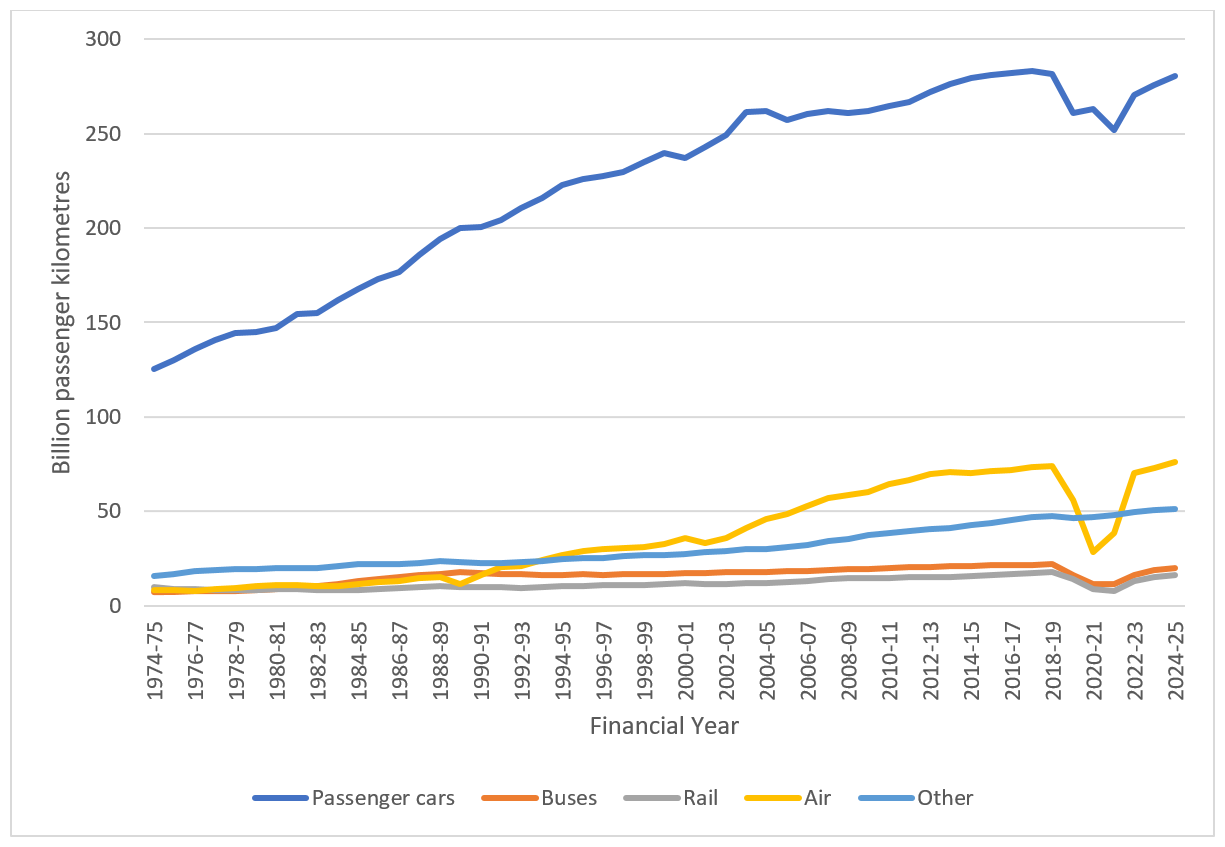
Source: BITRE Estimates
Figure 4 Australian capital city domestic passenger task, by mode
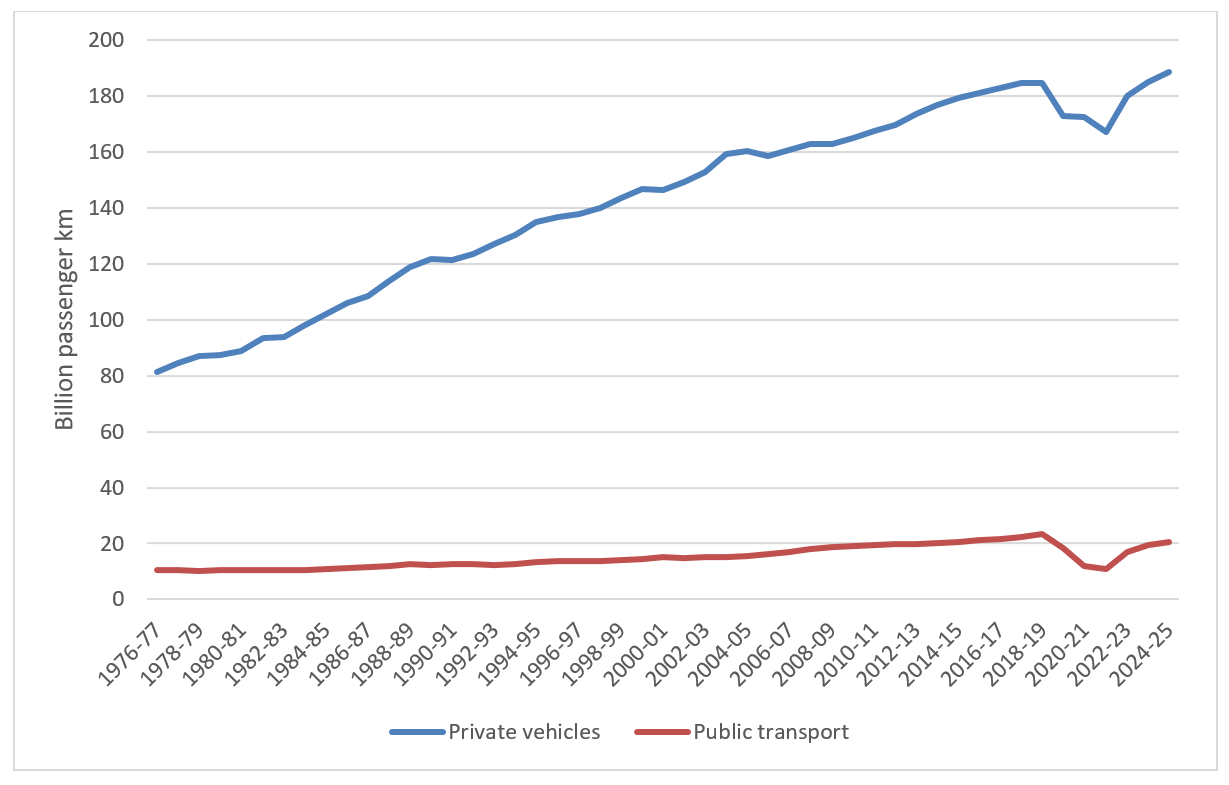
Source: BITRE Estimates