
Infrastructure Construction
Chapter 11
- Australian Infrastructure and Transport Statistics Yearbook 2025 - Download PDF
- Infrastructure Construction—Yearbook 2025 (115 KB) - Download Excel file
This chapter provides information on Australian measures of infrastructure engineering construction work done for public and private sectors. These are classified as: transport (roads, rail, harbours, etc), energy (electricity and gas transmission networks, etc), telecommunications networks, and water supply and distribution networks. Data is sourced from the Australian Bureau of Statistics, Engineering Construction Activity, Australia publication.
- Transport infrastructure engineering construction work was $52 billion (adjusted by chain volume index) in 2024-25. This accounted for 49 per cent of the value of infrastructure construction work done in Australia (including transport, energy, telecommunications and water).
- In 2024-25, the value of transport engineering construction work done was:
- $34 billion on roads and bridges
- $16 billion on railways
- $1.9 billion on harbours.
Figure 20 and Figure 21 show the change in infrastructure investment activity in Australia over time. Transport, water and energy investment increased relatively consistently until roughly 2012-13, when they each experienced a notable fall. They have recovered in recent years, however, with the Transport sector reaching its highest point of $54 billion in 2023-24 (Figure 20).
Figure 20 Infrastructure construction activity, adjusted by chain volume index
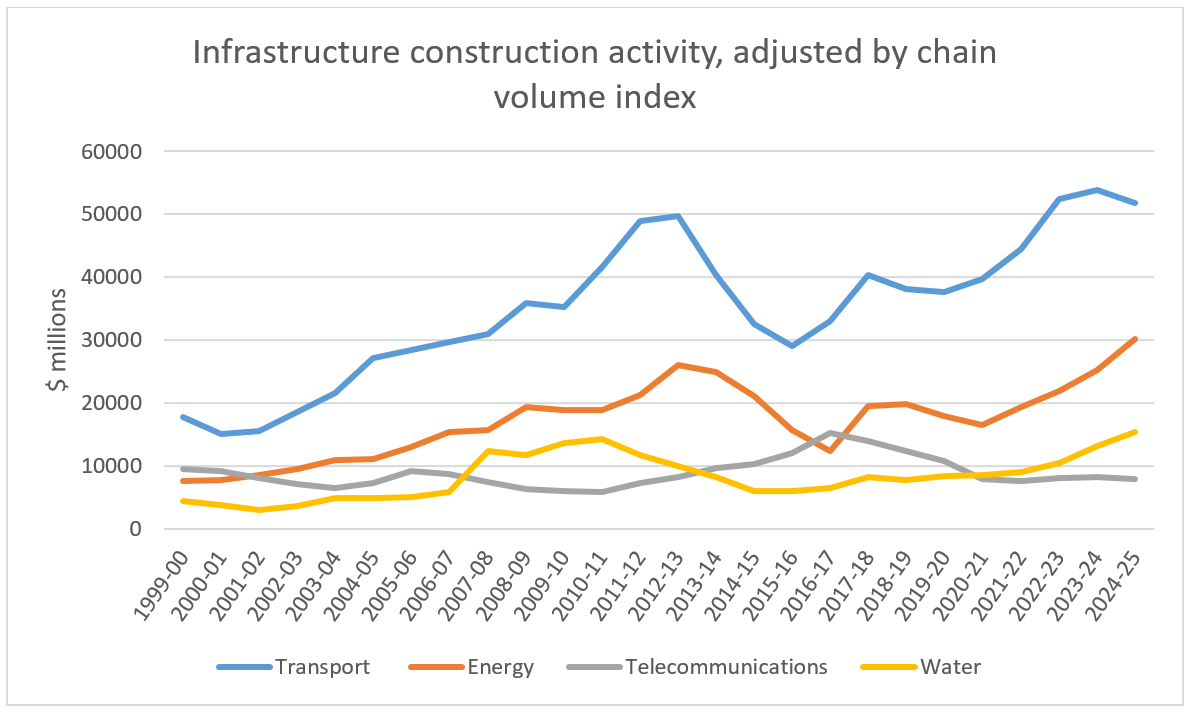
Source: ABS (2025), Engineering Construction Activity, Australia
Figure 21 shows the value of engineering Construction activity on different modes of transport. In 2024-25, both road and rail values dropped slightly after record highs in 2023-24 (at $33 billion for road and $17 billion for rail).
Figure 21 Transport construction activity, adjusted by chain volume index
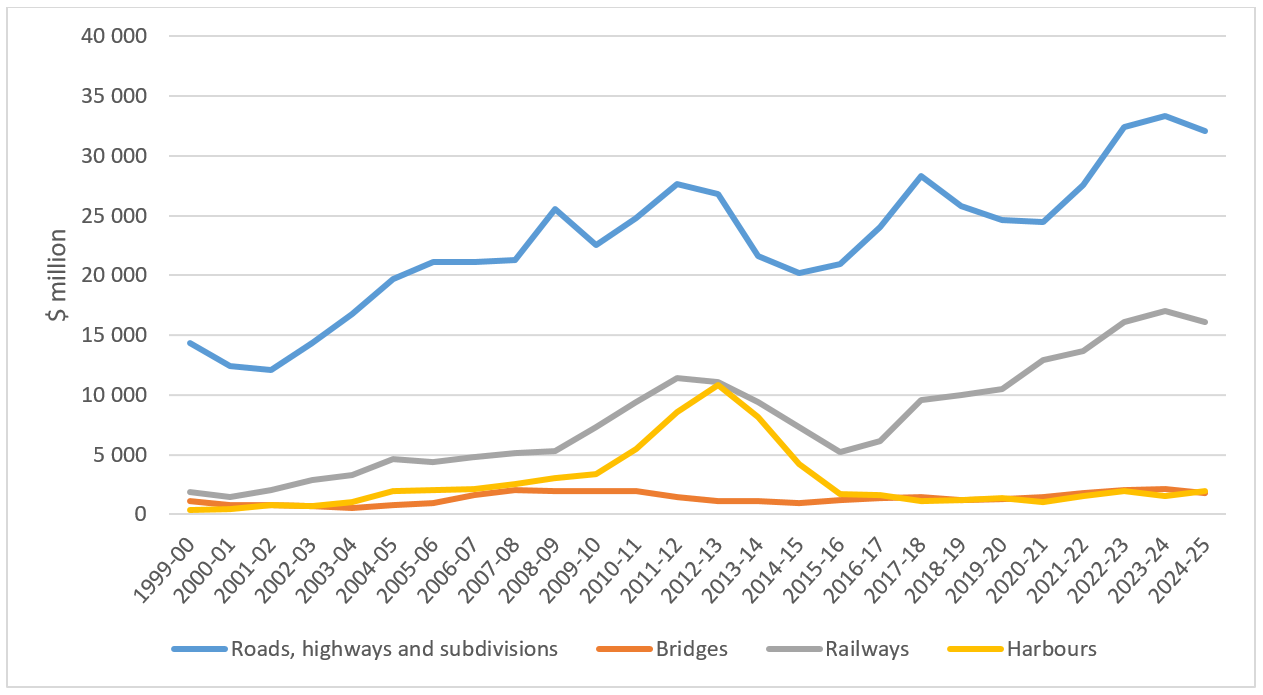
Source: ABS (2025), Engineering Construction Activity, Australia
Figure 22 illustrates the private and public sector changes in Australian infrastructure expenditure.
Figure 22 Value of infrastructure engineering construction work done, by sector, adjusted by chain volume index
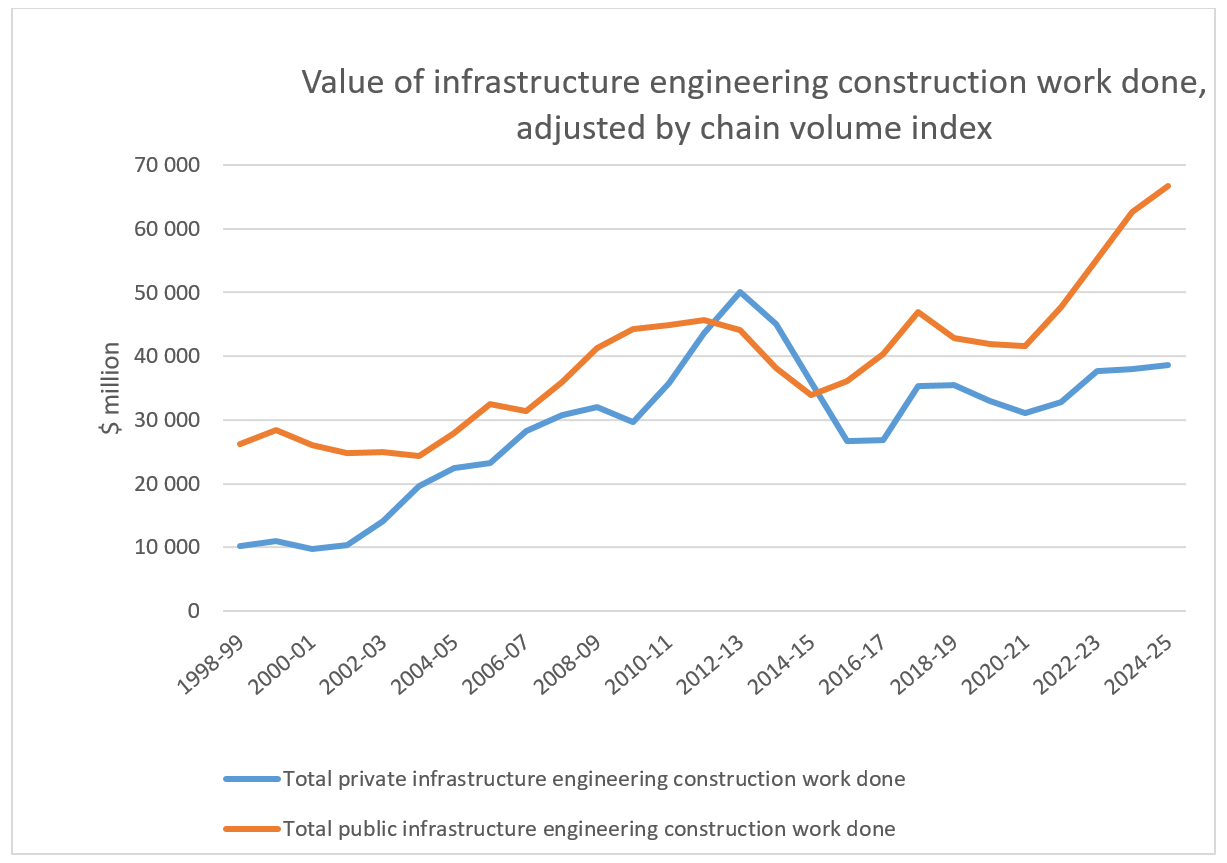
Source: ABS (2025), Engineering Construction Activity, Australia