Australian Infrastructure and Transport Statistics Yearbook 2025: freight chapter
Chapter 1: Freight
- Australian Infrastructure and Transport Statistics Yearbook 2025 - Download full report PDF
- Freight—Yearbook 2025 (128 KB) - Download Excel file
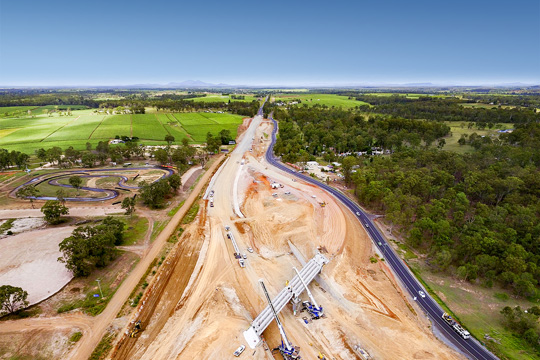
Freight transport activity (Figures 1 and 2) is measured in terms of tonne kilometres (the number of tonnes moved by a vehicle multiplied by the distance the load travelled in kilometres). The Australian domestic freight task has experienced strong growth over the last 40 years, with road and rail freight now dominating domestic freight activity.
During the COVID-19 pandemic, the total bulk and non-bulk freight task fell slightly, from 780 billion tonne kilometres in 2018–19 to 760 billion tonne kilometres in 2020–21. It has grown over the last three years and is estimated to have reached its highest point in 2024–25 at 786 billion tonne kilometres.
- Melbourne had the most metropolitan road freight estimated at 18.2 billion tonne kilometres in 2024–25.
- NSW’s estimated road freight for 2024–25 was the highest on record at 87.6 billion tonne kilometres.
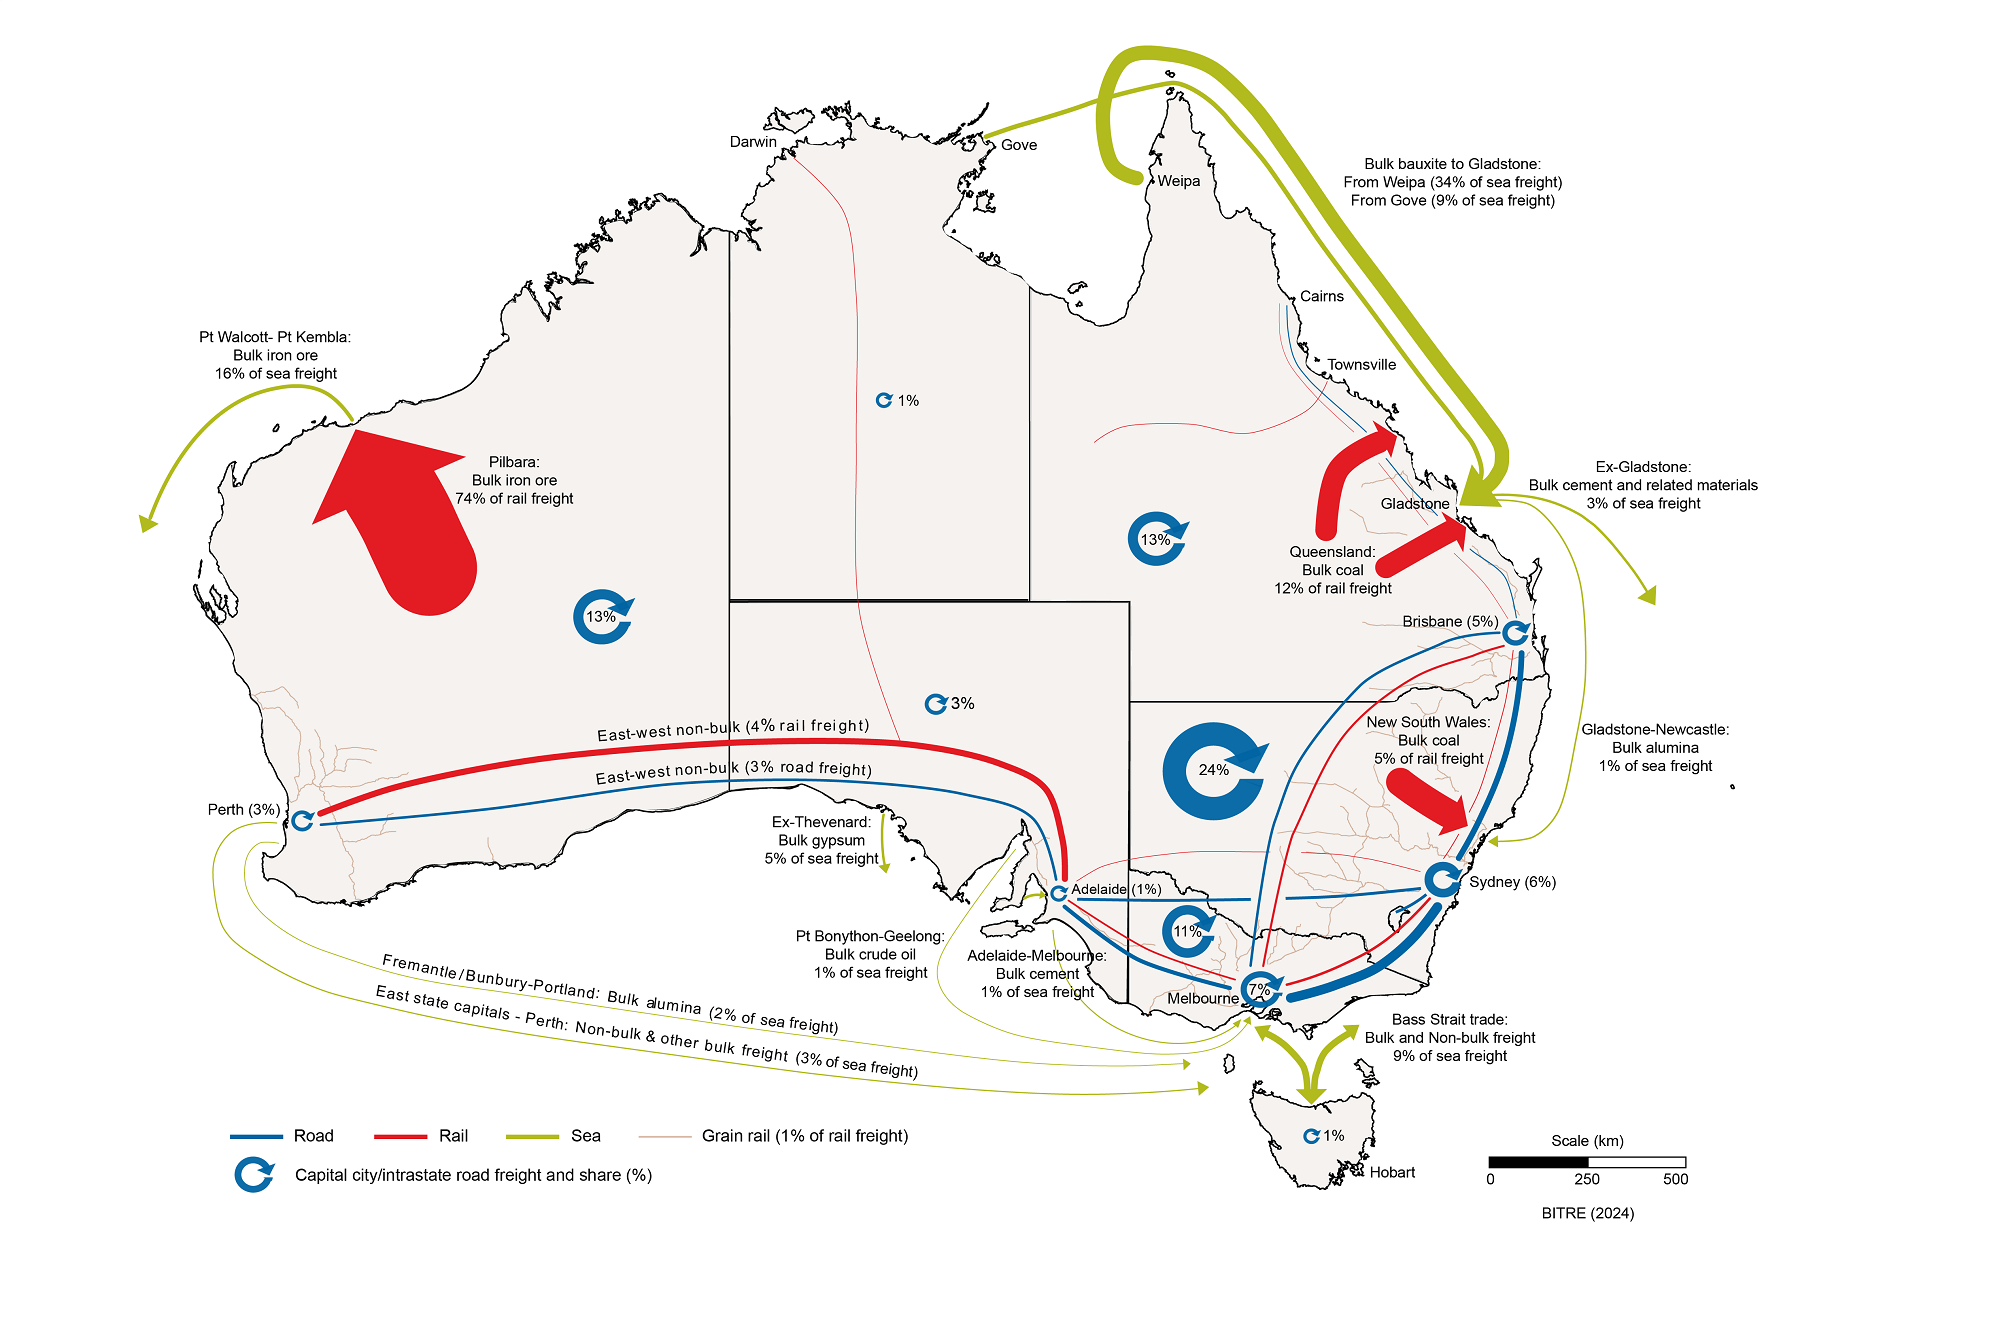
Figure 1 shows a map of Australia's major domestic freight flows by transport mode (based on 2023–24 figures). Line and arrow thickness indicate the volume of freight carried on each route, not the value of freight or performance of supply chains. The map shows that the highest volume domestic freight route is iron ore transported by rail in the Pilbara region. This next largest individual flow is coal carried by rail in Central Queensland and the Hunter Valley, followed by bauxite shipped from Weipa and Gove to Gladstone.
Figure 1 Australian Freight Flows Map
Sources:
ABARES (2024), Agricultural Commodity Statistics, March 2024, ABARES, Canberra.
ABS (2002), Freight Movements, Australia, Summary, Mar 2001 (Reissue), Catalogue no. 9220.0, ABS, Canberra.
ABS (2015), Freight Movements Australia, 12 Months ended 31 October 2014, Catalogue no. 9223.0, ABS, Canberra.
BITRE (2022), Australia interstate, intrastate and capital city road freight forecasts - 2022 update, Research Report 155, BITRE, Canberra.
BITRE (2023), Australian Infrastructure and Transport Statistics Yearbook 2023, BITRE, Canberra.
BITRE (2024), BITRE estimates, BITRE, Canberra.
BITRE, Australian Sea Freight 2023–24, Statistical Report, BITRE, Canberra ACT.
DISER (2024), Resources and Energy Quarterly, December 2023, Office of the Chief Economist, Department of Industry, Science and Resources, Canberra.
DITRDCA (2024), Coastal Trading Licensing System (unpublished data), Canberra ACT.
NFDH (2024), Freight Train Movement Data from ARTC, National Freight Data Hub, Canberra.
Qld DoR (2024), Coal production data, September 2023, Queensland Department of Resources, Brisbane.
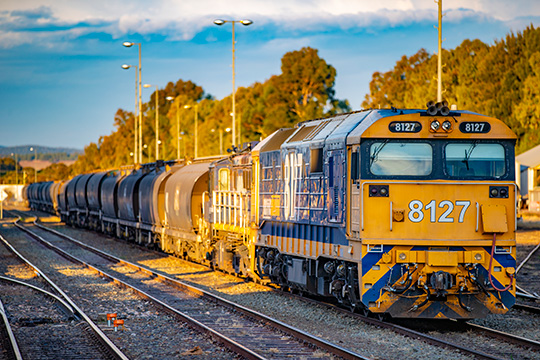
Figure 2 illustrates Australian domestic freight activity by transport mode from 1974–75 to 2024–25. The chart indicates that rail and road account for the majority of domestic freight movement. In 2024–25, rail transported approximately 447 billion tonne kilometres of freight, while road accounted for approximately 253 billion tonne kilometres.
Figure 2 Australian domestic freight task, by mode of transport
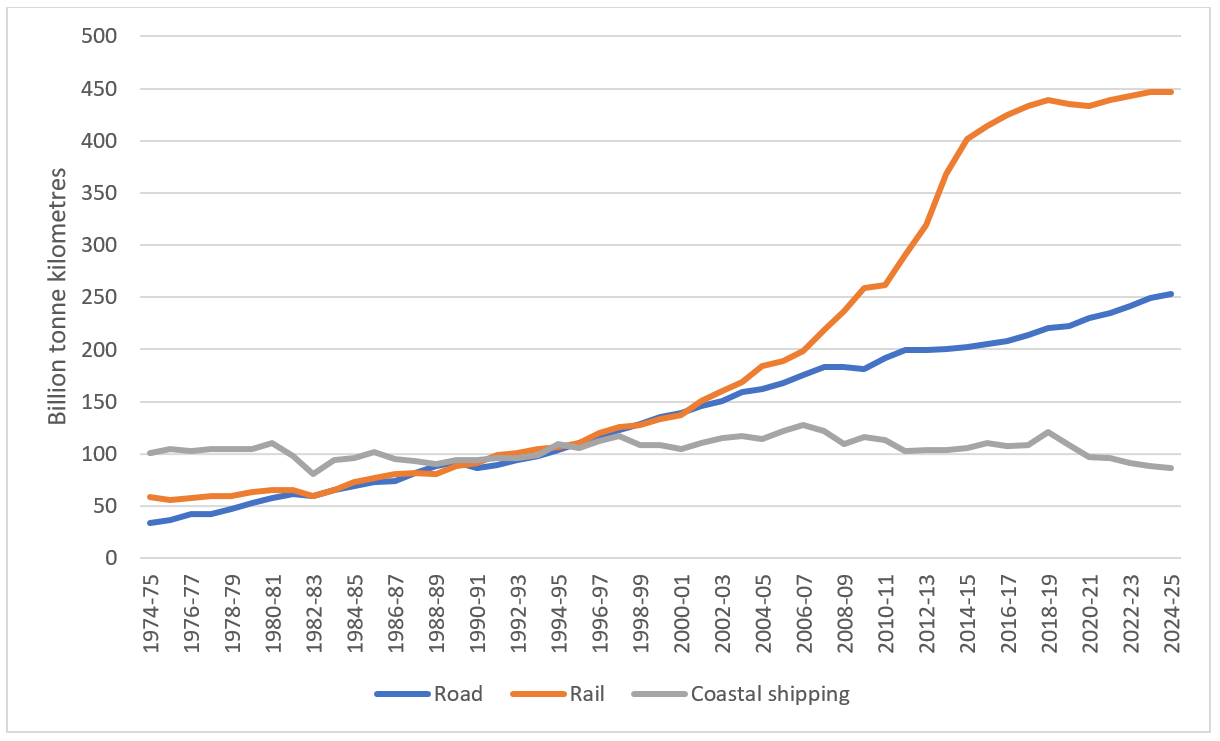
Source: BITRE Estimates
Australian Infrastructure and Transport Statistics Yearbook 2025: shipping chapter
Chapter 7: Shipping
- Australian Infrastructure and Transport Statistics Yearbook 2025 - Download PDF
- Shipping—Yearbook 2025 (124 KB) - Download Excel file
This chapter provides information on Australian ships, cargo, ports and fleet, including mileage, tonnage and number of vessels. The data is sourced from BITRE’s Australian Sea Freight publication, BITRE’s Waterline publication and BITRE estimates based on Lloyd's List Intelligence data.
- 9.1 million TEUs (twenty-foot equivalent units) were exchanged at container terminals in Brisbane, Sydney, Melbourne, Fremantle, and Adelaide in 2024–25.
- 32,142 port calls were made to Australian ports in 2024–25. The states with the highest number were Western Australia with 9,580 and Queensland with 8,244.
- 5,841 different cargo vessels visited Australian ports in 2024–25.
- There were 53 Australian registered vessels in the Australian trading fleet, including small vessels, and 83 overseas registered vessels in 2022–23.
Figure 14 Principal Australian ports, by commodity
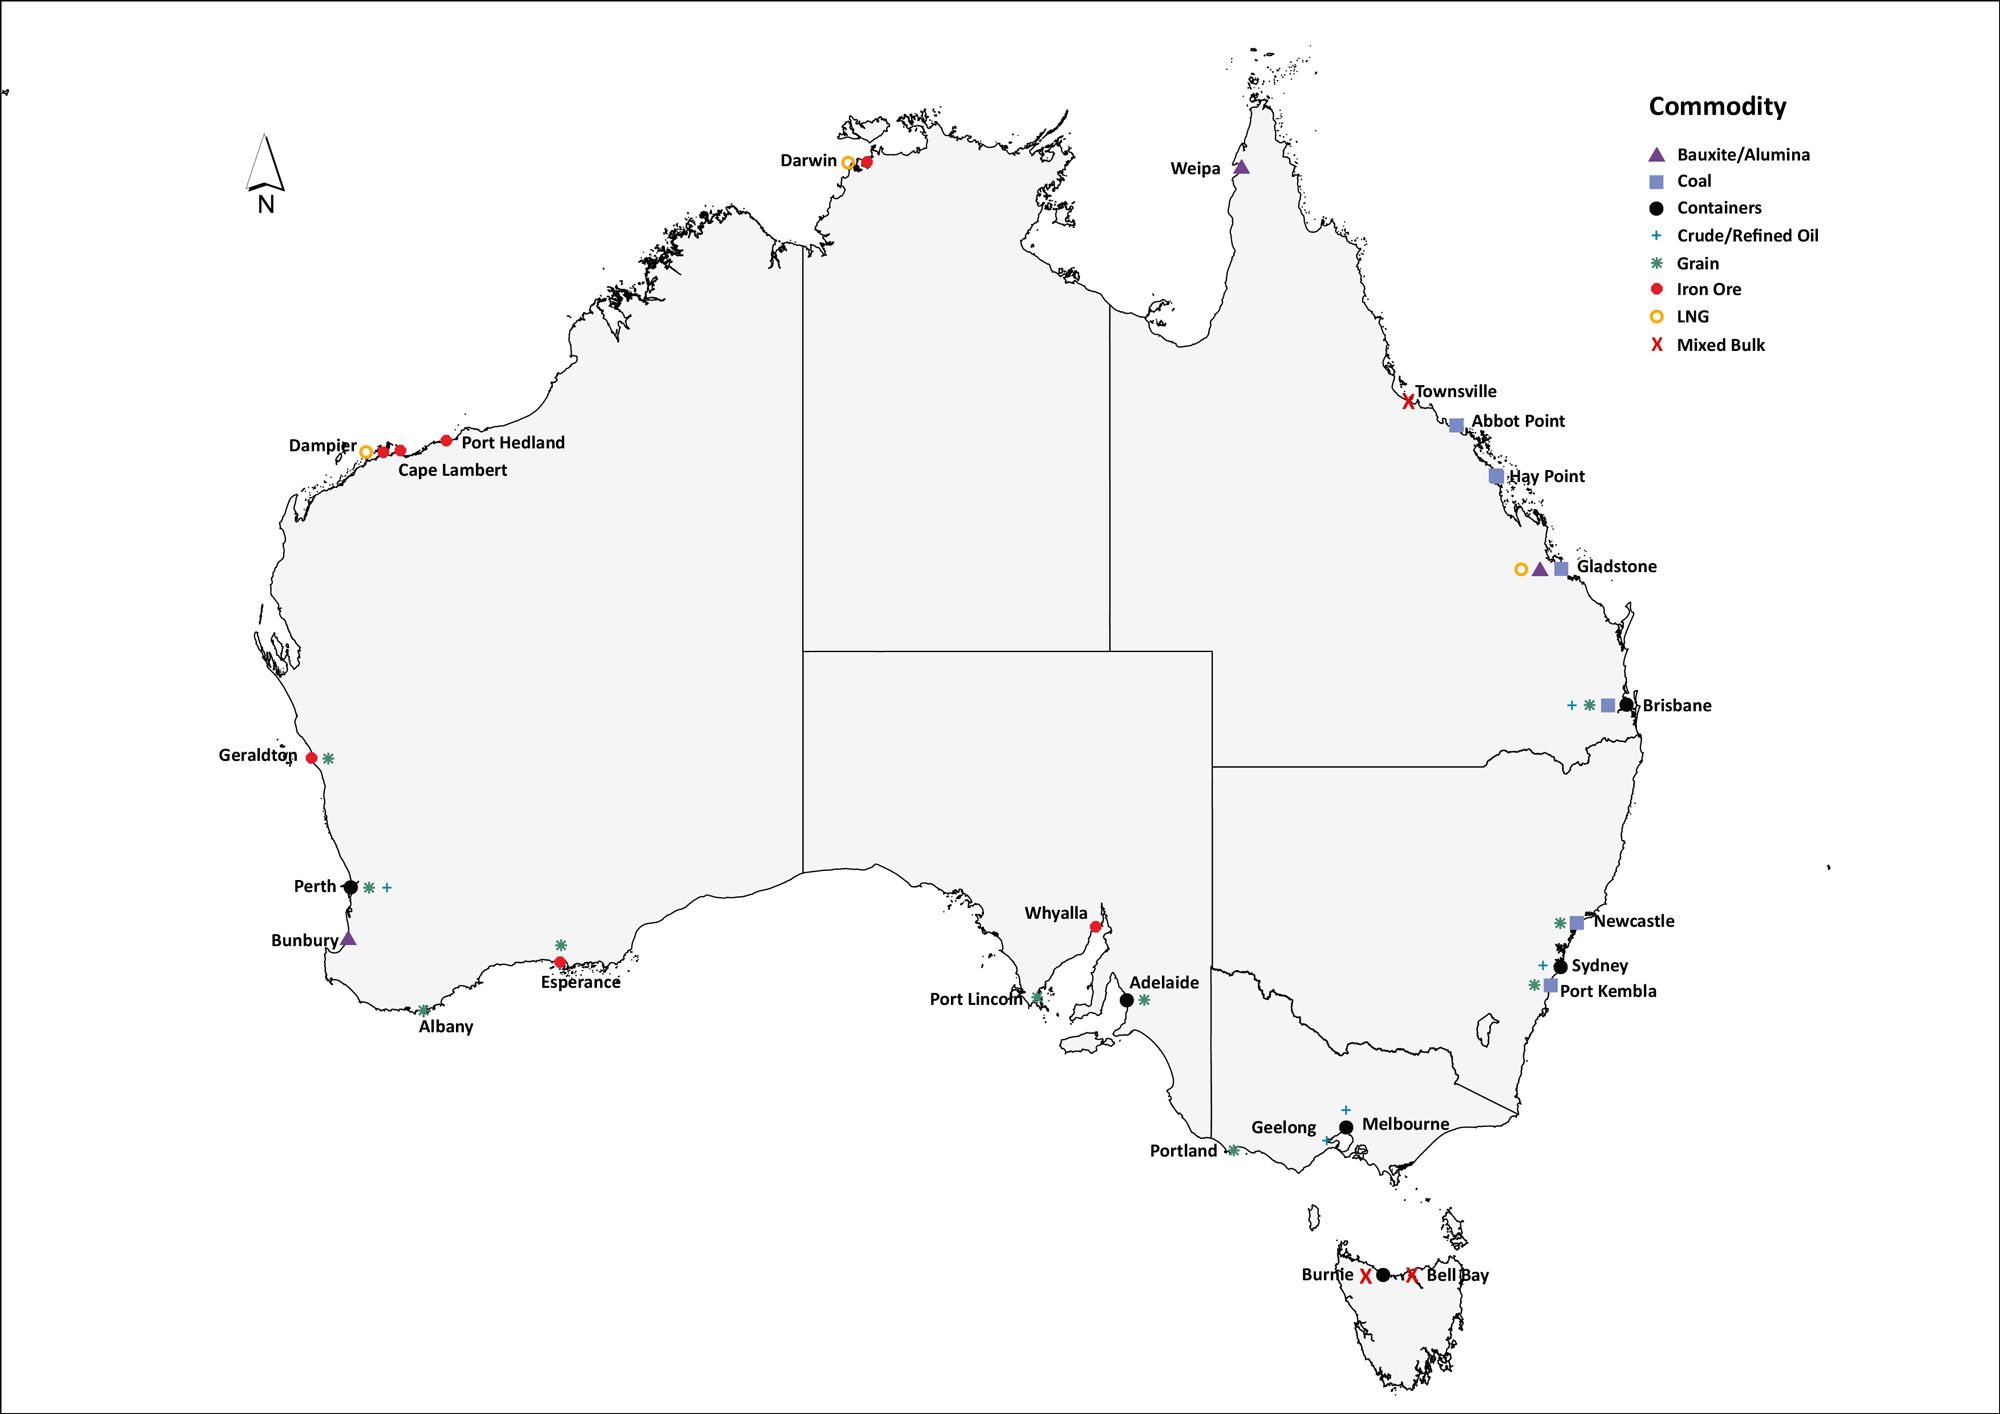
Figure 15 shows the number of port calls by state from 1999-00 to 2024-25. Queensland and Western Australia saw the largest increases and were consistently Australia’s two most visited states by cargo ships.
Figure 15 Number of port calls by state/territory
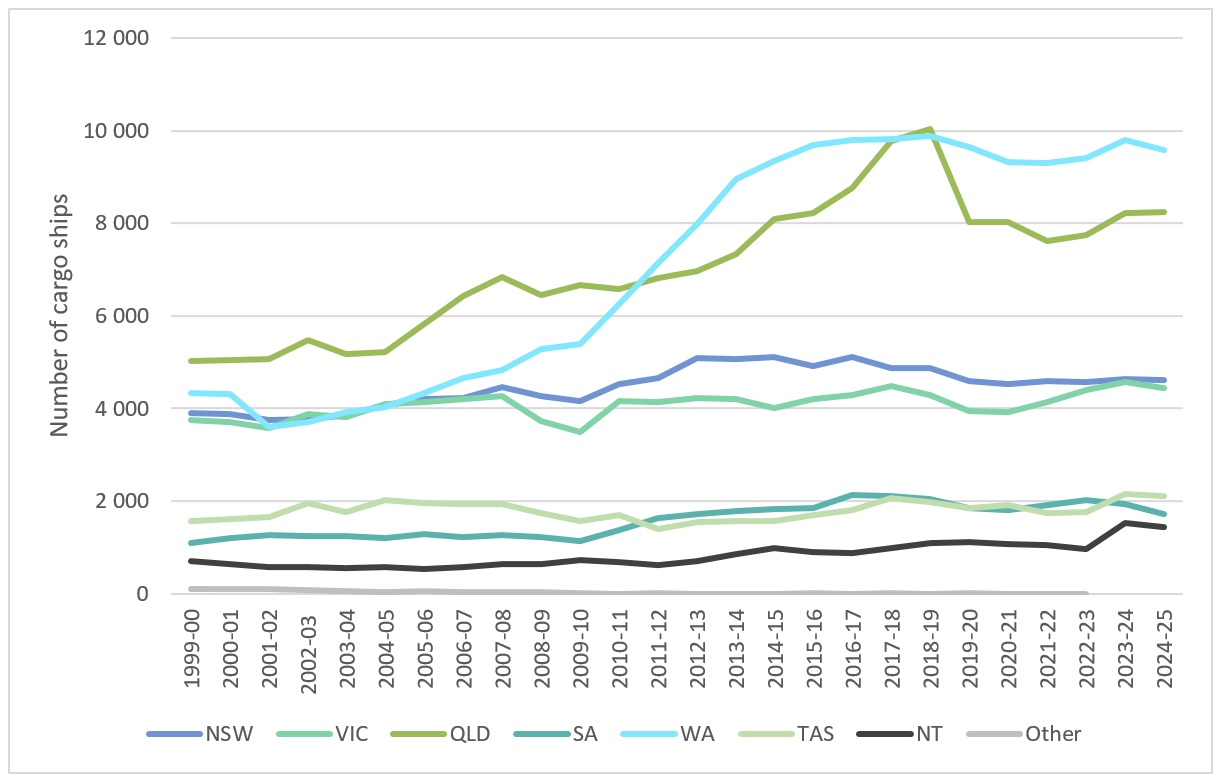
Note: “Other” includes state/territory not clearly specified in the source data.
Data may change slightly from year to year due to revisions to historical data. Ships that have made only port calls in the financial year where the target port equals the previous recorded port are excluded.
Source: BITRE estimates based on Lloyd’s List Intelligence data
Australian Infrastructure and Transport Statistics—Yearbook 2025
The aim of the Australian Infrastructure Statistics and Transport Yearbook is to provide a single, comprehensive annual source of infrastructure statistics for use by policymakers, industry, transport analysts and the wider Australian community. You can download the PDF or data files:
- Australian Infrastructure and Transport Statistics—Yearbook 2025 (PDF 9.3 MB)
- Australian Infrastructure and Transport Statistics—Yearbook 2025 data (ZIP: 1.4 MB)
For a summary of each chapter select from the list below:
Freight
Passengers

Road-related Revenue and Expenditure
Road
Rail
Aviation
Shipping
Transport Safety
Transport Energy and Environment
Infrastructure and the Economy
Infrastructure Construction
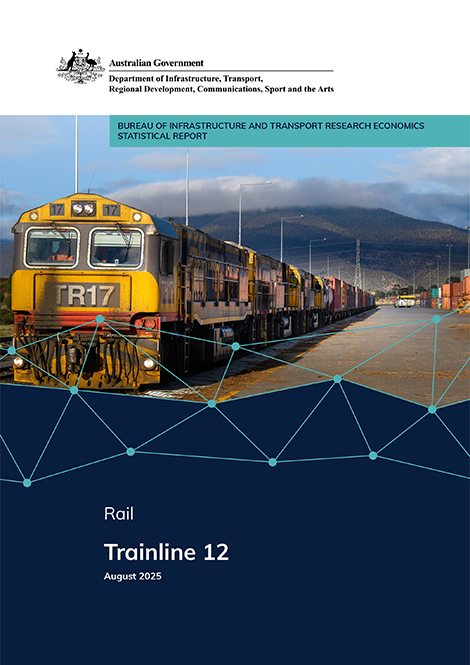
This compendium provides insights, analysis, and an understanding of the railway industry. Australia's railways are evolving, with changes both outside and within the industry. These changes include logistics, commodity flows, technology, urban patronage, and regional passenger services. The publication presents an overview and data on railway transport tasks performed; characteristics of the railways and train operators' rolling stock that runs; and aspects of railway performance, including safety, environment and reliability.
Trainline 12 gives an overview of freight, urban and non-urban passenger rail. The report analyses traffic levels, the provision of infrastructure and rolling stock, and railway performance. It is the twelfth in the publication series.
Australian Sea Freight 2023–24
This is the latest in a series of BITRE reports that provide information on Australian sea freight movements, vessel activity, the use of coastal trading licences, and the size and composition of the Australian trading fleet.
The latest import and export data has been made available in machine readable form on the National Freight Data catalogue.
Tasmanian Freight Equalisation Scheme Monitoring Report 2024
The Tasmanian Freight Equalisation Scheme (TFES) provides financial assistance for costs incurred by shippers of eligible non-bulk goods moved by sea across Bass Strait. This report is BITRE's second 4-yearly monitoring review of all components of the TFES. The focus is the volume and value of eligible claims for goods shipped between Tasmania and the mainland in the 4 years from 2019–20 to 2022–23.
Australian Infrastructure and Transport Statistics—Yearbook 2024
The aim of the Australian Infrastructure Statistics and Transport Yearbook is to provide a single, comprehensive annual source of infrastructure statistics for use by policymakers, industry, transport analysts and the wider Australian community. You can download the PDF or data files:
- Australian Infrastructure and Transport Statistics—Yearbook 2024 (PDF 9.2 MB)
- Australian Infrastructure and Transport Statistics—Yearbook 2024 data (ZIP: 2 MB)
For a summary of each chapter select from the list below:
Infrastructure and the Economy
Infrastructure Construction
Road-related Revenue and Expenditure
Freight
Passengers
Road
Rail
Aviation
Shipping
Transport Safety
Transport Energy and Environment
Waterline reports on trends in throughput, container handling productivity on the waterfront and landside of ports in Australia and the cost of importing and exporting containers via 5 major container ports. It covers the loading and unloading of container ships and the transport of containers from container terminals.
This issue covers port terminal activity up to the June quarter 2023.
Consultation Draft Tasmanian Freight Equalisation Scheme Monitoring Report 2024
Consultation Draft Tasmanian Freight Equalisation Scheme Monitoring Report 2024.
Trainline is a compendium of Australia's railways, providing insights, analysis and an understanding of the railway industry. Australia's railways are evolving, with changes within and outside the industry. These changes include logistics, commodity flows, technology, urban patronage and regional passenger services. The publication presents an overview and data on railway transport tasks performed; characteristics of the railways and train operators' rolling stock that runs; and aspects of railway performance including safety, environment and reliability.
Trainline 11 gives an overview of freight, urban and non-urban passenger rail. The report analyses traffic levels, the provision of infrastructure and rolling stock, and railway performance. It is the eleventh in the publication series.