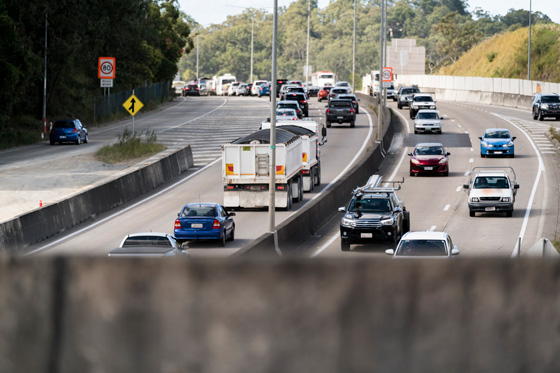
Freight vehicle congestion in Australian capital cities – 2023
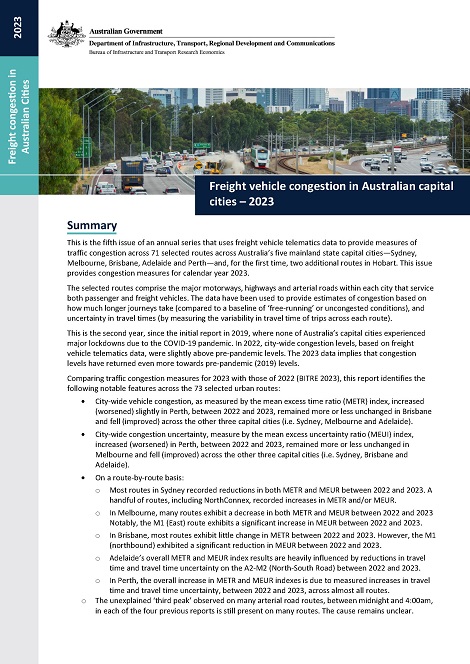
This publication is the fifth in an annual series that uses vehicle telematics data to provide measures of traffic congestion for freight vehicles on selected routes across Australia’s five mainland state capital cities – Sydney, Melbourne, Brisbane, Adelaide and Perth – and, for the first time, two additional routes in Hobart. The selected routes comprise the major motorways, highways and arterial roads within each city that service both passenger and freight vehicles. This release includes congestion measures for 73 separate routes. The estimates presented in this report cover calendar year 2023.
This is the second year, since the initial report in 2019, where none of Australia’s capital cities experienced major lockdowns as part of the COVID-19 pandemic, and city-wide congestion levels have more or less returned to pre-pandemic levels. City-wide freight vehicle congestion, as measured by the mean excess travel time index, increased (worsened) slightly in Perth, remained more or less unchanged in Brisbane, and declined (improved) in the Sydney, Melbourne and Adelaide between 2022 and 2023. Copies of the summary measure data displayed in the report are also available here.
Australian aviation forecasts – 2024 to 2050
Aviation plays a key role in Australia’s transport system, providing regular scheduled services between Australia's highly dispersed major population centres and vital connectivity for rural and remote communities. As a large island nation, located significant distances from our nearest neighbours, aviation is also the primary means of access for international visitors and for domestic residents travelling overseas.
This report presents long-term forecasts of Australian commercial air passenger and freight activity, and forecasts of air passenger numbers through Australia’s 14 busiest airports / air catchments – i.e. Australia’s eight capital cities and six busiest non-capital city airports – and air freight volumes through Australia’s mainland state capital city airports. The forecasts are based on econometric models of Australian domestic and international air passenger and air freight demand, and the most recent long-term economic outlooks for Australia and developed and major developing countries. The forecasts are intended to help inform long-term Australian aviation policy development and planning.
Australian Infrastructure and Transport Statistics - Yearbook 2023
The aim of the Australian Infrastructure Statistics and Transport Yearbook is to provide a single, comprehensive annual source of infrastructure statistics for use by policymakers, industry leaders, transport analysts and the wider Australian community. Download the PDF or select a chapter below. Data files for each chapter are at the bottom of the page.
Australian Infrastructure and Transport Statistics—Yearbook 2023 - PDF (7.23 MB)
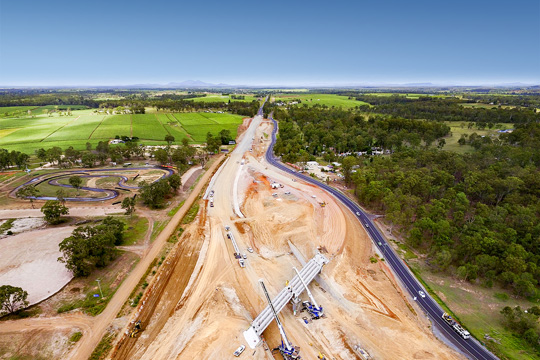
Infrastructure and the Economy
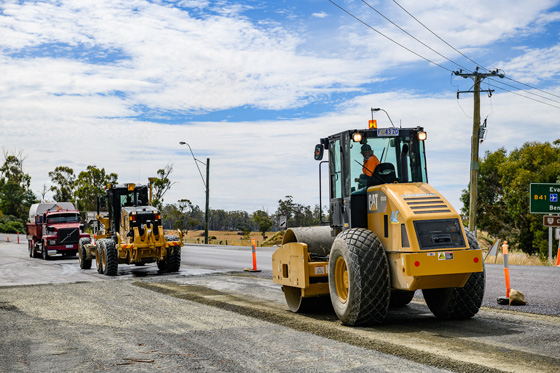
Infrastructure Construction
Road-related Revenue and Expenditure
Freight
Passengers

Road
Rail
Aviation

Shipping
Transport Safety

Transport Energy and Environment

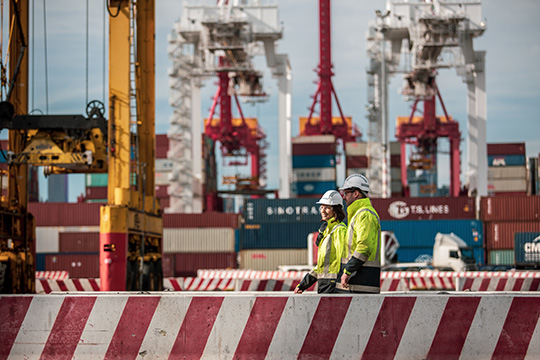
Waterline reports on trends in (a) throughput, (b) container handling productivity on the waterfront and the land side of ports in Australia, and (c) the cost of importing and exporting containers via five container ports. It covers both the loading and unloading of container ships and the transport of containers from container terminals.
This issue covers port terminal activity up to the June quarter 2022.
Road Vehicles, Australia, January 2023 (Re-issue)
This release provides statistics relating to the number of vehicles registered for road use in Australia on 31st January 2023. The statistics encompass all vehicles that were registered with an Australian state or territory motor vehicle registry for unrestricted use on public roads, and reported by jurisdictions to the National Exchange of Vehicle and Driver Information System (NEVDIS). This is the second annual release of Road Vehicles Australia, which replaces the ABS Motor Vehicle Census, discontinued in 2021. More statistics are available on the BITRE website and data.gov.au.
Trainline is a compendium of Australia's railways that provides insights, analysis and an understanding of the railway industry. Australia's railways are evolving, with changes within and outside the industry. These changes include logistics, commodity flows, technology, urban patronage, and regional passenger services. The publication presents an overview and data on railway transport tasks performed; characteristics of the railways and train operators' rolling stock that runs; and aspects of railway performance, including safety, environment and reliability.
Freight vehicle congestion in Australia's five major cities – 2022
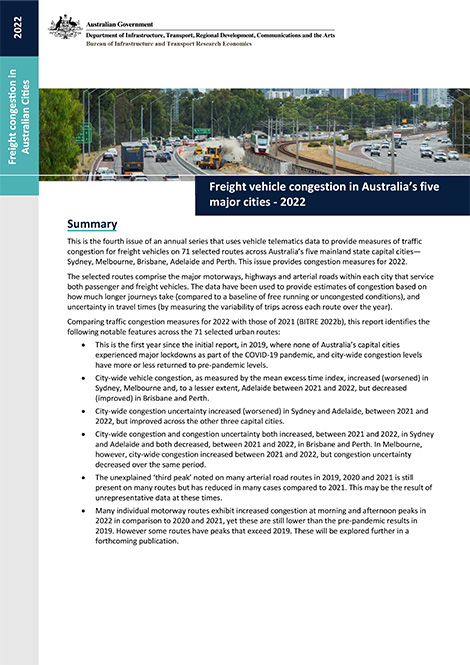
This publication is the fourth in an annual series that uses vehicle telematics data to provide measures of traffic congestion for freight vehicles for selected routes across Australia’s five mainland state capital cities—Sydney, Melbourne, Brisbane, Adelaide and Perth. The selected routes comprise the major motorways, highways and arterial roads within each city that service both passenger and freight vehicles. This release includes measures for 71 routes. The estimates presented in this report cover calendar year 2022, and include comparisons with 2021 traffic congestion levels.
This is the first year since the initial report, in 2019, where none of Australia’s capital cities experienced major lockdowns as part of the COVID-19 pandemic, and city-wide congestion levels have more or less returned to pre-pandemic levels. In particular, city-wide vehicle congestion, as measured by the mean excess time index, increased (worsened) in Sydney, Melbourne and, to a lesser extent, Adelaide between 2021 and 2022, but decreased (improved) in Brisbane and Perth. Many individual motorway routes exhibit increased congestion at morning and afternoon peaks in 2022, compared to 2020 and 2021. On some routes measured congestion is still lower than the pre-pandemic results in 2019. On other routes, congestion peaks exceed 2019 levels. Copies of the data displayed in the report are available here and on data.gov.au.
Australian Sea Freight 2020-21
This is the latest in a series of Bureau of Infrastructure and Transport Research Economics (BITRE) reports that provide information on Australian sea freight movements, vessel activity, the use of coastal trading licences, and the size and composition of the Australian trading fleet. This report contains statistics on maritime freight and shipping activities in Australia from 2011–12 to 2020–21.
The latest import and export data has been made available through a visualisation on the National Freight Data Hub website.
Australian Infrastructure and Transport Statistics - Yearbook 2022
The aim of the Australian Infrastructure Statistics and Transport Yearbook is to provide a single, comprehensive annual source of infrastructure statistics for use by policymakers, industry leaders, transport analysts and the wider Australian community.
The publication is primarily a source of long-term, aggregate time series infrastructure statistics. Most statistics included in the publication are currently collected by BITRE or other Australian, state or territory government agencies.
Australian aggregate freight forecasts – 2022 update
Freight transport plays a significant and wide-ranging role across Australia’s economy. It includes the movement of Australia’s major bulk export commodities to ports for export, the transport of raw materials and semi-processed commodities to businesses for further processing and finished products to household consumers.
This report presents long-term forecasts of total Australian freight volumes for road, rail, coastal shipping and aviation between 2020 and 2050. The forecasts are based on a combination of statistical models relating to historical trends in freight volumes and economic activity and on informed assumptions about likely future long-term economic and demographic trends and international assumptions about likely future world demand for key Australian export commodities. This report updates BITRE 2019 aggregate freight forecasts.