Bass Strait Passenger Vehicle Equalisation Scheme Monitoring Report No. 20
The Australian Government spent $58.3 million under the Scheme in 2023–24 and $53.9 million in 2024–25
Chapter 5
- Australian Infrastructure and Transport Statistics—Yearbook 2024 - Download PDF
- Passengers—Yearbook 2024 (195 KB) - Download Excel file
This chapter provides information on passenger transport activity, including nationally, by city pair, by capital city and by method of travel to work. The data in this chapter comes from a variety of sources, being from BITRE's estimates, the ABS' Census Basic Community Profiles Series and from Tourism Research Australia.
- 163 billion passenger kilometres were travelled by car on capital city roads in 2023–24, returning to pre COVID pandemic levels of 2018–19.
- 15 billion passenger kilometres were travelled on heavy rail networks in 2023–24.
- 18 billion passenger kilometres were travelled on heavy rail in 2018–19, prior to any COVID impacts.
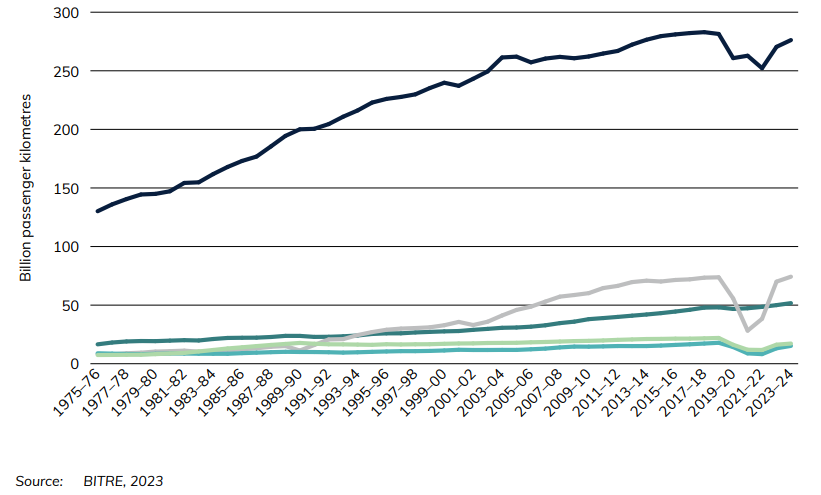
Passenger transport activity (Figure 11) is measured by passenger kilometres (the number of kilometres travelled by passenger vehicles multiplied by the number of occupants in the vehicle).
Figure 11 Total national motorised passenger travel, by transport mode
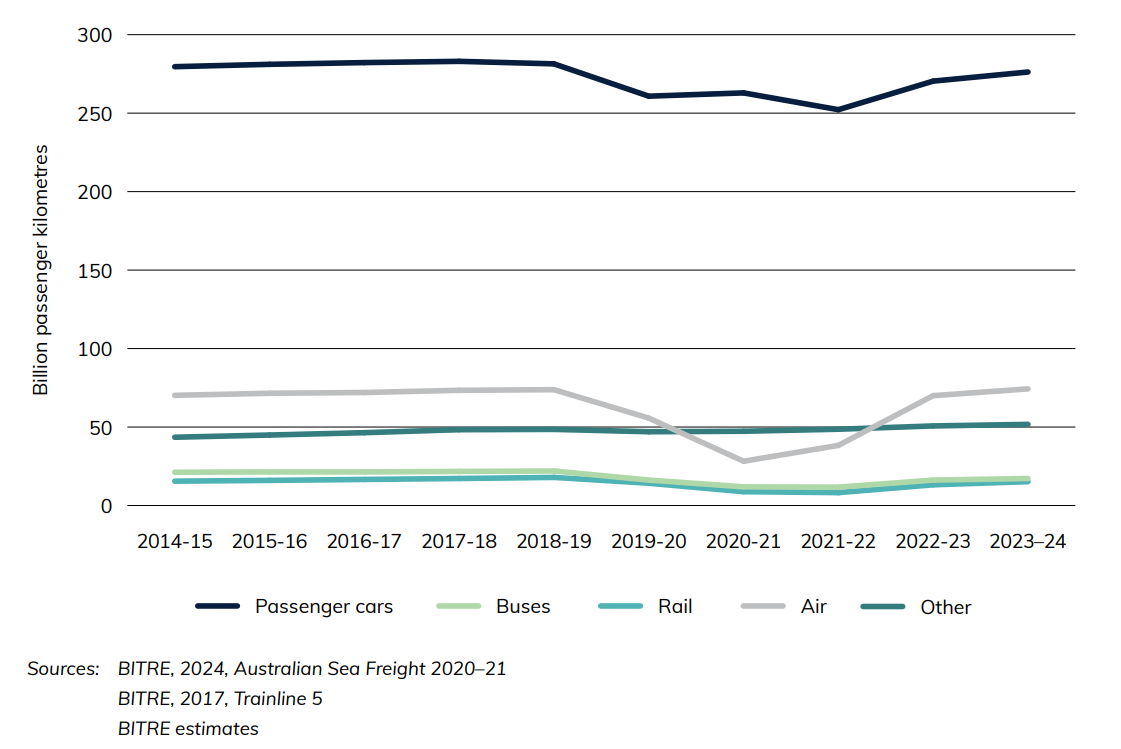
The Australian domestic passenger task is dominated by road transport, mainly passenger cars (Figure 12, right axis). Passenger travel on other modes has generally been increasing, albeit with a dip over the pandemic period. Air travel expectedly fell most significantly, however in 2023–24 it had recovered to near its pre-pandemic level.
Figure 12 Australian domestic passenger task, by mode of transport
Bass Strait Passenger Vehicle Equalisation Scheme Monitoring Report No. 19
The Australian Government spent $101.0 million on the Bass Strait Passenger Vehicle Equalisation Scheme in the 2 years to June 2023 ($41.8 million in 2021–22 and $59.2 million in 2022–23).
Road Vehicles, Australia, January 2023 (Re-issue)
This release provides statistics relating to the number of vehicles registered for road use in Australia on 31st January 2023. The statistics encompass all vehicles that were registered with an Australian state or territory motor vehicle registry for unrestricted use on public roads, and reported by jurisdictions to the National Exchange of Vehicle and Driver Information System (NEVDIS). This is the second annual release of Road Vehicles Australia, which replaces the ABS Motor Vehicle Census, discontinued in 2021. More statistics are available on the BITRE website and data.gov.au.
Road Vehicles, Australia, January 2022 (re-issue)

This release provides statistics relating to the number of vehicles registered for road use in Australia on 31st January 2022. The statistics encompass all vehicles that were registered with an Australian state or territory motor vehicle registry for unrestricted use on public roads, and reported by jurisdictions to the National Exchange of Vehicle and Driver Information System (NEVDIS). This is the first annual release of Road Vehicles Australia, which replaces the ABS Motor Vehicle Census, discontinued in 2021. More statistics are available on the BITRE website and data.gov.au.
Bass Strait Passenger Vehicle Equalisation Scheme Monitoring Report No. 18
The Australian Government spent $77.7 million on the Bass Strait Passenger Vehicle Equalisation Scheme in the 2 years to June 2021 ($40.8 million in 2019–20 and $36.9 million in 2020–21).
Under the scheme passengers travelling with a vehicle across Bass Strait can receive a rebate applied against the vehicle fare charged by a ferry operator.
Australia’s light vehicle fleet - some insights
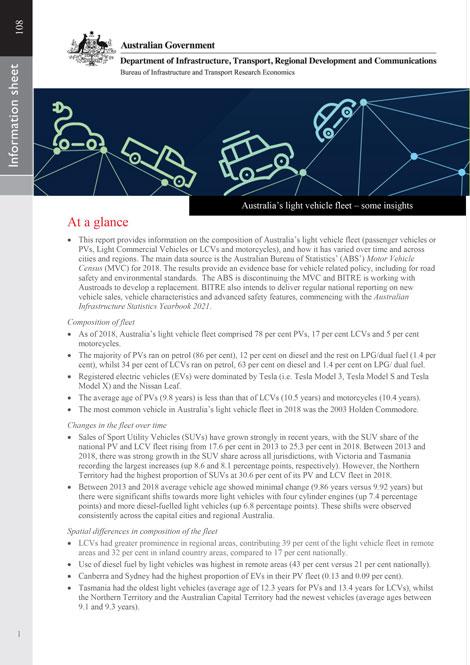
This Information Sheet investigates how the characteristics of Australia’s light vehicle fleet vary across different types of regions, including States/Territories, major cities, city sectors, region types, and small areas. Vehicle characteristics considered include fuel type, average age, cylinders and tare weight. Specific types of vehicles, such as electric vehicles, sports utility vehicles and utilities are also examined. The study also identifies recent changes in the composition of Australia’s light vehicle fleet.
Bass Strait Passenger Vehicle Equalisation Scheme Monitoring Report No. 17
The Australian Government spent $104.1 million in the 2 years to 2018–19 ($51.3 million in 2018–19, and $52.8 million in 2017–18) on the Bass Strait Passenger Vehicle Equalisation Scheme (the Scheme).
Under the Scheme passengers travelling with a vehicle across Bass Strait can receive a rebate applied against the vehicle fare charged by a ferry operator.
Over the two-year monitoring period BITRE estimates that:
- The number of sea passengers with a motor vehicle may have been 29.2% higher than without the Scheme.
- Just under 26 000 additional visitors to Tasmania travelled by sea due to the Scheme in 2018–19 (28 600 new visitors in 2017–18).
These additional visitors to Tasmania spent an estimated $80.6 million in 2018–19 ($88.7 million in 2017–18).
Bass Strait Passenger Vehicle Equalisation Scheme Monitoring Report No. 16
The Australian Government spent $44.7 million in 2016–17 on the Bass Strait Passenger Vehicle Equalisation Scheme (the Scheme), and $44.1 million in 2015–16.
Under the Scheme passengers travelling with a vehicle across Bass Strait can receive a rebate applied against the vehicle fare charged by a ferry operator.
Over the two-year monitoring period we estimate that:
- The number of sea passengers with a motor vehicle may have been 29.0% higher than without the Scheme.
- Just under 26 450 additional visitors to Tasmania travelled by sea due to the Scheme in 2016–17 (27 650 new visitors in 2015–16).
These additional visitors to Tasmania spent an estimated $71.4 million in 2016–17 ($74.6 million in 2015–16).
Measuring infrastructure asset performance and customer satisfaction: A review of existing frameworks
Well-managed, modern and functioning infrastructure underpins much of the economic prosperity of Australia. It is thus crucial that Australia's infrastructure keeps up with the needs of the community.
While some infrastructure asset types, namely public roads and airports, have made significant progress in performance measurement, for others there is a dearth of information or public engagement. The patchwork approach that has resulted means that Australia may be missing out on the potential benefits of consistent and widespread performance measurement: improved accountability, incentivised performance, and better performance evaluation. This report introduces and explores many of the issues surrounding infrastructure performance measurement that should be considered in the context of providing greater consistency across infrastructure asset types.
- Measuring infrastructure asset performance and customer satisfaction: A review of existing frameworks