This information sheet provides an overview of the current status of motorcycling safety in Australia. In 2016 motorcyclist deaths increased by 22 per cent, to 248 deaths (almost 1 in five road deaths). This represents an increase of 7.4 per cent on the National Road Safety Strategy base years (2008-2010).
While the national trend in motorcyclist fatality rates over the last decade has improved by 40 per cent, increased exposure means that the number of motorcyclist deaths in Australia is now similar to 10 years ago. This underpins the need to identify further areas for improvement and focus efforts on reducing motorcyclist fatalities and hospitalised injuries.
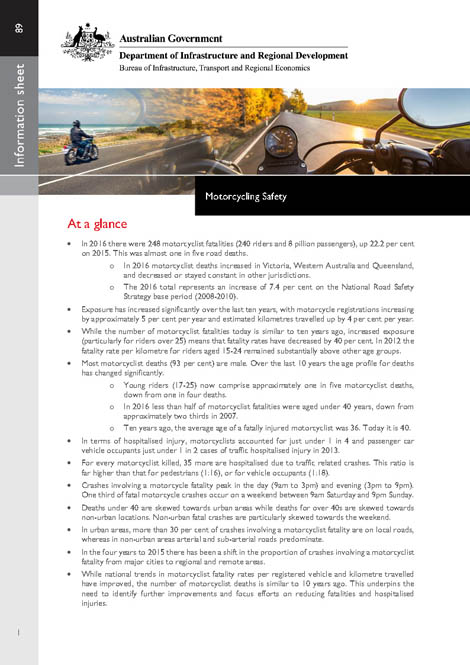
- Motorcycling Safety
Urban Passenger fares
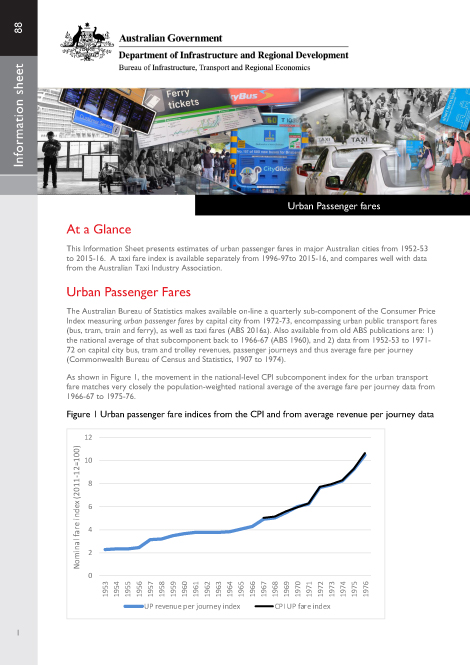
This Information Sheet presents estimates of urban passenger fares in major Australian cities from 1952-53 to 2015-16. A taxi fare index is available separately from 1996-97 to 2015-16. The general trend has been for rising real urban passenger fares, except during the period 1973-74 to 1979-80, when real fares fell as nominal fare levels failed to keep up with higher inflation rates. Rises in both real urban passenger fares and real taxi fares slowed after 2000-01.
- Urban Passenger fares
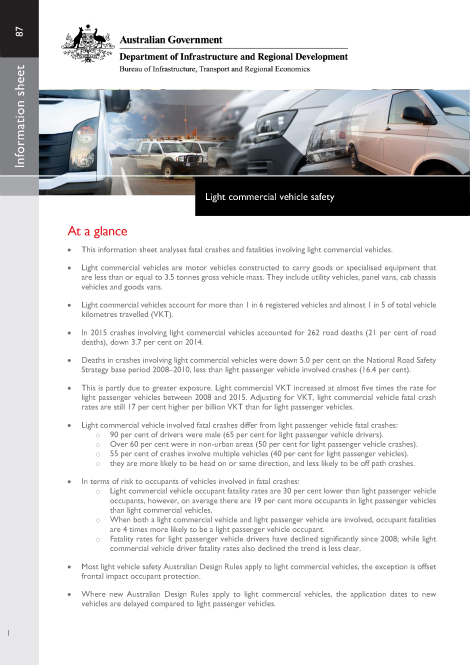
Light commercial vehicle safety
This information sheet analyses fatal crashes and fatalities involving light commercial vehicles. Light commercial vehicles account for more than 1 in 6 registered vehicles and almost 1 in 5 of total vehicle kilometres travelled (VKT).
In 2015 crashes involving light commercial vehicles accounted for 262 road deaths (21 per cent of road deaths), down 3.7 per cent on 2014. Deaths in crashes involving light commercial vehicles were down 5.0 per cent on the National Road Safety Strategy base period 2008–2010, less than light passenger vehicle involved crashes (down 16.4 per cent). This is partly due to greater exposure. Adjusting for VKT, light commercial vehicle fatal crash rates are still 17 per cent higher per billion VKT than for light passenger vehicles.
- Light commercial vehicle safety
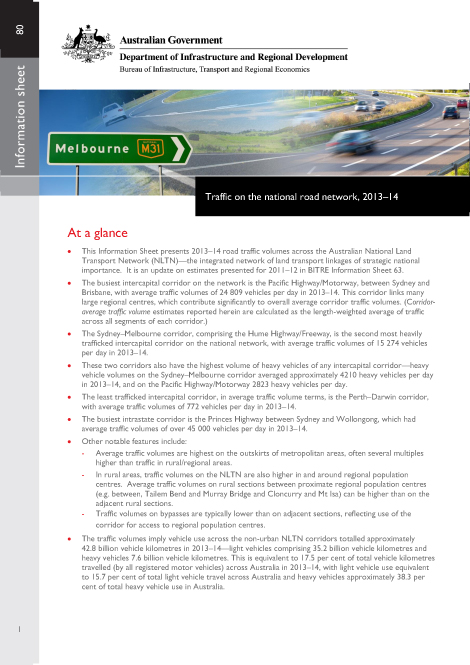
Traffic on the national road network, 2013–14
This Information Sheet presents 2013–14 road traffic volumes across the Australian National Land Transport Network (NLTN)–the integrated network of land transport linkages of strategic national importance. It is an update on estimates presented for 2011–12 in BITRE Information Sheet 63.
- Traffic on the national road network, 2013–14
Five facts about commuting in Australia
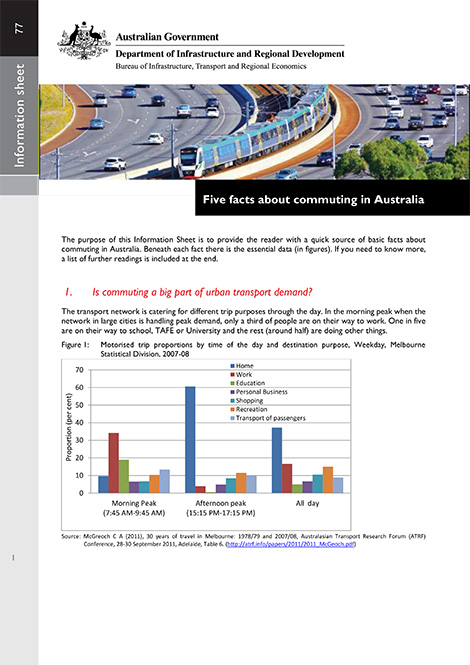
This Information Sheet covers a wide range of subjects, including volume and length of commuting, traffic congestion and commuting patterns. The following five questions are discussed:
- Is commuting a big part of urban transport demand?
- Is it true that a lot of people are spending hours stuck in traffic?
- What has an Italian physicist got to do with commuting?
- Why do some people commute longer? and
- Are our commuting patterns changing?
- Five facts about commuting in Australia
Bass Strait Passenger Vehicle Equalisation Scheme Monitoring Report No. 15
The Ministerial Directions governing the Bass Strait Passenger Vehicle Equalisation Scheme require us to produce a monitoring report every 2 years. Over the monitoring period (2013–14 to 2014–15):
- The Australian Government spent $40.9 million in 2014–15 on the Scheme, up 9.1% from 2013–14, and $37.5 million in 2013–14 (up 14.3% on 2012–13).
- The number of sea passengers with a motor vehicle may have been 23.6% higher than without the Scheme.
- Just under 18 000 new visitors to Tasmania travelled by sea due to the Scheme in 2014–15 (up from 14 500 new visitors in 2013–14).
- New visitors to Tasmania spent an estimated $50.2 million in Tasmania in 2014–15 (up from an estimated $39.0 million in 2013–14).
Pedestrians and road safety
Pedestrians comprise the largest single road user group because almost everyone is a pedestrian at some point. People walk for leisure, to go to work, school or local shops, and to access other modes of transport. In Australia, there has been a consistent downward trend in total road fatalities, including pedestrian fatalities. Since 2005, pedestrian fatalities as a percentage of all road fatalities have remained relatively stable.
- Pedestrians and road safety
The impact of airbags and electronic stability control on Australian light vehicle fatalities
This Information Sheet presents estimates of the impact of airbags and electronic stability control (ESC) on fatalities in light vehicle crashes. It is estimated that frontal airbags have reduced light vehicle fatalities by 13 per cent, side airbags have reduced light vehicle fatalities by 4 per cent, and that ESC has reduced light vehicle fatalities by 6 per cent. Together, these measures are estimated to have reduced light vehicle fatalities by 23 per cent. This may account for the equivalent of around half the reduction in the fatality rate, per kilometre travelled, since 2007. The impacts of side airbags and ESC will increase as newer vehicles filter through the fleet.
- The impact of airbags and electronic stability control on Australian light vehicle fatalities
Long-term trends in urban public transport

BITRE Information Sheet 60 provides detailed long-term trend statistics for Australian urban passenger transport. Historical time-series on passenger movement within the Australian capital cities, covering more than a century, contrast changes over time in patronage on urban public transport (UPT) systems with the corresponding patterns of private road vehicle use.
- Long-term trends in urban public transport
- Urban Transport Summary for 2013
- Latest urban transport statistics
Urban public transport: updated trends
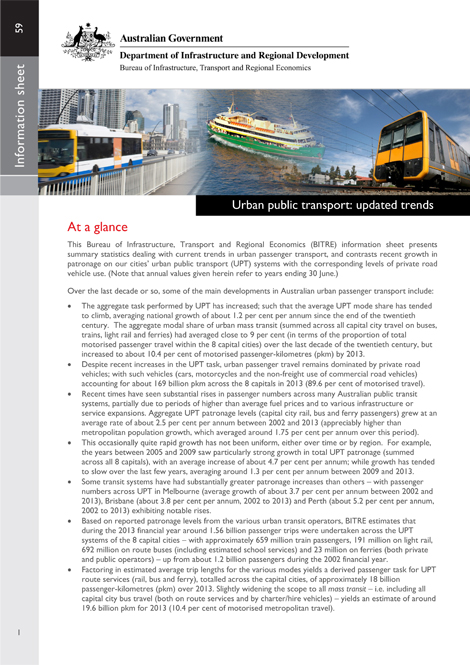
BITRE Information Sheet 59 summarises recent trends in Australian urban passenger transport–contrasting strong growth in urban public transport (UPT) over the last decade (with 2013 task levels almost 30 per cent higher than 2004) with that of private road vehicle use (with car travel in 2013 only about 3 per cent higher than 2004). Details or trend statistics are provided, across the State and Territory capital cities, for modal composition, travel growth rates, UPT cost recovery and transit service levels.
- Urban public transport: updated trends
- Urban Transport Summary for 2013
- Latest urban transport statistics