Chapter 10

This chapter provides data on Australian safety for road, aviation, rail and maritime transport types. This includes data relating to crashes, fatalities, injuries and their rates of occurrence, as well as how this can differ for different demographics, states and territories (subject to data availability).
- In 2022, 1,180 people died in road crashes in Australia, down from 1 737 in 2001.
- 34 aviation fatalities occurred in Australia in 2022.
- Road crashes caused 40 000 people in Australia to be with hospitalized injuries in 2021 up from 27 000 in 2001.
- On Australia’s railways, 13 people died and 47 were seriously injured in 2022 (excludes suspected suicide).
Figure 1 Number of fatal crashes, by transport mode
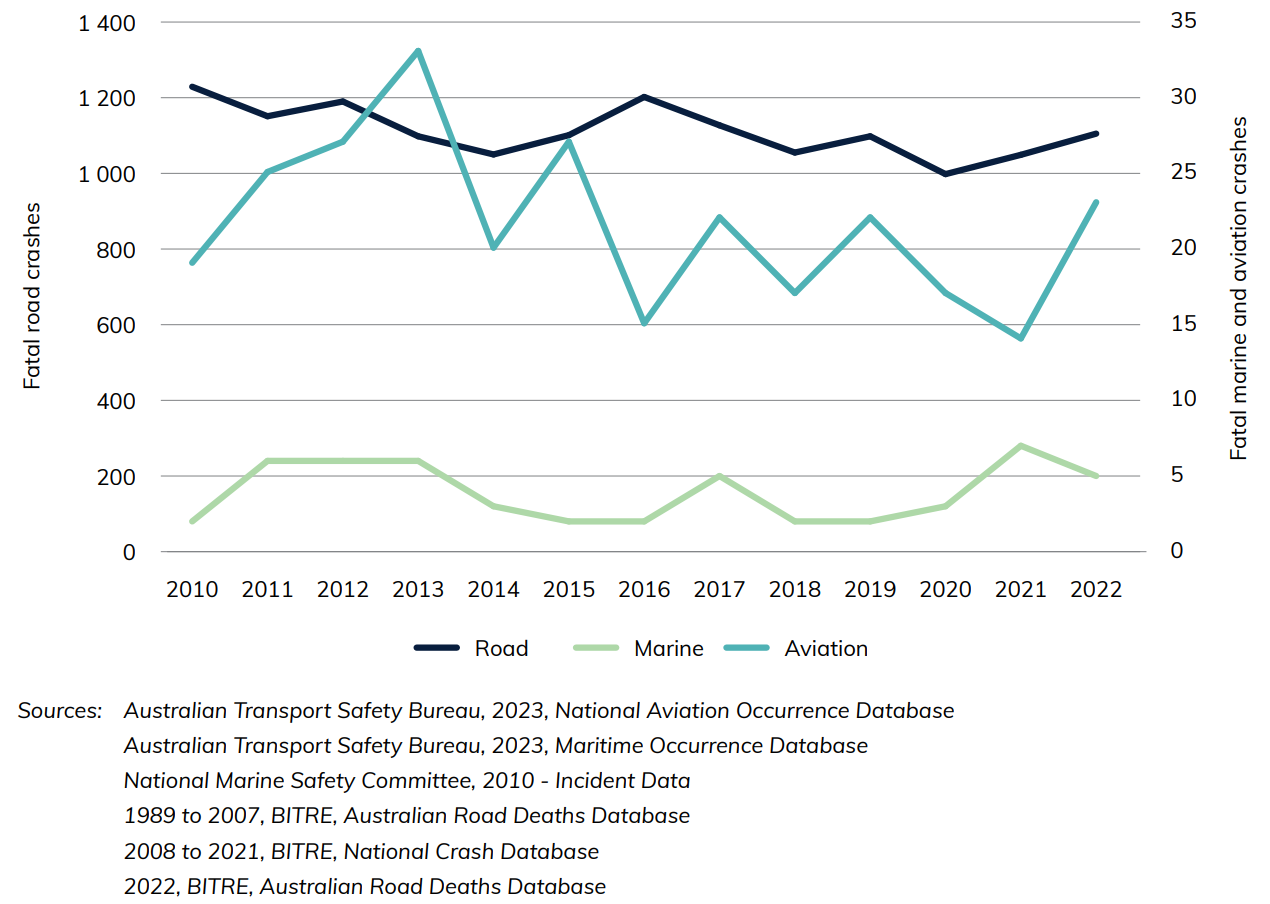
This graph shows the number of fatal crashes over time, by transport mode (with road crashes on the left axis and marine and aviation crashes on the right axis). Fatal road crashes (the number of crashes or accidents which resulted in at least one death) have been slowly trending downwards between 2010 and 2022, falling from 1 229 to 1 105, with an average of 1 112 over this period. There were 33 fatal aviation crashes in 2013 and they have remained between 14 and 23 since 2016. Marine fatal crashes have remained between 2 and 6 from 2010 to 2022.
Download data
Also see
Chapter 10
This chapter provides data on Australian safety for road, aviation, rail and maritime transport. This includes data relating to crashes, fatalities, injuries and their rates of occurrence, as well as how this can differ for different demographics, states and territories (subject to data availability).
- In 2023, 1 258 people died in road crashes in Australia, down from 1 737 in 2001.
- 33 aviation fatalities occurred in Australia in 2023.
- Road crashes caused 40 000 people in Australia to be with hospitalized injuries in 2021 up from 27 000 in 2001.
- On Australia's railways, 15 people died and 63 were seriously injured in 2023 (excludes suspected suicide).
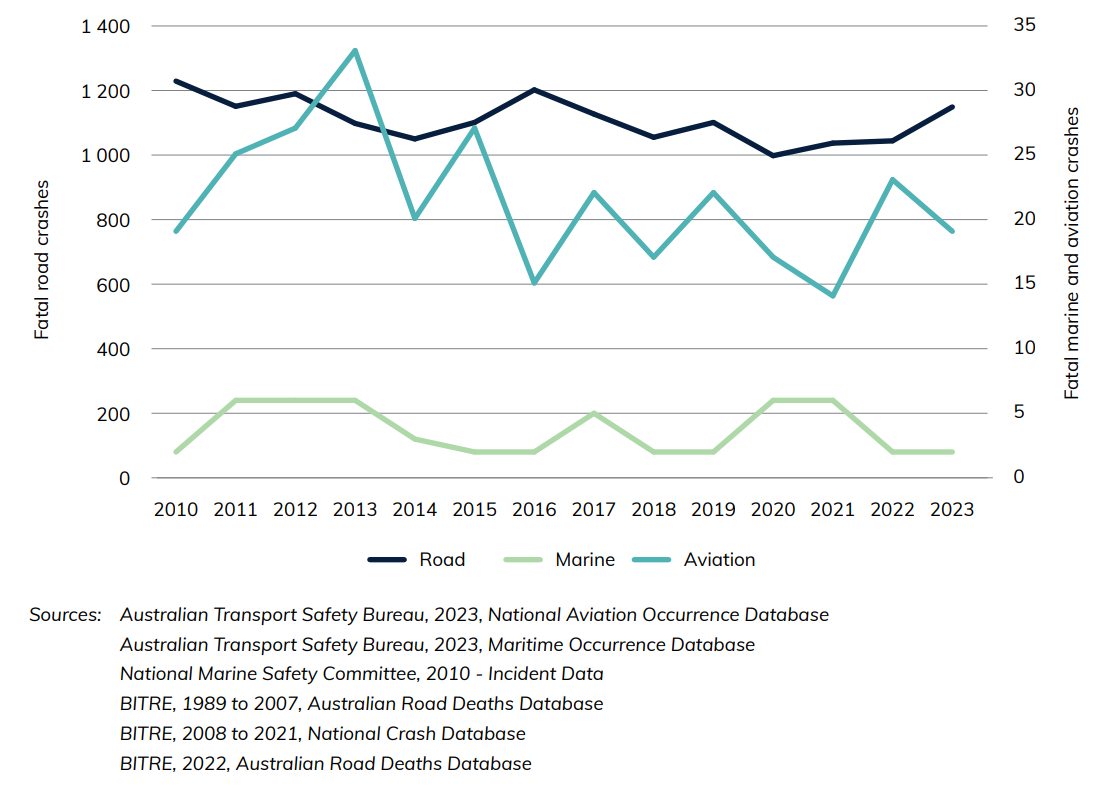
Figure 21 shows the number of fatal crashes over time (with road crashes on the left axis and marine and aviation crashes on the right axis). The average number of fatal road crashes (the number of crashes or accidents which resulted in at least one death) from 2010 to 2023 is 1109. In 2023 there was 1149 fatal road crashes. Fatal aviation crashes have remained between 14 and 23 since 2016. Marine fatal crashes have remained between 2 and 6 from 2010 to 2023.
Figure 21 Number of fatal crashes, by transport mode
Download data
- Transport Safety—Yearbook 2024 (178 KB) - Download Excel file
- Australian Infrastructure and Transport Statistics—Yearbook 2024 - Download PDF
Also see
Chapter 8
This chapter provides data on Australian safety for road, aviation, rail and maritime transport. This includes data relating to crashes, fatalities, injuries and their rates of occurrence, as well as how this differs for different demographics, states and territories (subject to data availability).
- In 2024, there were 1,294 road deaths, down from 1,737 in 2001.
- 28 aviation fatalities occurred in Australia in 2024.
- Road crashes resulted in approximately 36,000 hospitalised injuries across Australia in calendar year 2022, up from 27,000 in calendar year 2001.
- On Australia’s railways, 22 people died and 66 were seriously injured in 2024 (excludes suspected suicide).
Figure 16 shows the number of fatal crashes over time.
Figure 16 Fatalities by transport mode
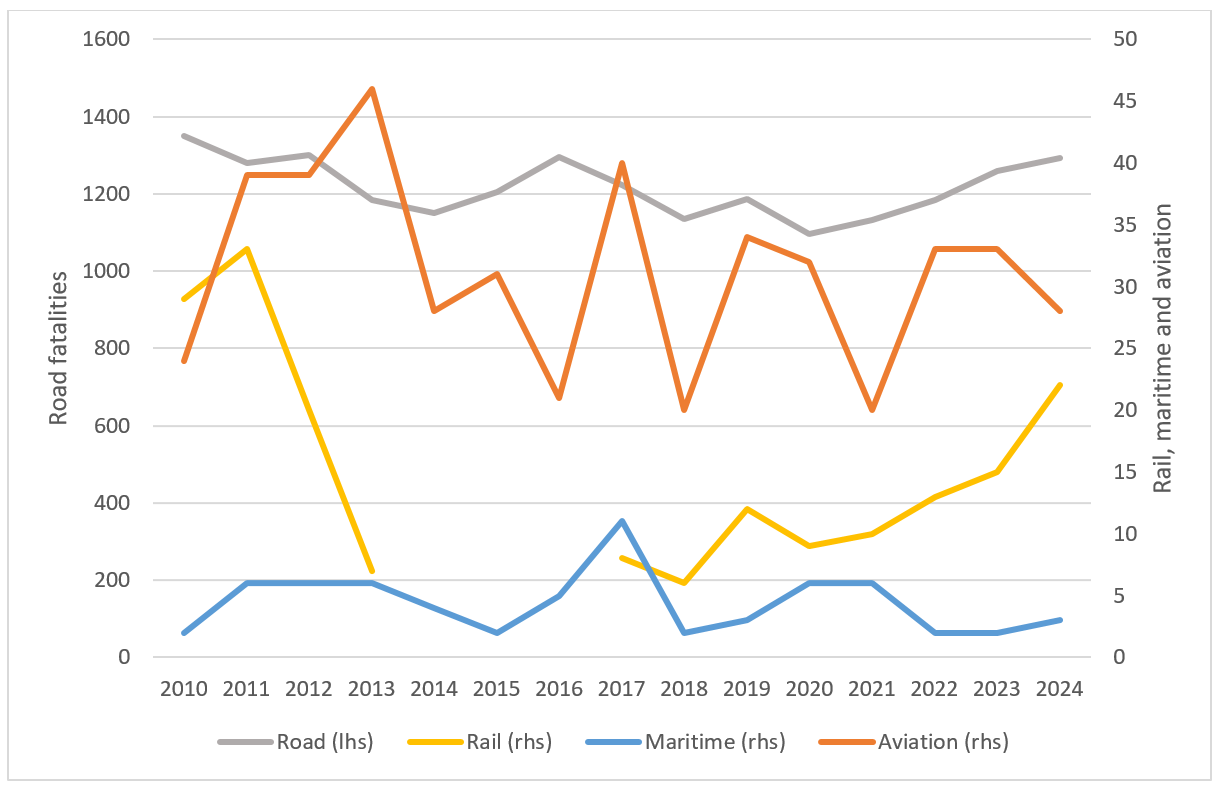
Source: Table 8.1
Download data
- Transport Safety—Yearbook 2025 (154 KB) - Download Excel file
- Australian Infrastructure and Transport Statistics Yearbook 2025 - Download PDF
Also see
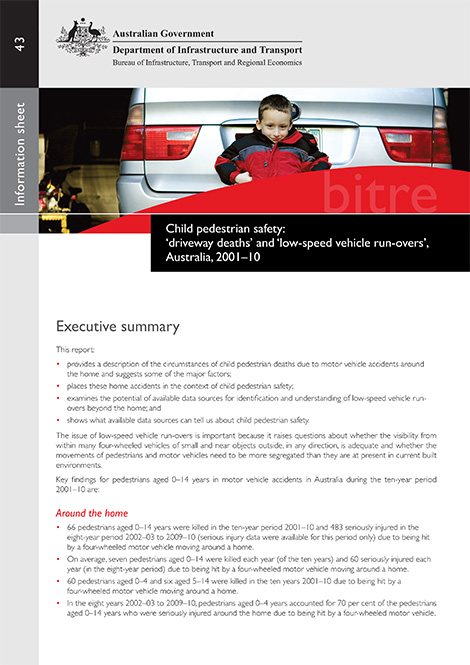
Child pedestrian safety: ‘driveway deaths’ and ‘low-speed vehicle run-overs’, Australia, 2001–10
Archived Road Trauma Involving Heavy Vehicles—Annual Summaries
-
2020
-
2019
- 2018
- 2017
- 2016
- 2015
- 2014
- 2013
Archived international road safety comparisons—annual
- 2022
- 2020
- 2019
- 2018
- 2017
- 2016
- 2015
- 2014
- 2013
- 2012
- 2011
- 2010
- 2009
- 2007
- 2006
- 2005
- 2004
- 2003
- 2002
- 2001
- Monograph 6: Australia's International Road Safety Performance 1998
- Monograph 2: Australia's International Road Safety Performance 1997
- Pre-ATSB (FORS) Monograph 28: Australia's International Road Safety Performance 1996
- Pre-ATSB (FORS) Monograph 16: Australia's International Road Safety Performance
- CR 114: Trends in Road Crash Fatality Rates: International Comparisons with Australia 1970–1990 (1992)
Archived road trauma Australia—annual summaries
Older issues of Road Trauma Australia—Annual Summaries are available below.
- 2022
- 2021
- 2020
- 2019
- 2018
- 2017
- 2016
- 2015
- 2014
- 2013
- 2012
- 2011
- 2010
- 2009
- 2008
- 2007
- 2006
- 2005
- 2004
- 2002
- 2001
Severe injuries from road crashes—Australia New Zealand Trauma Registry
These data extracts from the Australia New Zealand Trauma Registry provide summary tables of severe injury cases (admitted patients with an Injury Severity Score > 12) from participating hospitals. The report has separate tables for on-road transport, off-road transport, unknown transport and non-transport cases. Data are preliminary and relate to participating hospitals only
These tables are produced under the joint Australian Trauma Registry funding agreement between the Department of Health and the Department of Infrastructure, Transport, Regional Development, Communications and the Arts.
Location and other risk factors in crashes
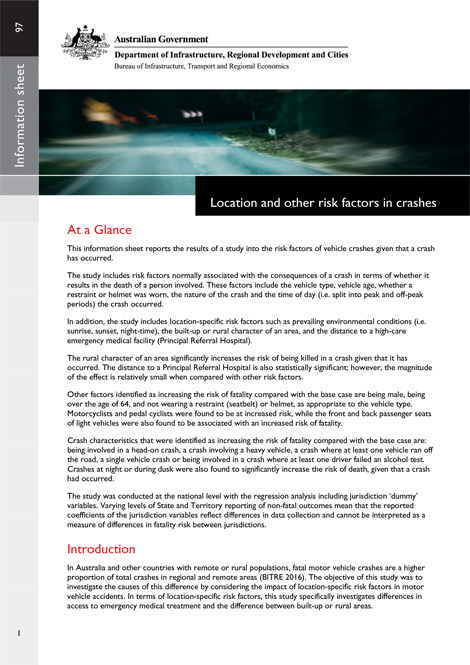
This information sheet reports results of a study into the risk factors of vehicle crashes given a crash has occurred in terms of whether it results in the death of a person involved. Factors include vehicle type and age, whether a restraint or helmet was worn, nature of crash, time of day and location-specific factors such as the built-up or rural character of an area, the distance to high-care emergency medical facility and environmental conditions i.e. sunrise, sunset or night-time.
- Location and other risk factors in crashes
Modelling Road Safety in Australian States and Territories
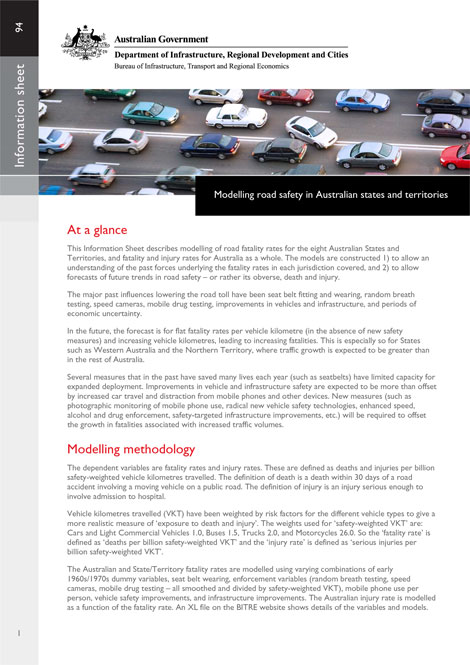
This Information Sheet describes modelling of road fatality rates for the eight Australian States and Territories, and fatality and injury rates for Australia as a whole. The models are constructed 1) to allow an understanding of the past forces underlying the fatality rates in each jurisdiction covered, and 2) to allow forecasts of future trends in road safety–or rather its obverse, death and injury.
- Modelling Road Safety in Australian States and Territories
- Modelling Road Safety in Australian States and Territories