Road and Rail Supply Chain Resilience Review
BITRE is leading a review into the resilience of Australian road and rail supply chains.
This review will identify the supply chains that are most critical to Australian communities and businesses, the risks they face, and a stocktake of any work underway to mitigate risks. This work will help to inform action by government on how to effectively and efficiently mitigate risks in supply chains for the benefit of all Australians.
The Terms of Reference for the review are presented below.
Phase One of the review was released on 6 February 2023.
Enquiries about the review can be addressed to: RoadandRailResilience@infrastructure.gov.au
All media enquiries should be addressed to: media@infrastructure.gov.au
Road and Rail Supply Chain Resilience Review – Terms of Reference
All Australians depend on strong and resilient supply chains. The impacts of COVID-19, natural disasters and a growing freight task have shown the increasing importance of Australian on-land supply chains, and their critical importance to the national economy, and the lives and livelihoods of Australians. Understanding which supply chains are of national importance, the risks they face, and how government and industry can work to mitigate these risks is essential to ensure supply chains remain resilient and fit-for-purpose now and in the future.
In March 2022, the Department of Infrastructure, Transport, Regional Development, Communications and the Arts was asked to conduct a review into Australia’s road and rail supply chain resilience, supported by independent advice as required.
The review will:
- Define and determine key risks to critical supply routes – routes that transport large quantities of freight or are critical to supply of essential goods or services across Australia;
- Identify key risks to critical supply routes in the short, medium and long term — including weather events or natural disasters, limited alternative routes, and limited and difficult to access alternative transport modes;
- Assess the potential vulnerabilities in critical supply routes;
- Complete a stocktake of recent relevant work by government and industry intended to identify and mitigate Australian domestic road and rail supply chain risks;
- Identify data generation, capture and use requirements necessary to assess, inform best‑practice and improve road and rail supply chain resilience;
- Determine the critical routes at highest risk of failure; and
- Develop and present pragmatic options for governments to mitigate or address risks to critical road and rail supply chains, in alignment with the Government-agreed framework to identify and mitigate critical supply chain risks.
The focus of the review is on Australia’s road and rail infrastructure and linked infrastructure. Matters such as international supply chain vulnerability, costs of freight, the transport workforce and critical inputs to the transport sector are outside the scope of the review.
The review will take into consideration supporting work, including but not limited to the:
- Australian Infrastructure Plan;
- National Freight and Supply Chain Strategy, including the National Freight Data Hub;
- National Urban Freight Planning Principles;
- Final Report of the Royal Commission into National Natural Disaster Arrangements;
- Final Report of the Productivity Commission Study into Vulnerable Supply Chains;
- National Rail Action Plan;
- Supply Chain Resilience Initiative; and
- DITRDC’s Key Freight Routes Map.
The review will engage closely with the Freight Industry Reference Panel, and also consult with:
- Key infrastructure owners and operators;
- Freight industry stakeholders – including freight customers;
- State and territory governments;
- National Recovery and Resilience Agency (NRRA);
- Infrastructure Australia;
- CSIRO;
- The Department of the Prime Minister and Cabinet, including the Office of Supply Chain Resilience;
- The Department of Home Affairs (including Emergency Management Australia and the National Coordination Mechanism);
- The Department of Agriculture, Water and the Environment, including the Australian Climate Service; and
- Any other groups DITRDC deems necessary.
Phase 1 – Building the evidence base
This report presents the Bureau of Infrastructure and Transport Research Economics’ (BITRE) findings for the first six components of the Terms of Reference based on an initial assessment of Australia’s road and rail supply chain resilience.
The evidence in this report draws on a literature review, extensive stakeholder consultation and geospatial analysis, including scenario modelling. Scenario modelling provides greater insight into a number of key critical and vulnerable routes, including an assessment of the likelihood and expected impact of various hazards on road and rail supply chains. The Review also presents a number of case studies to provide real-world illustrations of the impact of natural and human induced risks, as well as examples of initiatives to address supply chain issues.
Supplementary materials
- Appendix B – Resilience analysis of key freight roads and railways using CSIRO’s TraNSIT
- Appendix C – Analysis of risks impacting the resilience of supply chains
- Appendix F – Summary of risks and impacts on critical KFRs
- Appendix G – Stocktake of current or recently completed resilience initiatives across government
Australian Infrastructure and Transport Statistics Yearbook 2025: Rail chapter
Chapter 5: Rail
- Australian Infrastructure and Transport Statistics Yearbook 2025 - Download PDF
- Rail—Yearbook 2025 (99 KB) - Download Excel file
This chapter provides information on rail expenditure, activity and network lengths. Estimates of passenger kilometres up to 2024-25 can be found in Chapter 2 - Passengers.
- People in Melbourne use light rail more than any other city with 155 million passengers in 2023–24.
- People in Sydney use heavy rail more than any other city with 352 million passengers in 2023–24.
- In 2023-24 there were $36 billion of public rail-related expenditure.
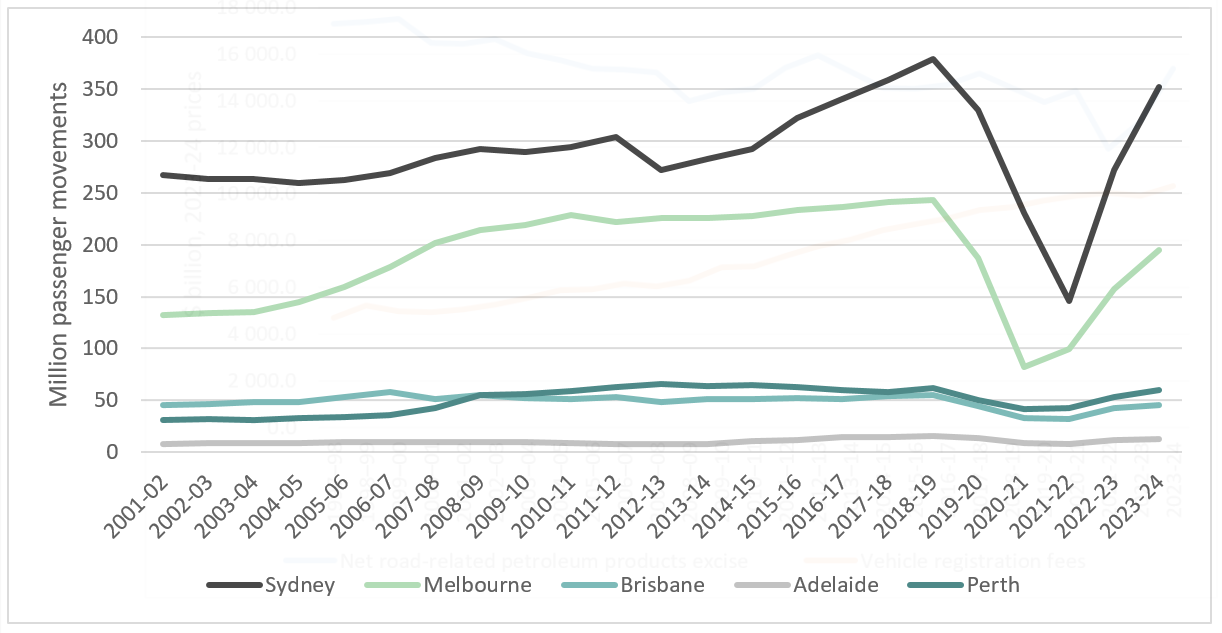
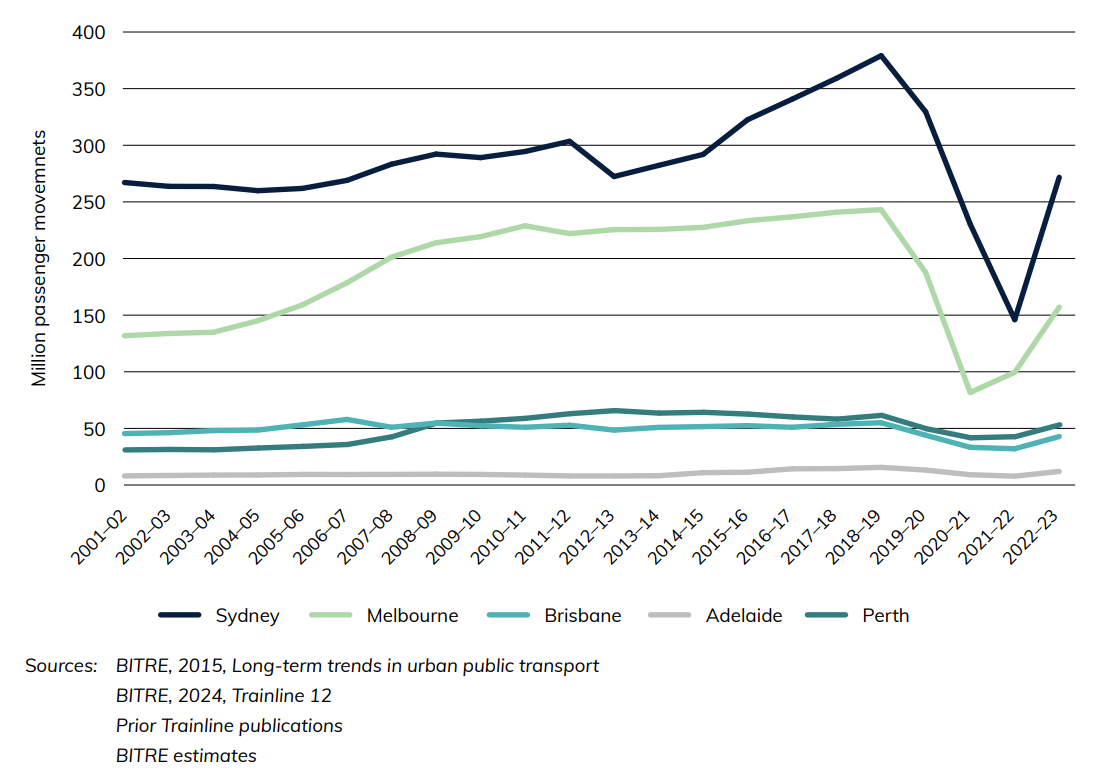
Figure 10 shows Australia’s network of railways by gauge and Figure 11 shows rail public transport patronage by million passenger movements. This refers to all trips on suburban rail networks and is based on reporting from train operators. Passenger movements were trending upwards in Sydney, Melbourne, Perth and Adelaide before starting to fall sharply in 2019–20 due to the COVID-19 pandemic. By 2023–24 patronage numbers had generally still not returned to 2018–19 levels.
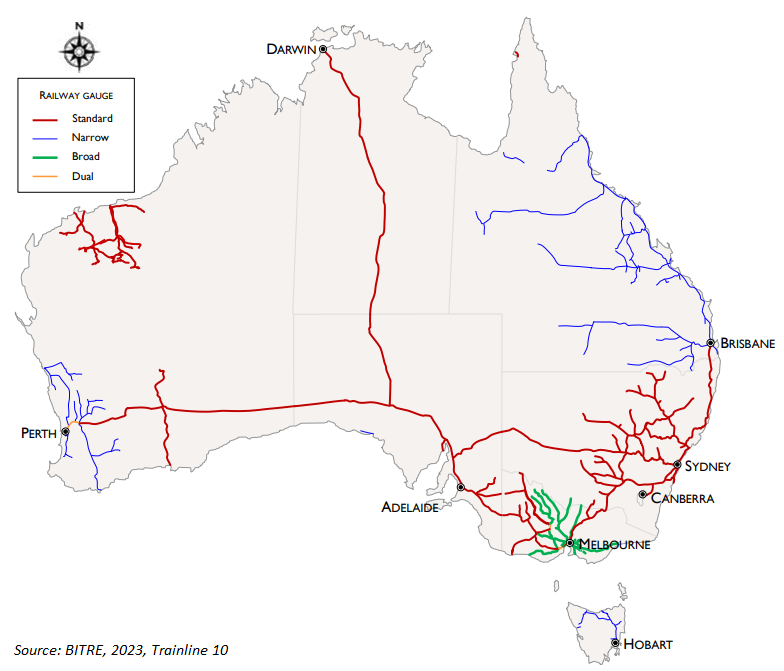
Figure 10 Australia’s railways, by gauge
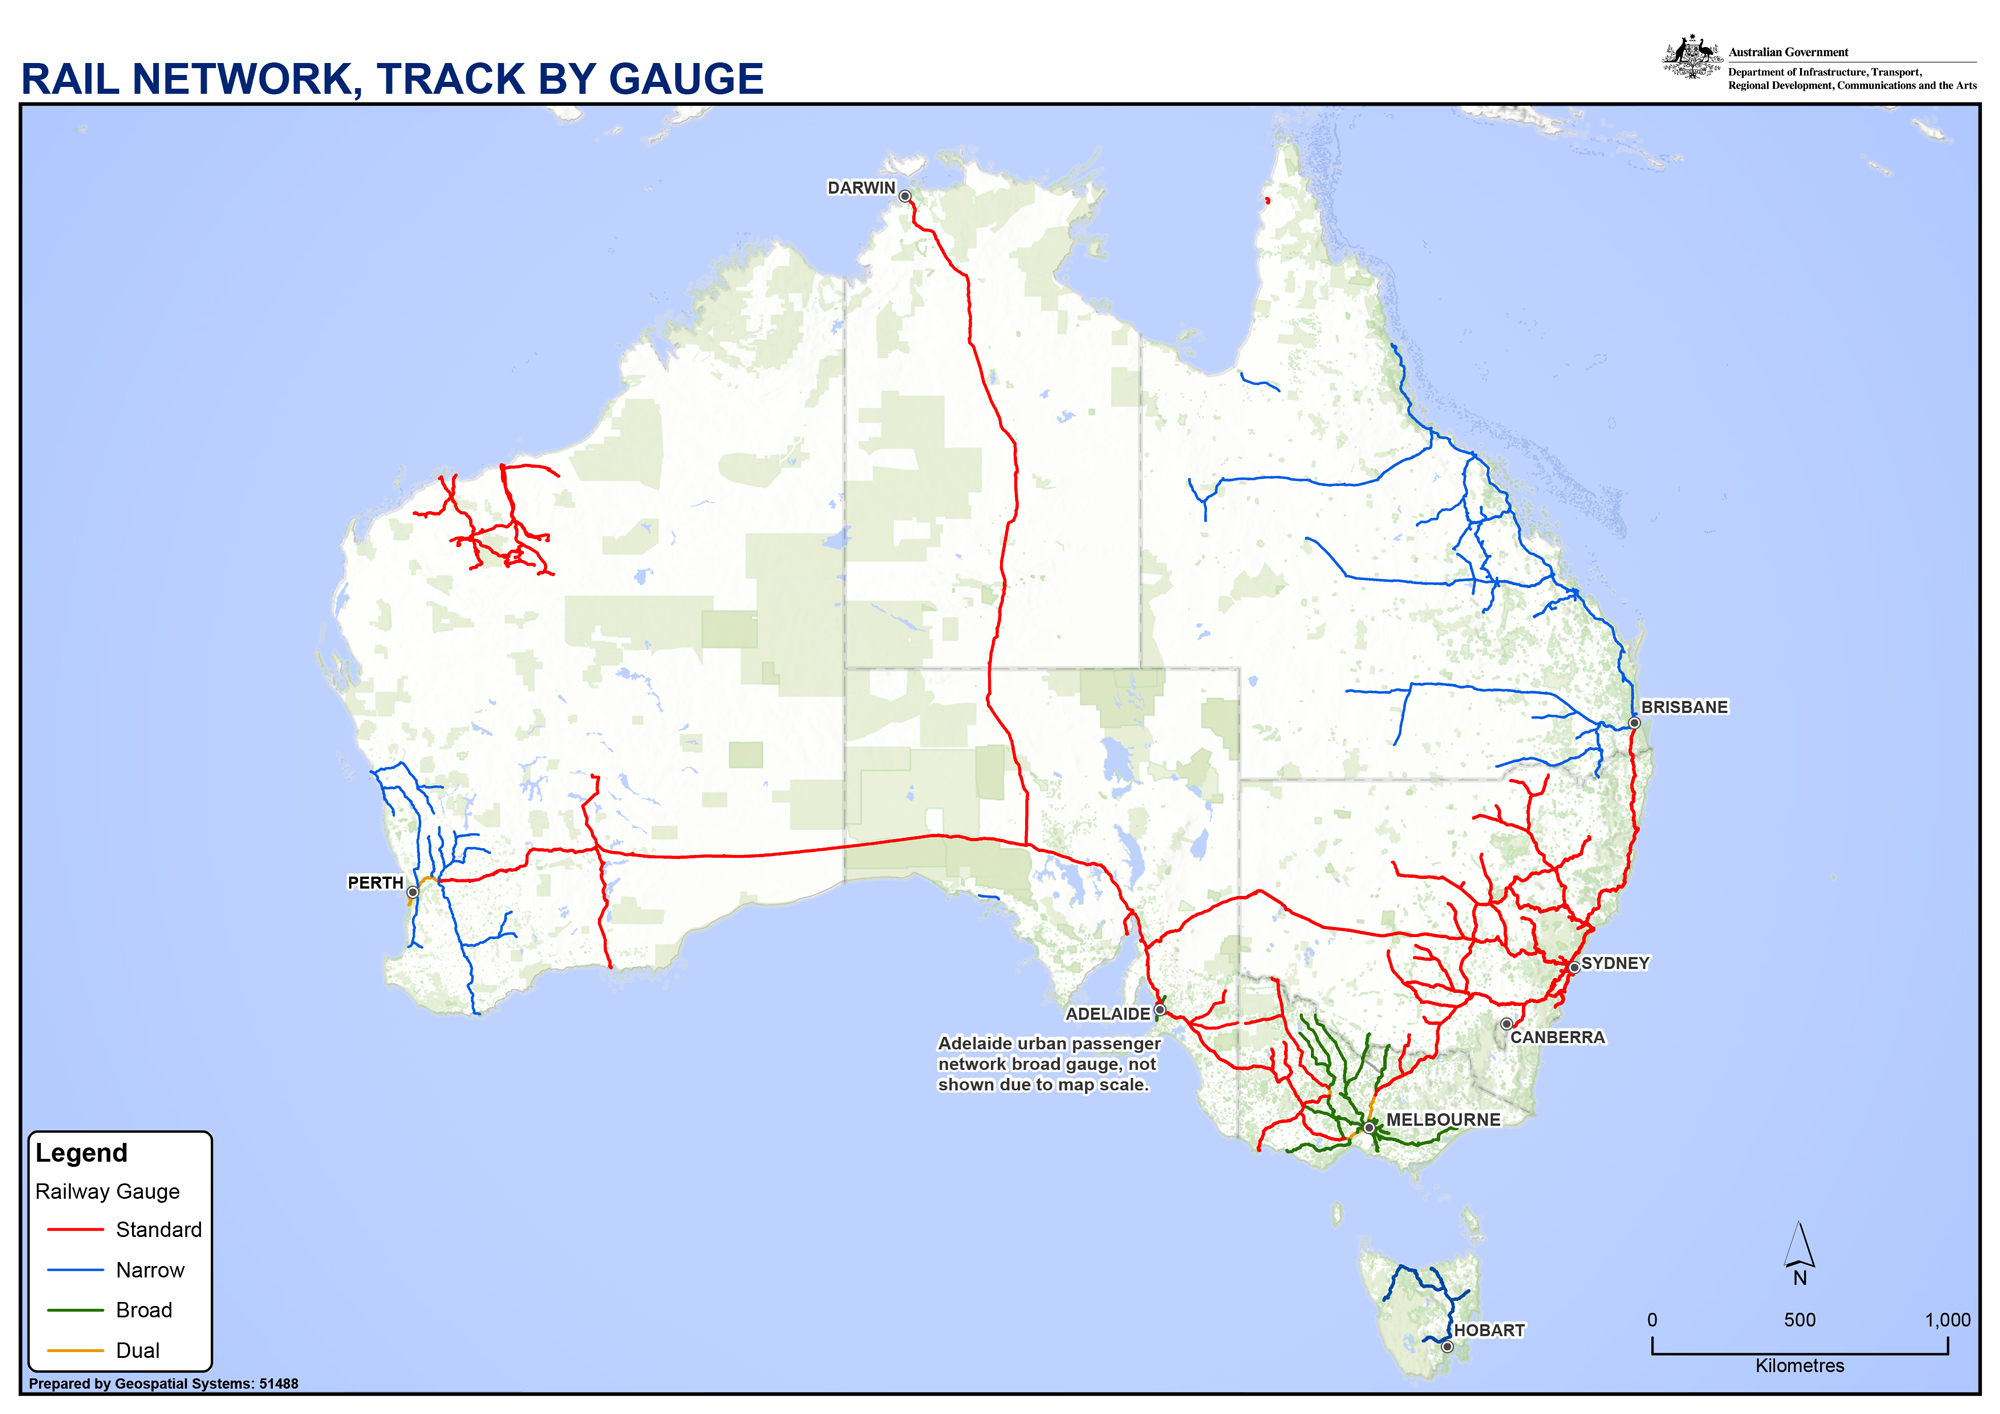
Source: BITRE (2025), Trainline 12
Figure 11 Public transit patronage on heavy rail, Australian capital city networks
Sources: BITRE (2015), Long-term trends in urban public transport
BITRE (2025), Trainline 12
Prior Trainline publications
Related freight reports
For additional freight related information select the relevant publication below.
Australian Infrastructure and Transport Statistics Yearbook 2023 and Rail chapter
Chapter 7
Download data
Chapter 7 provides information on rail lengths, rail interstate non-bulk freight, public transit patronage on rail and rail related expenditure. The data is sourced mainly from BITRE and the Australian Bureau of Statistics.
- People in Melbourne use light rail more than any other city with 205 million passengers in 2018-19 (before COVID impacts).
- People in Sydney use heavy rail more than any other city with 379 million passengers in 2018-19 (before COVID impacts).
- 18.2 billion dollars was spent by all government on rail related projects in 2021-22.
Figure 1 Australia’s railways, by gauge
The lines shown in Figure 1 are the railways that were open for traffic at October 2022. The only change since 2021 was the opening of the Forrestfield-Airport Link (Metronet) line in Perth.
Figure 2 Public transit patronage on heavy rail, Australian capital cities
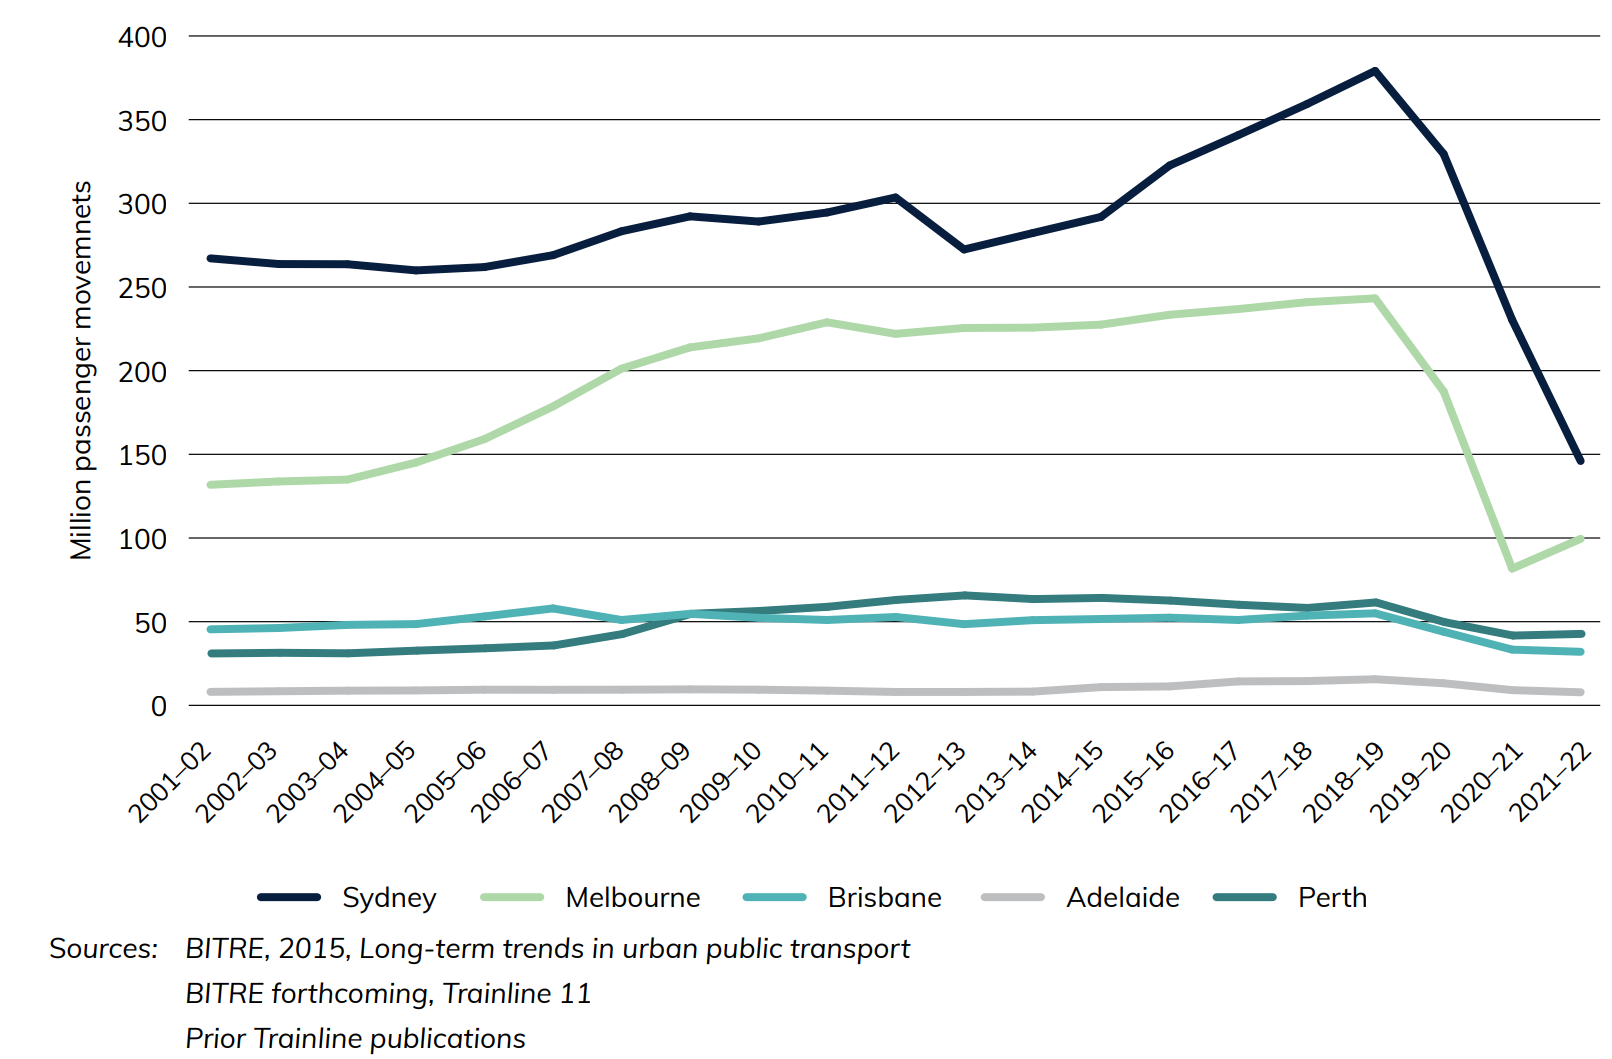
Figure 2 shows rail public transport patronage by million passenger movements. Passenger movements were trending upwards in Sydney, Melbourne, Perth and Adelaide before starting to fall sharply in 2019-20 due to the COVID-19 pandemic. While Melbourne’s passenger numbers began to recover in 2021-22, Sydney’s continued to decline rapidly, recording a larger proportional fall than in each of the two preceding years. This refers to all trips on suburban rail networks and is based on reporting from train operators.
Chapter 7
Chapter 7 aims to give an understanding of Australia's rail characteristics. This chapter provides information on rail lengths, rail interstate non-bulk freight, public transit patronage on rail and rail related expenditure. The data is sourced mainly from BITRE and the Australian Bureau of Statistics.
- People in Melbourne use light rail more than any other city with 148 million passengers in 2022–23.
- People in Sydney use heavy rail more than any other city with 271 million passengers in 2022–23.
- In 2022–23 there were 35 billion dollars of public rail-related expenditure.
Figure 15 shows Australia's network of railways by gauge, breaking it down into different classifications. The lines shown here are the railways that were open for traffic at October 2022. The only change since 2021 was the opening of the Forrestfield-Airport Link (Metronet) line in Perth.
Figure 15 Australia's railways, by gauge
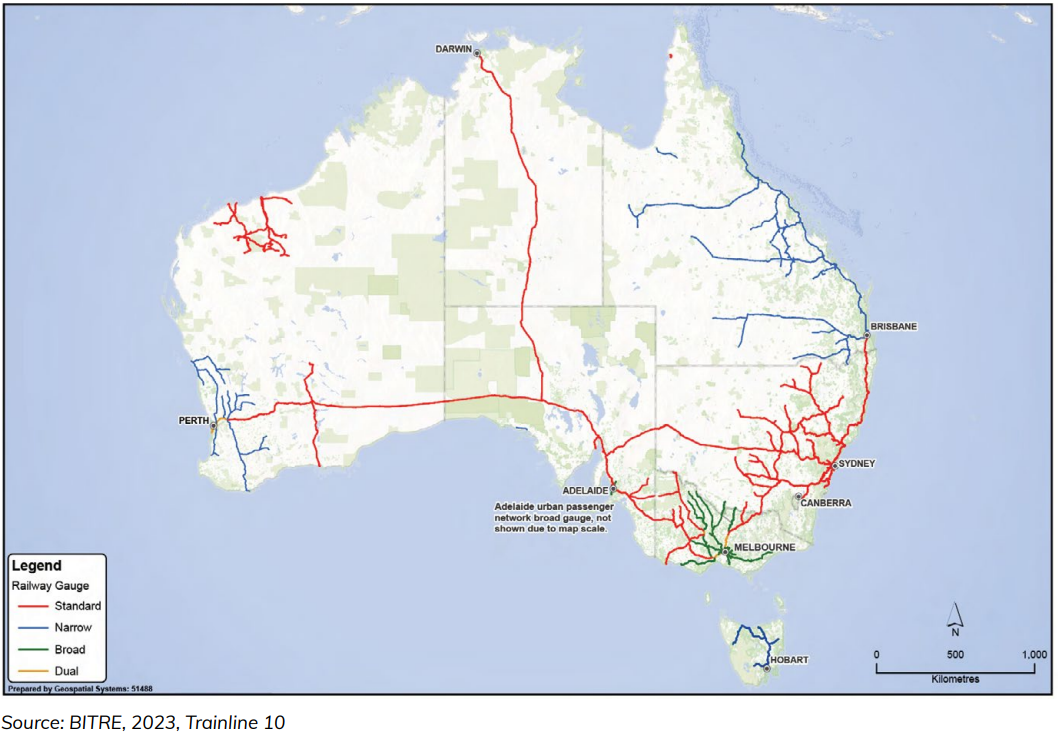
Figure 16 shows rail public transport patronage by million passenger movements. Passenger movements were trending upwards in Sydney, Melbourne, Perth and Adelaide before starting to fall sharply in 2019–20 due to the COVID-19 pandemic. While Melbourne's passenger numbers began to recover in 2021–22, Sydney's continued to decline rapidly, recording a larger proportional fall than in each of the two preceding years. This refers to all trips on suburban rail networks and is based on reporting from train operators.
Figure 16 Public transit patronage on heavy rail, Australian capital cities
Download data
- Rail—Yearbook 2024 (105 KB) - Download Excel file
- Australian Infrastructure and Transport Statistics—Yearbook 2024 - Download PDF
Also see
Chapter 5
This chapter provides information on rail expenditure, activity and network lengths. Estimates of passenger kilometres up to 2024-25 can be found in Chapter 2 - Passengers.
- People in Melbourne use light rail more than any other city with 155 million passengers in 2023–24.
- People in Sydney use heavy rail more than any other city with 352 million passengers in 2023–24.
- In 2023-24 there were $36 billion of public rail-related expenditure.
Figure 10 shows Australia’s network of railways by gauge and Figure 11 shows rail public transport patronage by million passenger movements. This refers to all trips on suburban rail networks and is based on reporting from train operators. Passenger movements were trending upwards in Sydney, Melbourne, Perth and Adelaide before starting to fall sharply in 2019–20 due to the COVID-19 pandemic. By 2023–24 patronage numbers had generally still not returned to 2018–19 levels.
Figure 10 Australia’s railways, by gauge
Source: BITRE (2025), Trainline 12
Figure 11 Public transit patronage on heavy rail, Australian capital city networks
Sources: BITRE (2015), Long-term trends in urban public transport
BITRE (2025), Trainline 12
Prior Trainline publications
Download data
- Rail—Yearbook 2025 (99 KB) - Download Excel file
- Australian Infrastructure and Transport Statistics Yearbook 2025 - Download PDF
Also see
This compendium provides insights, analysis, and an understanding of the railway industry. Australia's railways are evolving, with changes both outside and within the industry. These changes include logistics, commodity flows, technology, urban patronage, and regional passenger services. The publication presents an overview and data on railway transport tasks performed; characteristics of the railways and train operators' rolling stock that runs; and aspects of railway performance, including safety, environment and reliability.
Trainline 12 gives an overview of freight, urban and non-urban passenger rail. The report analyses traffic levels, the provision of infrastructure and rolling stock, and railway performance. It is the twelfth in the publication series.
Trainline is a compendium of Australia's railways, providing insights, analysis and an understanding of the railway industry. Australia's railways are evolving, with changes within and outside the industry. These changes include logistics, commodity flows, technology, urban patronage and regional passenger services. The publication presents an overview and data on railway transport tasks performed; characteristics of the railways and train operators' rolling stock that runs; and aspects of railway performance including safety, environment and reliability.
Trainline 11 gives an overview of freight, urban and non-urban passenger rail. The report analyses traffic levels, the provision of infrastructure and rolling stock, and railway performance. It is the eleventh in the publication series.
Economic Contribution of Transport in Australia, 2020-21
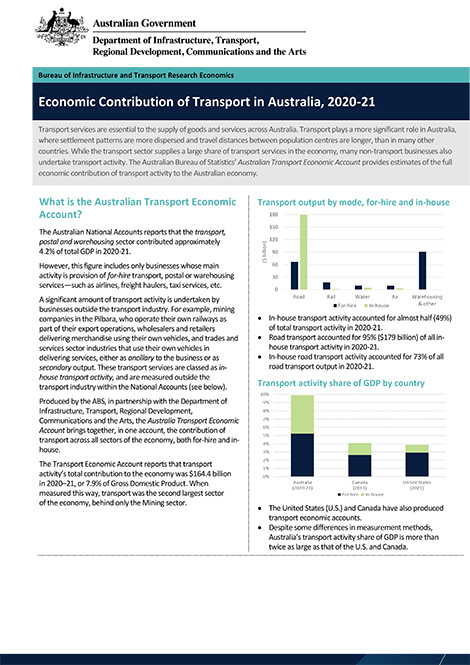
The Australian Bureau of Statistics’ (ABS) Australian Transport Economic Accounts (ATEA) 2020-21 provide estimates of the full economic contribution of transport activity, both for-hire and in-house transport services, to the Australian economy, from 2010-11 to 2020-21.
The ATEA estimates that transport’s total contribution to the economy was $164.4 billion in 2020-21, equivalent to 7.9 per cent of total GDP. Measured in this way, transport was the second largest sector of the economy, behind only the Mining sector.
This release provides a short summary and highlights of the ABS ATEA 2020-21. More detailed ATEA statistics and explanatory notes are available from the ABS website: www.abs.gov.au/statistics/economy/national-accounts/australian-transport-economic-account-experimental-transport-satellite-account
Trainline is a compendium of Australia's railways that provides insights, analysis and an understanding of the railway industry. Australia's railways are evolving, with changes within and outside the industry. These changes include logistics, commodity flows, technology, urban patronage, and regional passenger services. The publication presents an overview and data on railway transport tasks performed; characteristics of the railways and train operators' rolling stock that runs; and aspects of railway performance, including safety, environment and reliability.