Australian Infrastructure and Transport Statistics Yearbook 2025: Roads chapter
Chapter 4: Roads
- Australian Infrastructure and Transport Statistics Yearbook 2025 - Download full report PDF
- Road—Yearbook 2025 (266 KB) - Download Excel file
- For information on road-related revenue and expenditure - see chapter 3 of the 2025 Yearbook
This chapter provides information on Australian roads including length, use, the vehicle fleet, and the number of vehicle licences.
- An estimated 264 billion vehicle kilometres were travelled on Australia's roads in 2024–25.
- In 2024, there were 476,000 km of paved roads in Australia.
- 20 million Australians had vehicle licences at 2024–25.
- In 2024–25, Sports Utility Vehicles (SUVs) comprised 59% of new motor vehicle sales (excluding motorcycles) compared with only 33% ten years earlier.
Figure 8 shows total vehicle kilometres by vehicle type. Figure 9 shows Australia’s national road network. Total vehicle kilometres travelled fell significantly during the COVID pandemic, only surpassing their previous 2017–18 peak in 2023–24.
Figure 8 Vehicle kilometres travelled by vehicle type
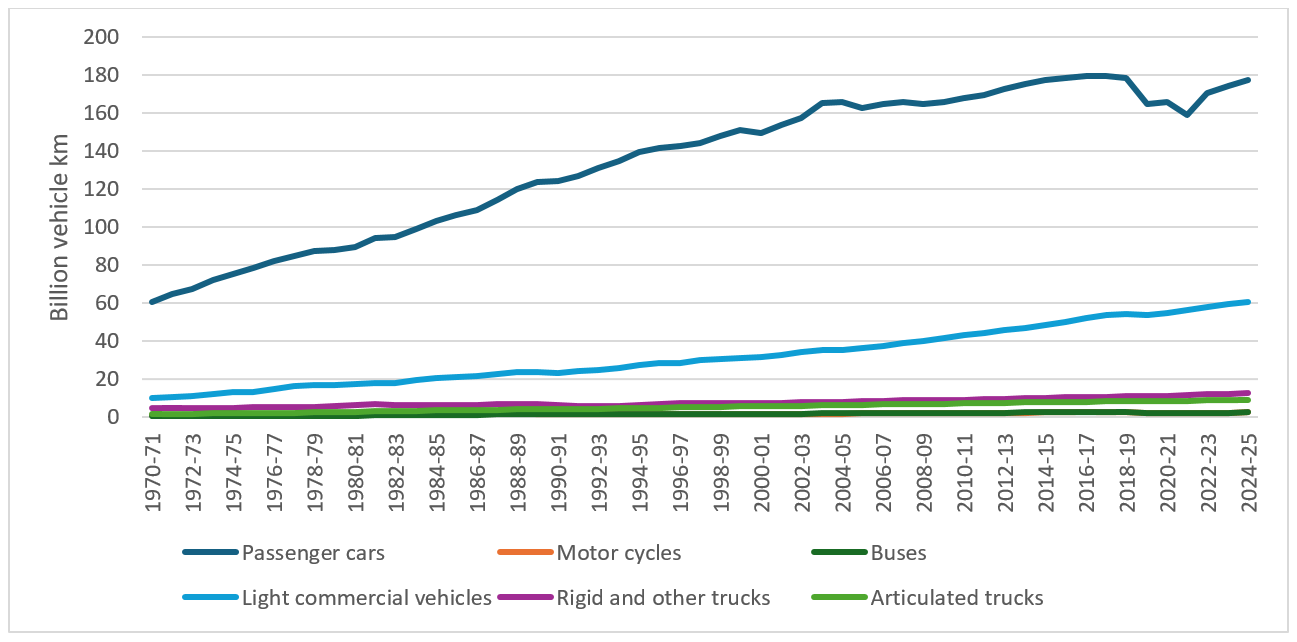
Source: Table 4.2
Figure 9 Map of national road network
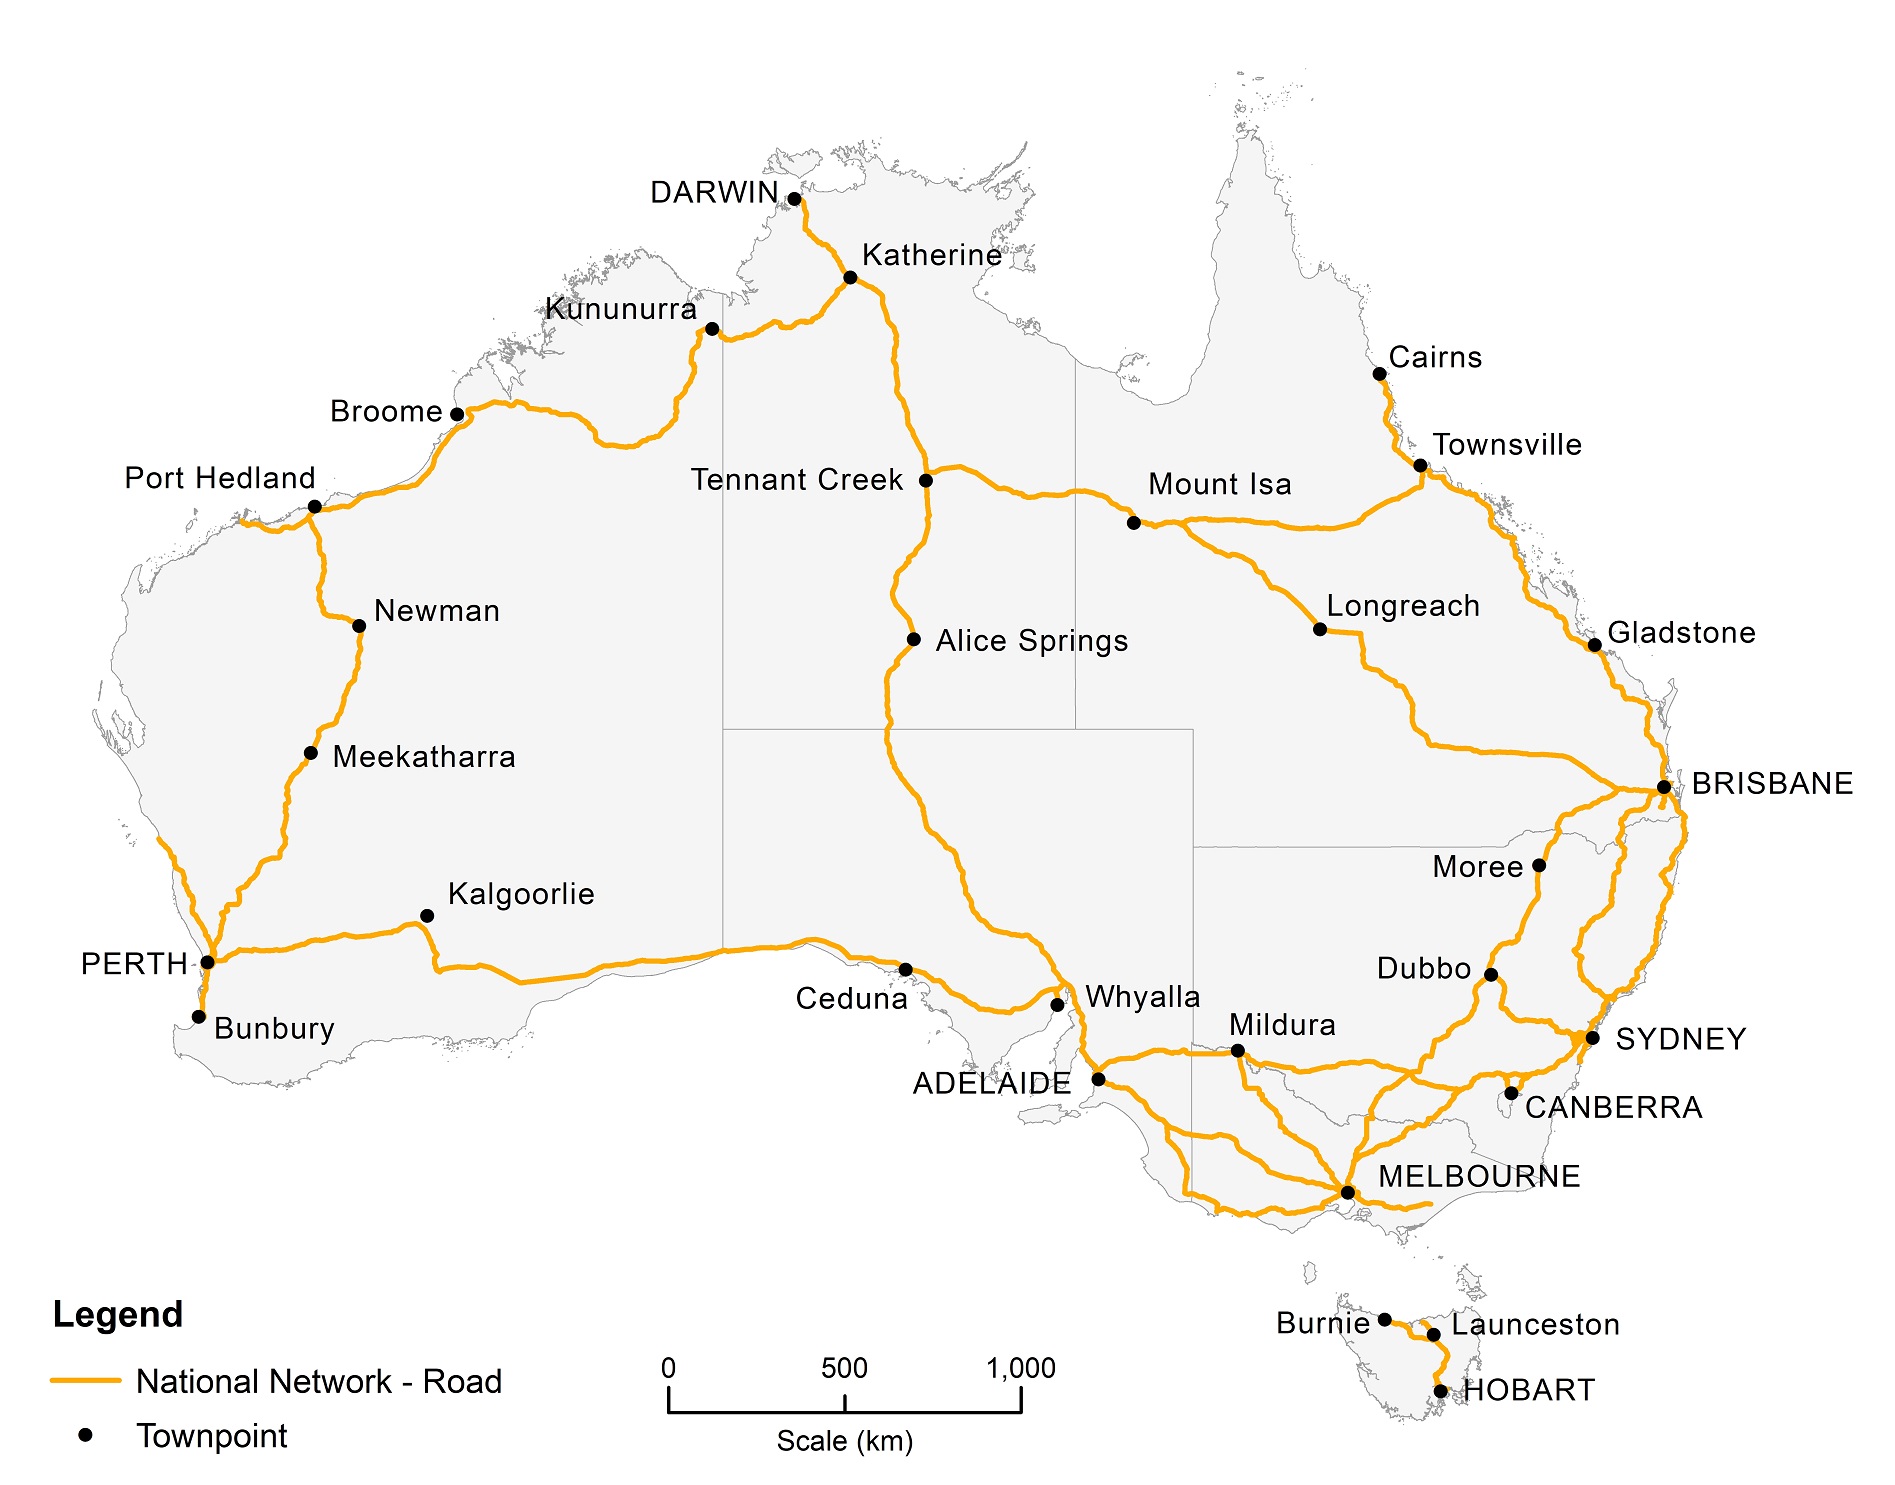
Source: DITRDCSA, 2022
Australian Infrastructure and Transport Statistics Yearbook 2025: Rail chapter
Chapter 5: Rail
- Australian Infrastructure and Transport Statistics Yearbook 2025 - Download PDF
- Rail—Yearbook 2025 (99 KB) - Download Excel file
This chapter provides information on rail expenditure, activity and network lengths. Estimates of passenger kilometres up to 2024-25 can be found in Chapter 2 - Passengers.
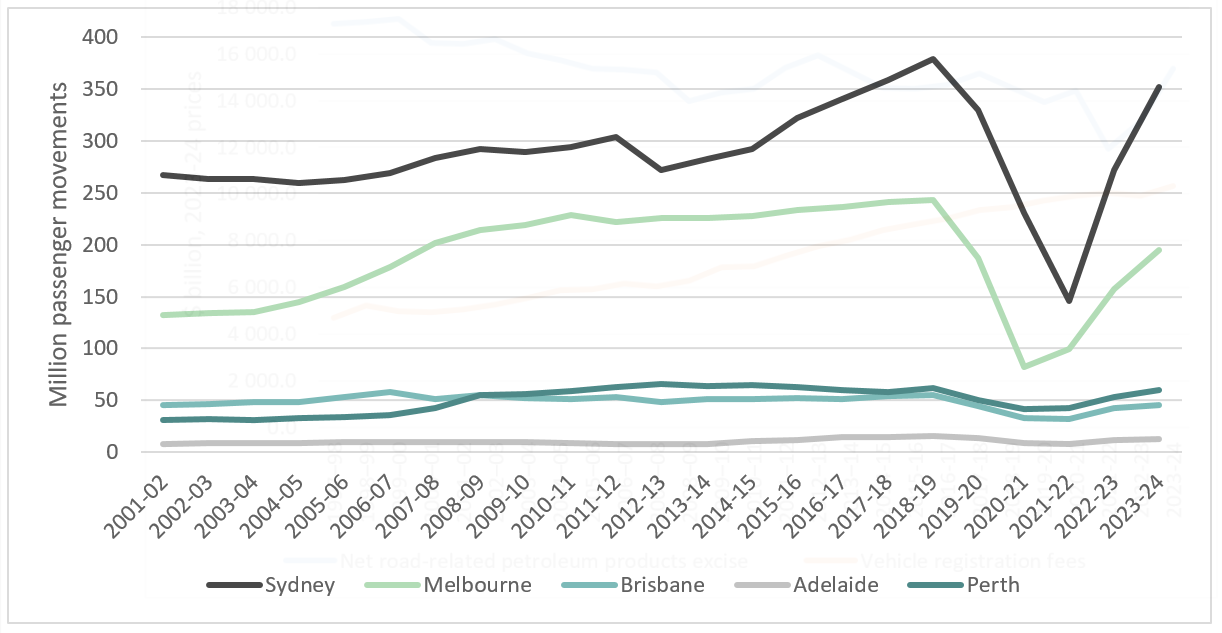
- People in Melbourne use light rail more than any other city with 155 million passengers in 2023–24.
- People in Sydney use heavy rail more than any other city with 352 million passengers in 2023–24.
- In 2023-24 there were $36 billion of public rail-related expenditure.
Figure 10 shows Australia’s network of railways by gauge and Figure 11 shows rail public transport patronage by million passenger movements. This refers to all trips on suburban rail networks and is based on reporting from train operators. Passenger movements were trending upwards in Sydney, Melbourne, Perth and Adelaide before starting to fall sharply in 2019–20 due to the COVID-19 pandemic. By 2023–24 patronage numbers had generally still not returned to 2018–19 levels.
Figure 10 Australia’s railways, by gauge
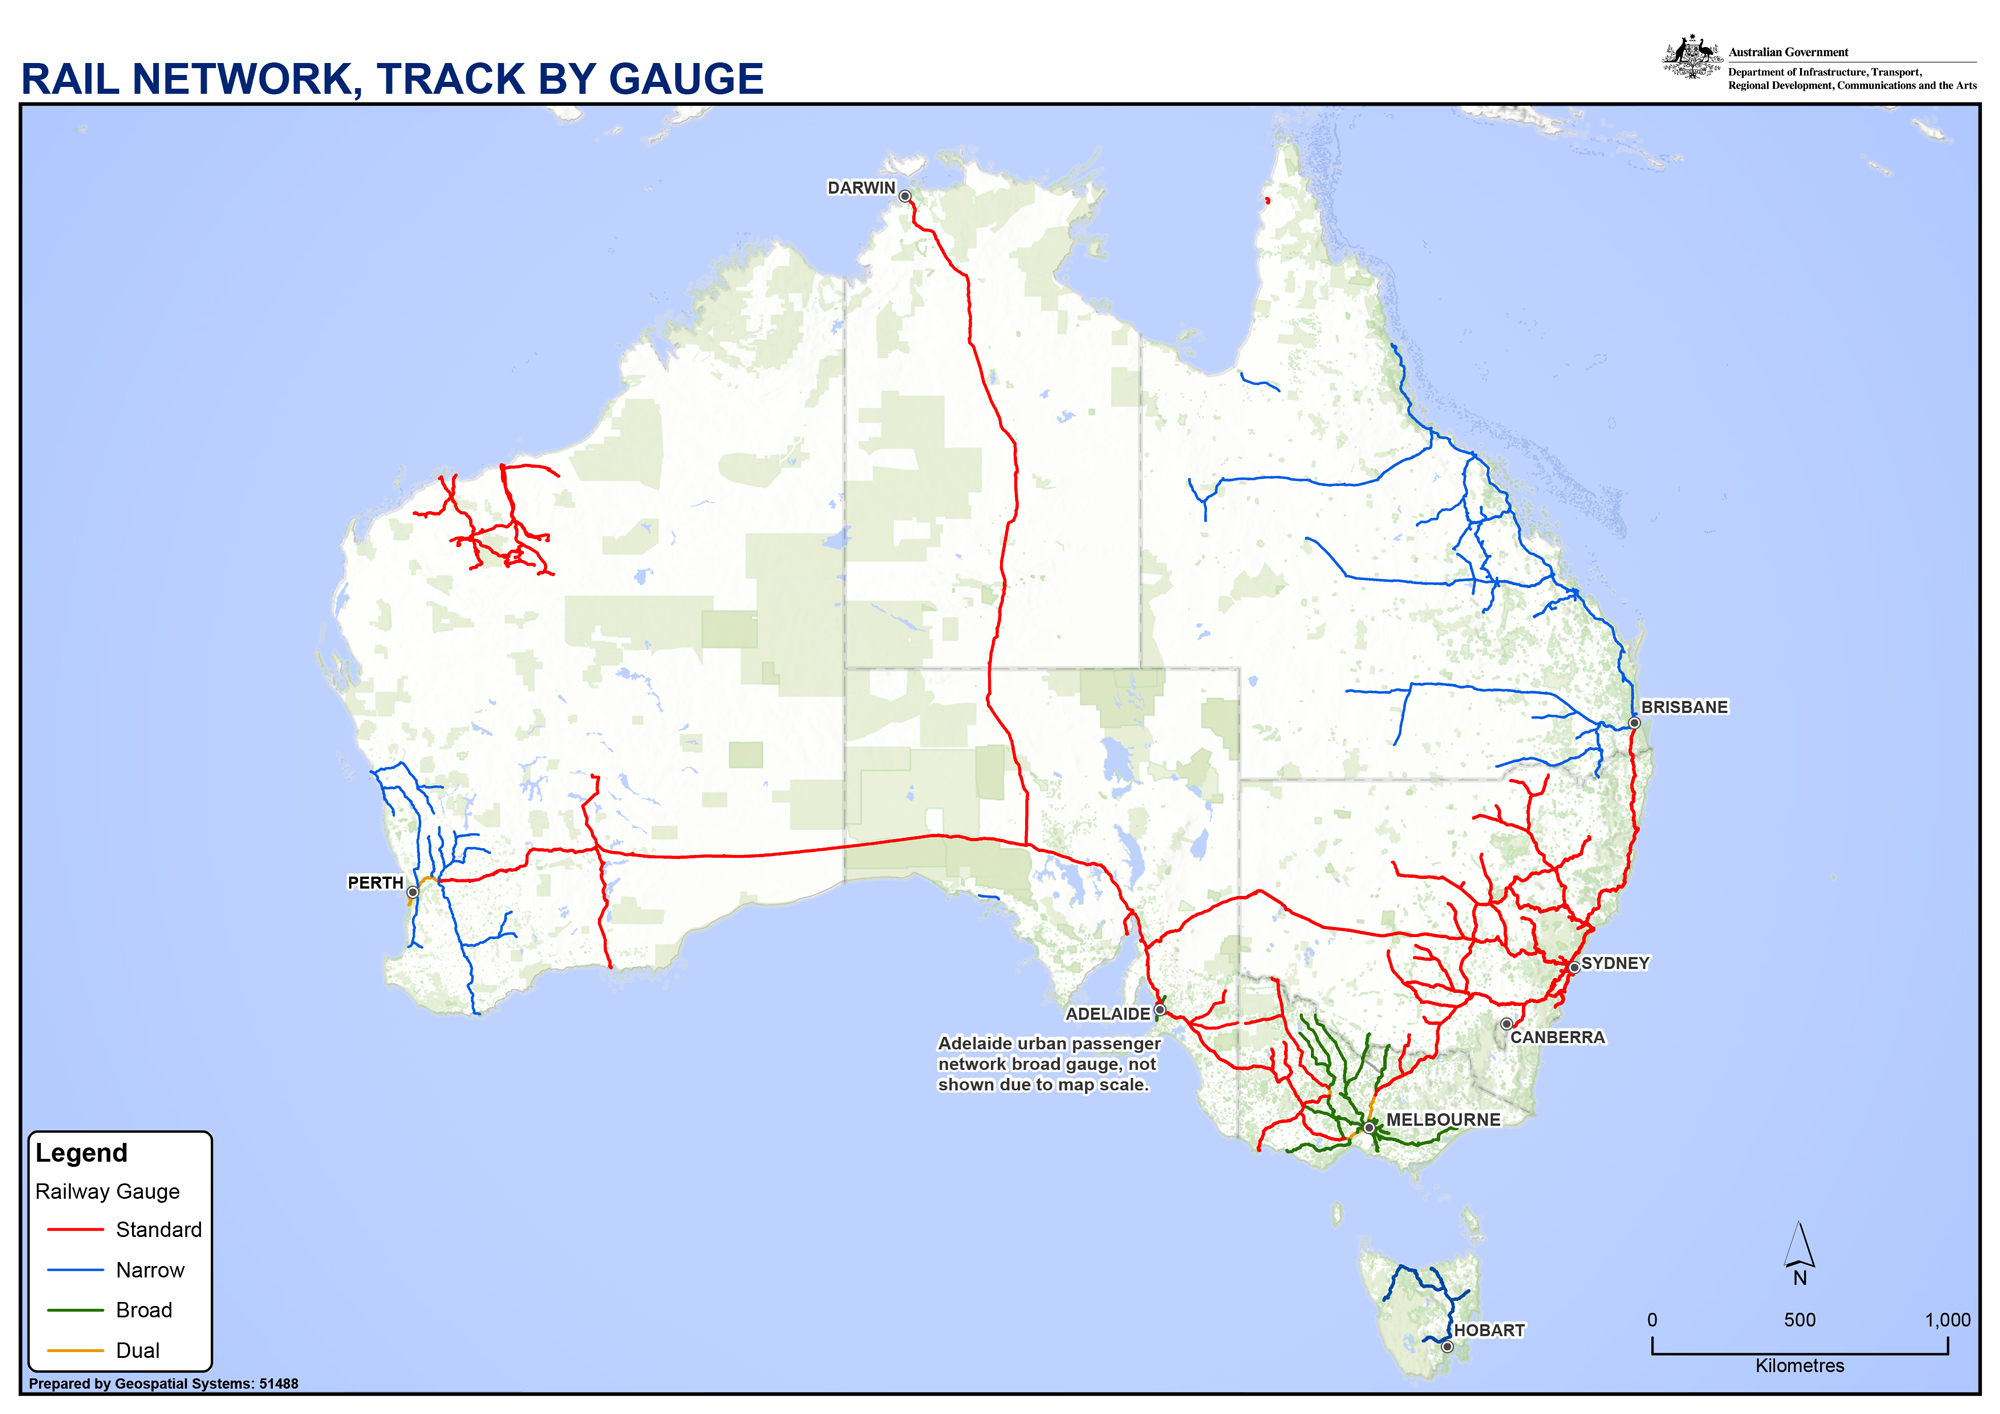
Source: BITRE (2025), Trainline 12
Figure 11 Public transit patronage on heavy rail, Australian capital city networks
Sources: BITRE (2015), Long-term trends in urban public transport
BITRE (2025), Trainline 12
Prior Trainline publications
Infrastructure construction dashboard
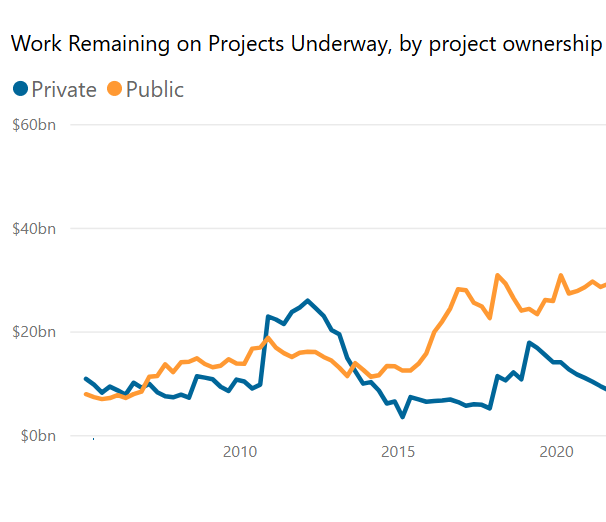
The transport infrastructure construction dashboard shows costs for projects that are underway or completed according to whether they are owned privately or publicly.
Infrastructure and the Economy
Chapter 1
This chapter provides data on the Australian economy including the value added by Australian infrastructure industries in addition to:
- employment in the transport, energy, communication and water industries
- average weekly earnings for road, rail, water and air and space industries
- price indices
- population
- 9.2 per cent of Australia’s GDP was accounted for by Australia’s major infrastructure industries in 2022-23.
- 1 million people were employed in Australia’s major infrastructure industries in August 2023.
- $1,441 is the average weekly earnings for the road transport industry in 2021.
- 84 per cent of people employed by the road transport industry identify as male.
The gross value added of major infrastructure industries as a percentage of GDP has remained relatively stable since 1974-75, generally ranging between 9-10% of GDP, with the transport postal and warehousing industry specifically ranging between 4-5% over the same timeframe. In terms of employment, although employment in the transport, postal and warehousing industry have grown in overall terms, as a percentage of total Australian employment, it has stayed at around 5% for the last 30 years.
Figure 1 Australian employment numbers in selected major infrastructure industries
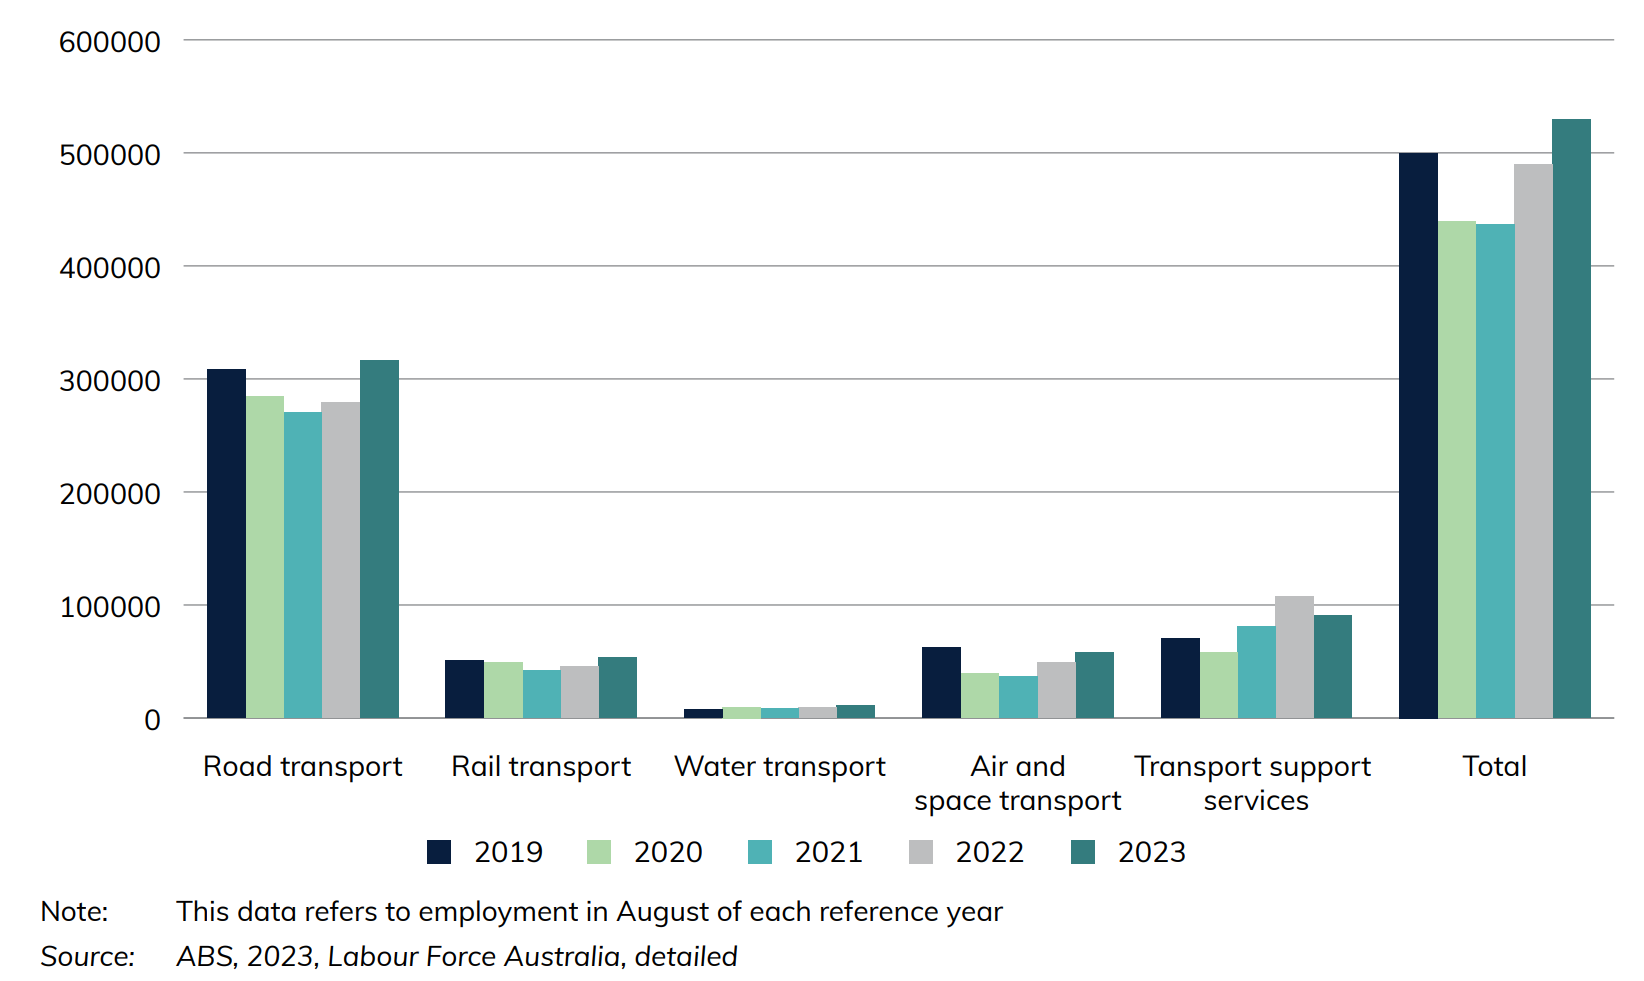
Figure 1 shows employment statistics for various transport industries as at August of each year. Although in 2021 COVID-19 had reduced Australian employment numbers in road, rail, and air and space transport industries, this year has shown signs of recovery, closing in on 2019 pre-pandemic levels.
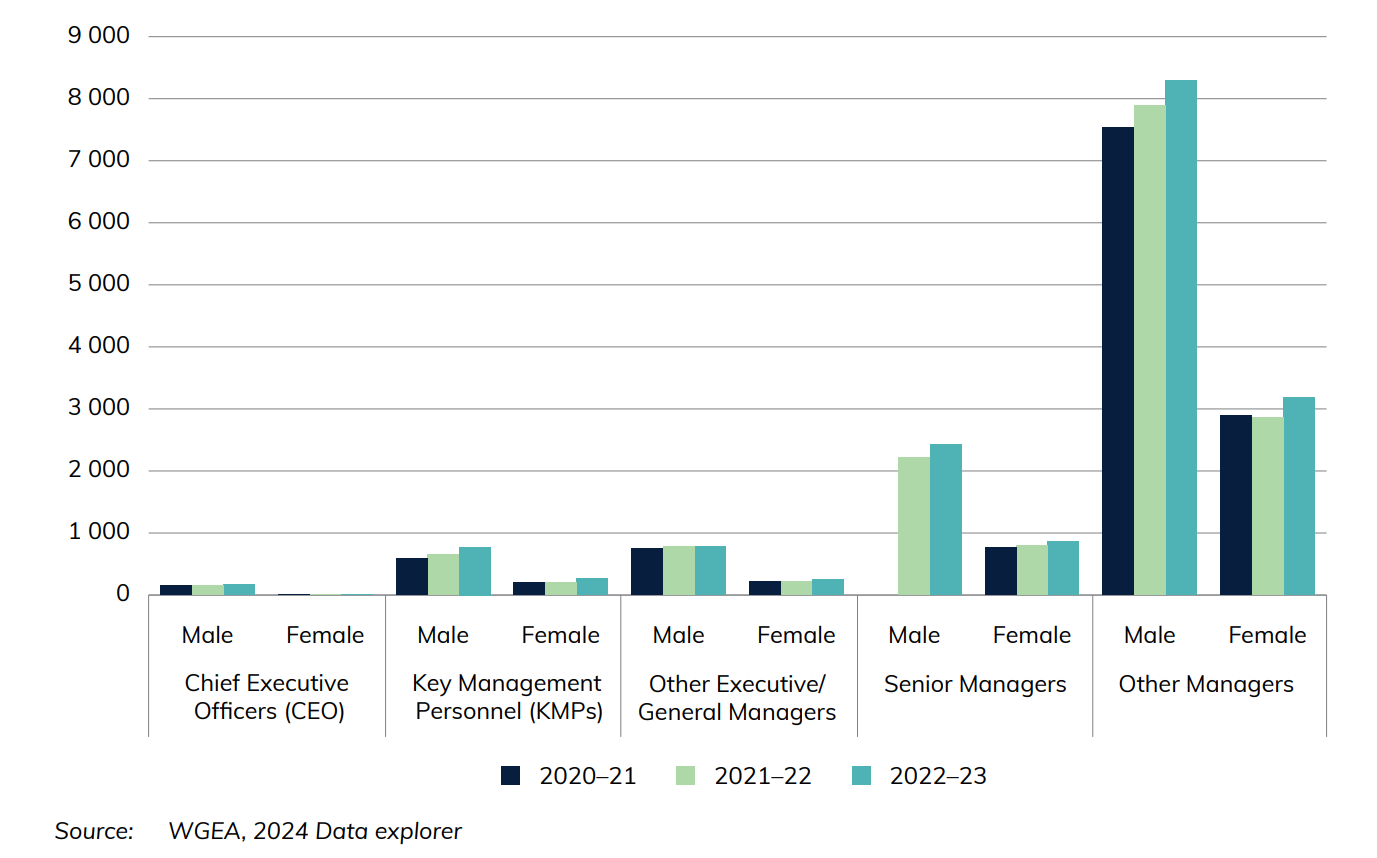
Figure 2 Leadership positions held in transport industries, by gender
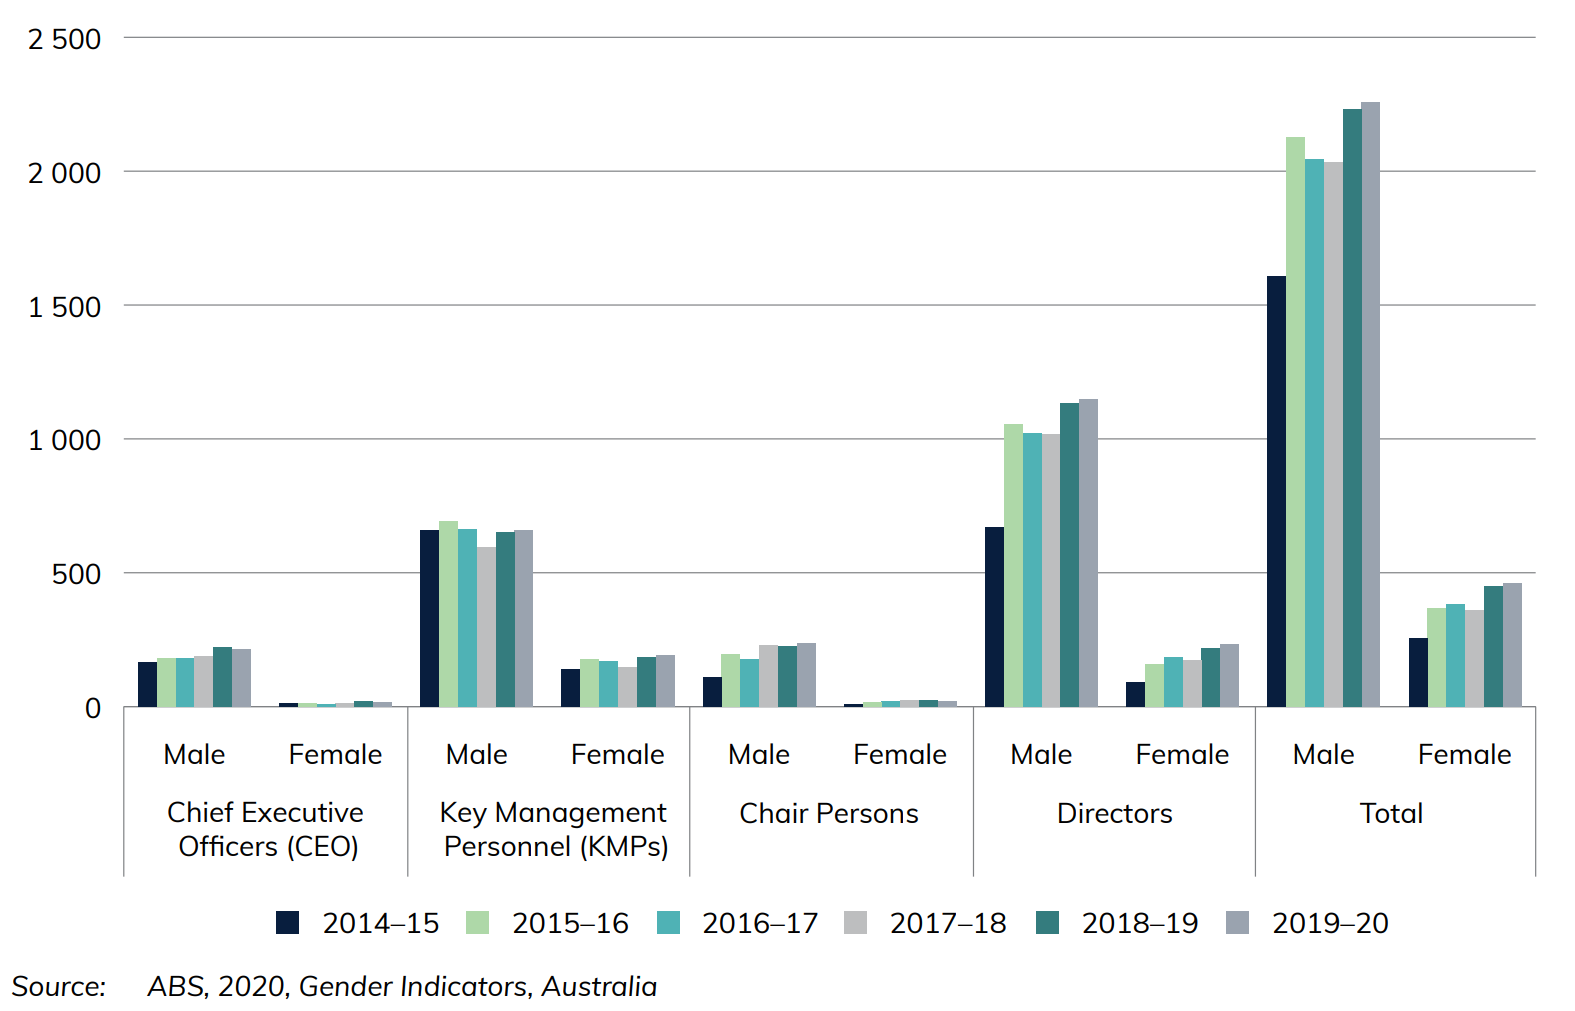
Figure 2 provides an insight into gender statistics by comparing the number of leadership positions held by men and women within the transport industry. In 2019, leadership positions in the transport industry were predominantly occupied by males, with 2258 males in Chief Executive Officer, Key Management Personnel, Chair Person and Director roles compared to 460 females.
Download data
Also see
Infrastructure Construction
Chapter 2
This chapter provides information on Australian measures of infrastructure engineering construction. These are classified as: transport (roads, rail, ports, etc), energy (electricity and gas transmission networks, etc), telecommunications networks, and water supply and distribution networks. Data is sourced from the Australian Bureau of Statistics Engineering Construction Activity, Australia publication with some adjustments, as well as the Electric Vehicle Council.
- 559 DC fast and Ultrafast public charging sites were available for Australians to charge their electric vehicles in 2023.
- Transport infrastructure engineering construction work done recorded a new all-time high of $48 billion (adjusted by chain volume index) in 2022-23. This accounted for 56 per cent of all infrastructure engineering construction work done in Australia.
Figure 1 Infrastructure construction activity adjusted by chain volume index
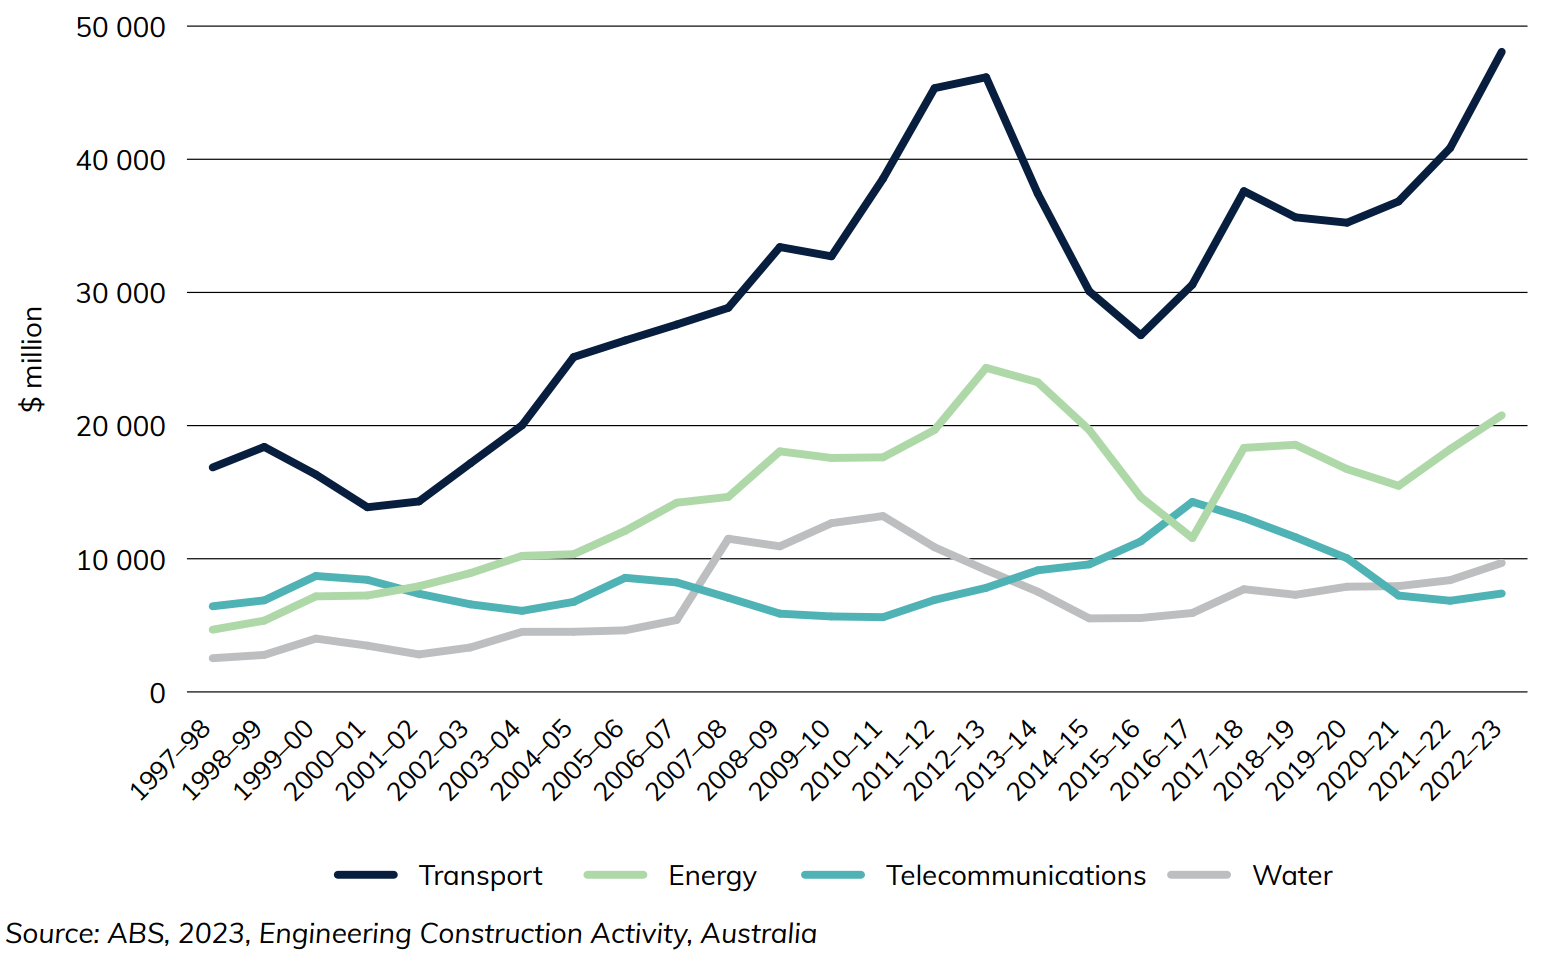
Figure 1 and Figure 2 show the change in infrastructure investment activity in Australia over time. Transport, water and energy investment increased relatively consistently until roughly 2012-13, when they each experienced a notable fall. They have recovered in recent years, however, with the Transport sector reaching its new highest point of roughly $48 billion in 2022-23 (Figure 1).
Figure 2 Infrastructure construction activity, by sector, adjusted by chain volume index
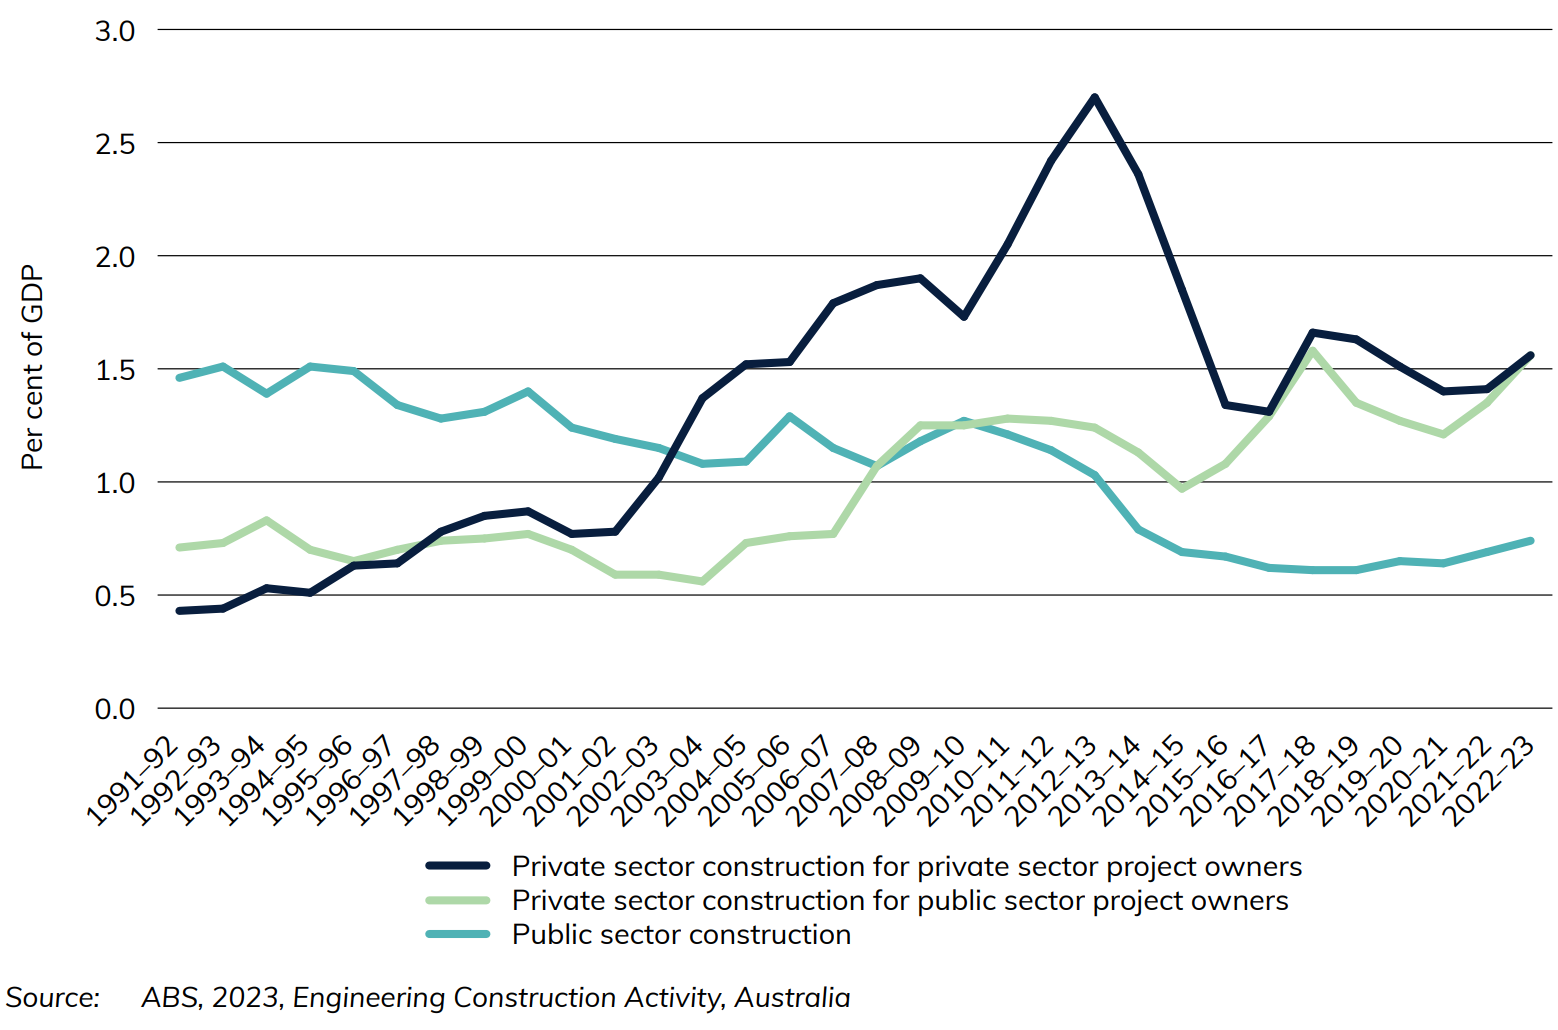
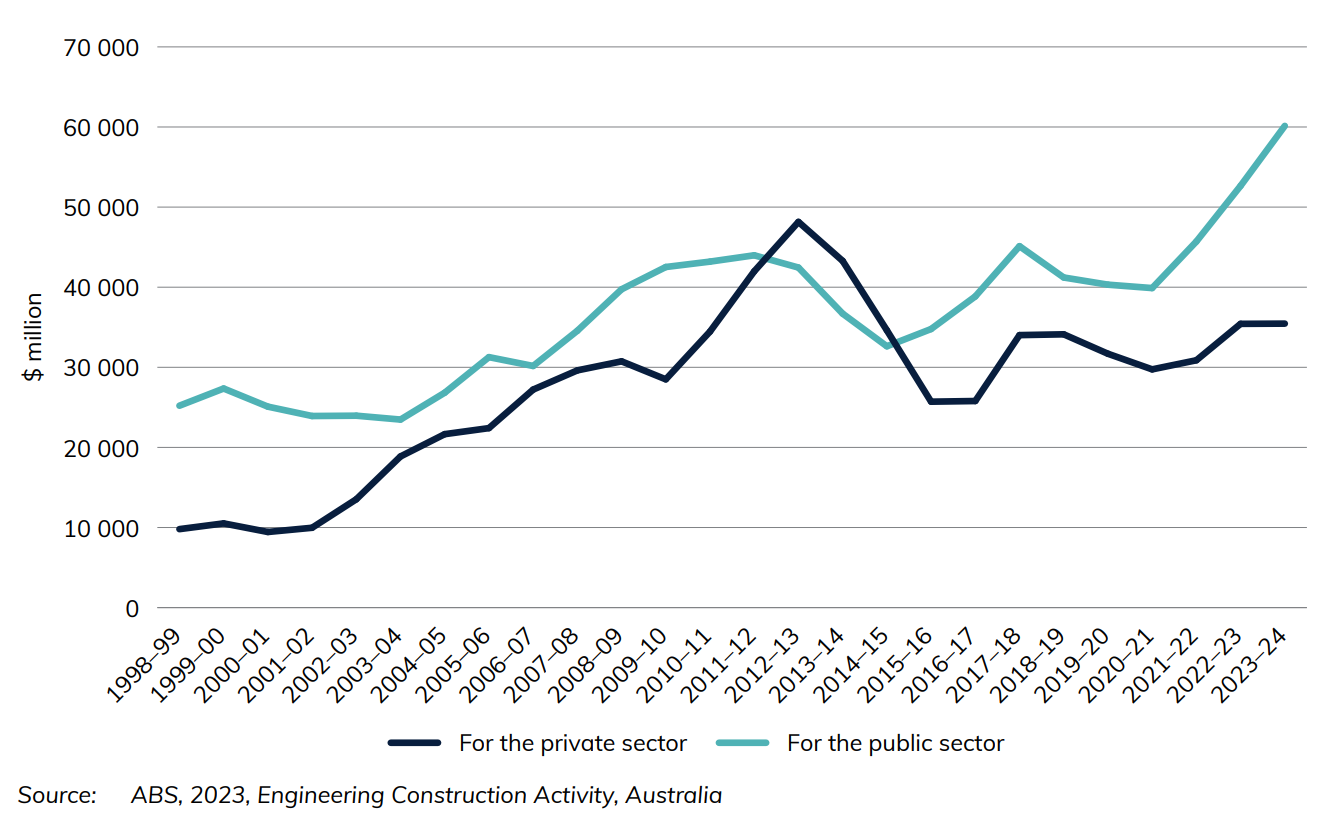
Figure 2 illustrates the private and public sector changes in Australian infrastructure expenditure as a percentage of national GDP. Both public and private sector construction activities are derived from the activity by major forms of infrastructure: transport, energy, telecommunications and water supply.
Figure 3 Value of transport infrastructure spending, adjusted by chain volume index
Download data
Also see
Infrastructure and the Economy
Chapter 1
This chapter provides data on the Australian economy including the value added by Australian infrastructure industries in addition to:
- employment in the transport and storage industry
- average weekly earnings for road, rail, water and air and space industries
- price indices
- 4.6 per cent of Australia's GDP was accounted for by Australia's transport, postal and warehousing industry in 2023-24.
- 297 thousand people were employed in the road transport industry compared to 46 thousand in the rail industry.
- $1 639 is the average weekly earnings for the road transport industry in 2023
- 83 per cent of people employed within the road transport industry identify as male.
The gross value added of transport, postal and warehousing as a percentage of GDP has remained relatively stable since 1974-75, generally ranging between 4-5% of GDP. In terms of employment, although employment in the transport, postal and warehousing industry has grown in overall terms, as a percentage of total Australian employment, it has stayed at around 5% for the last 30 years. Figure 1 shows employment statistics for various transport industries as at August of each year.
Figure 1 Australian employment numbers in selected major infrastructure industries
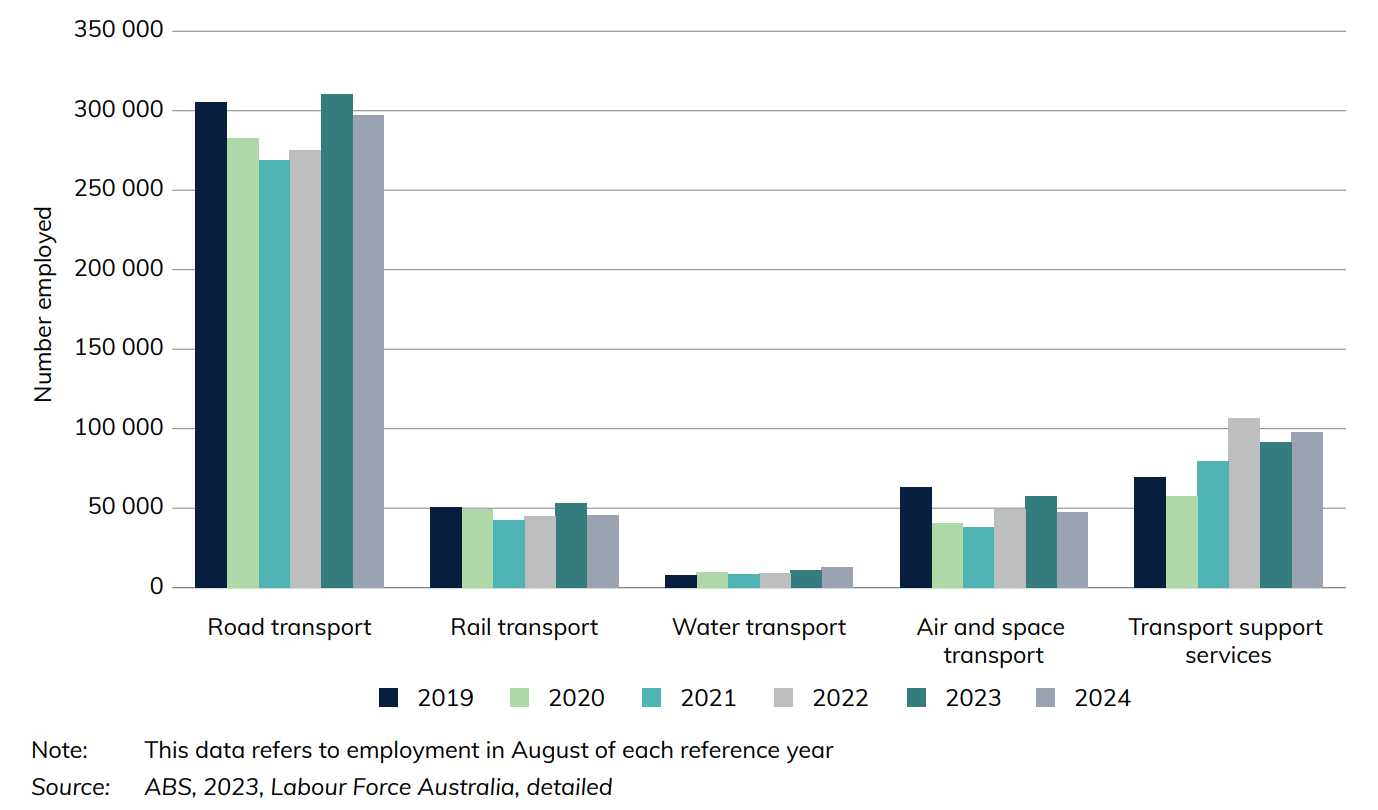
Figure 2 compares the number of leadership positions held by men and women within the transport industry for non-public sector organisations over 100 employees. In 2022-23, leadership positions in the transport industry were predominantly occupied by males, with 12,453 males in Chief Executive Officer, Key Management Personnel/Heads of Business and other managerial positions compared to 4,584 females.
Figure 2 Leadership positions held in transport industries, by gender
Download data
- Infrastructure and the Economy—Yearbook 2024 (140 KB) - Download Excel file
- Australian Infrastructure and Transport Statistics Yearbook 2024 - Download PDF
Also see
Infrastructure Construction
Chapter 2
This chapter provides information on Australian measures of infrastructure engineering construction. These are classified as: transport (roads, rail, harbours, etc), energy (electricity and gas transmission networks, etcetera), telecommunications networks, and water supply and distribution networks. Data is sourced from the Australian Bureau of Statistics, Engineering Construction Activity, Australia publication.
- Transport infrastructure engineering construction work done recorded a new all-time high of $51 billion (adjusted by chain volume index) in 2023–24. This accounted for 53 per cent of the value of infrastructure construction work done in Australia (including transport, energy, telecommunications and water).
- In 2023–24, the value of road engineering construction work done was:
- $33 billion on roads and bridges
- $16 billion on railways
- $1.5 billion on harbours.
Figure 3 and Figure 4 show the change in infrastructure investment activity in Australia over time. Transport, water and energy investment increased relatively consistently until roughly 2012–13, when they each experienced a notable fall. They have recovered in recent years, however, with the Transport sector reaching its new highest point of roughly $51 billion in 2023–24 (Figure 3).
Figure 3 Infrastructure construction activity, adjusted by chain volume index
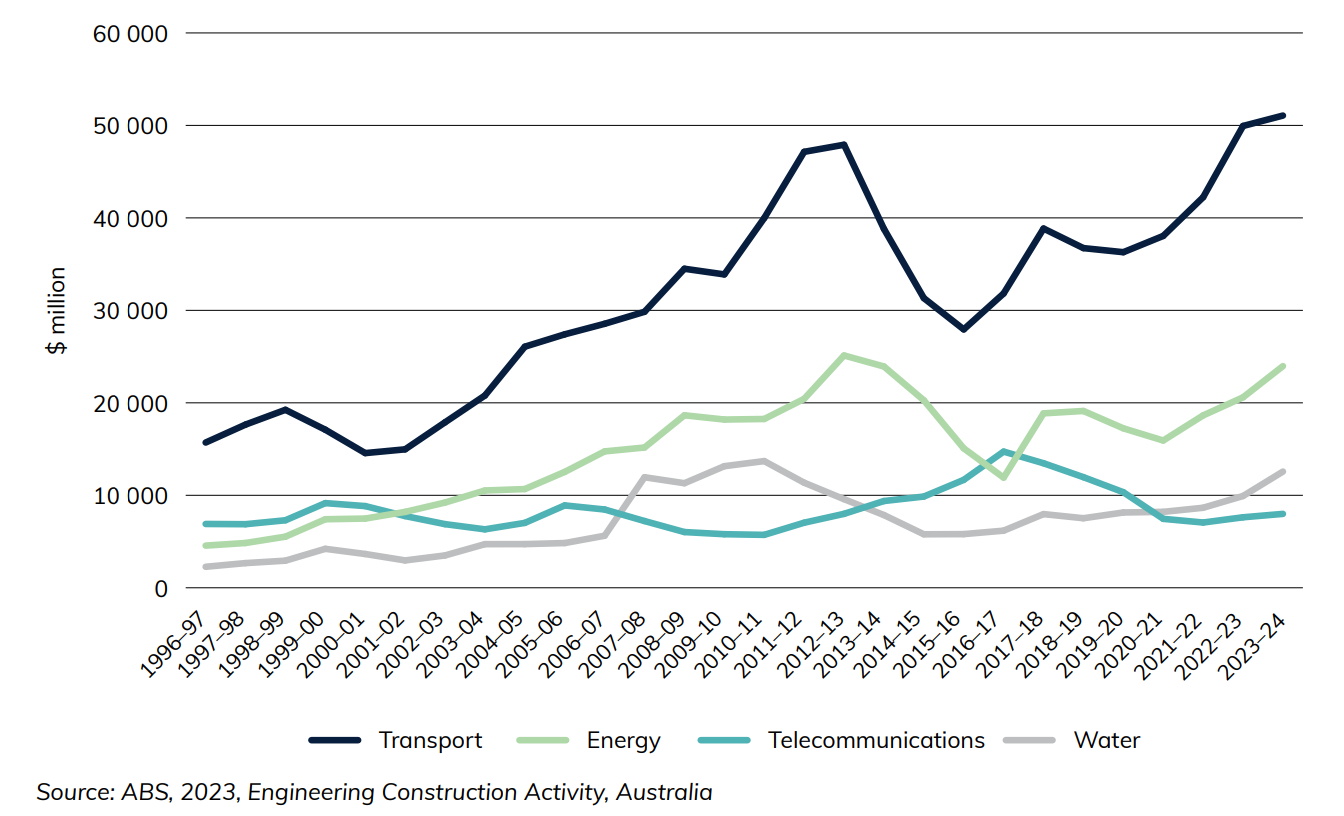
Figure 4 shows the value of engineering Construction activity on different modes of transport. Both road (including bridges) ($33 billion) and railways ($16 billion) have recorded record highs two years in a row.
Figure 4 Infrastructure construction activity, by sector, adjusted by chain volume index
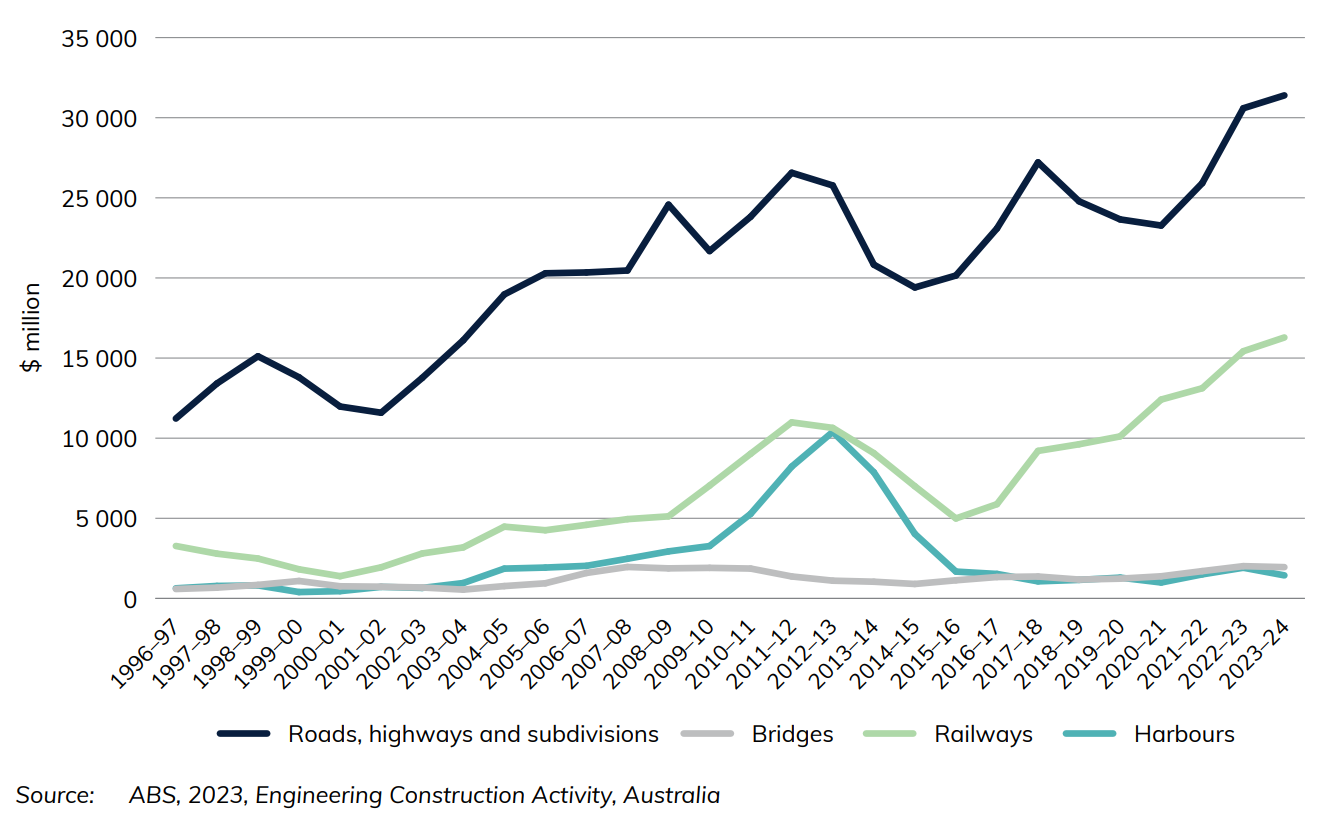
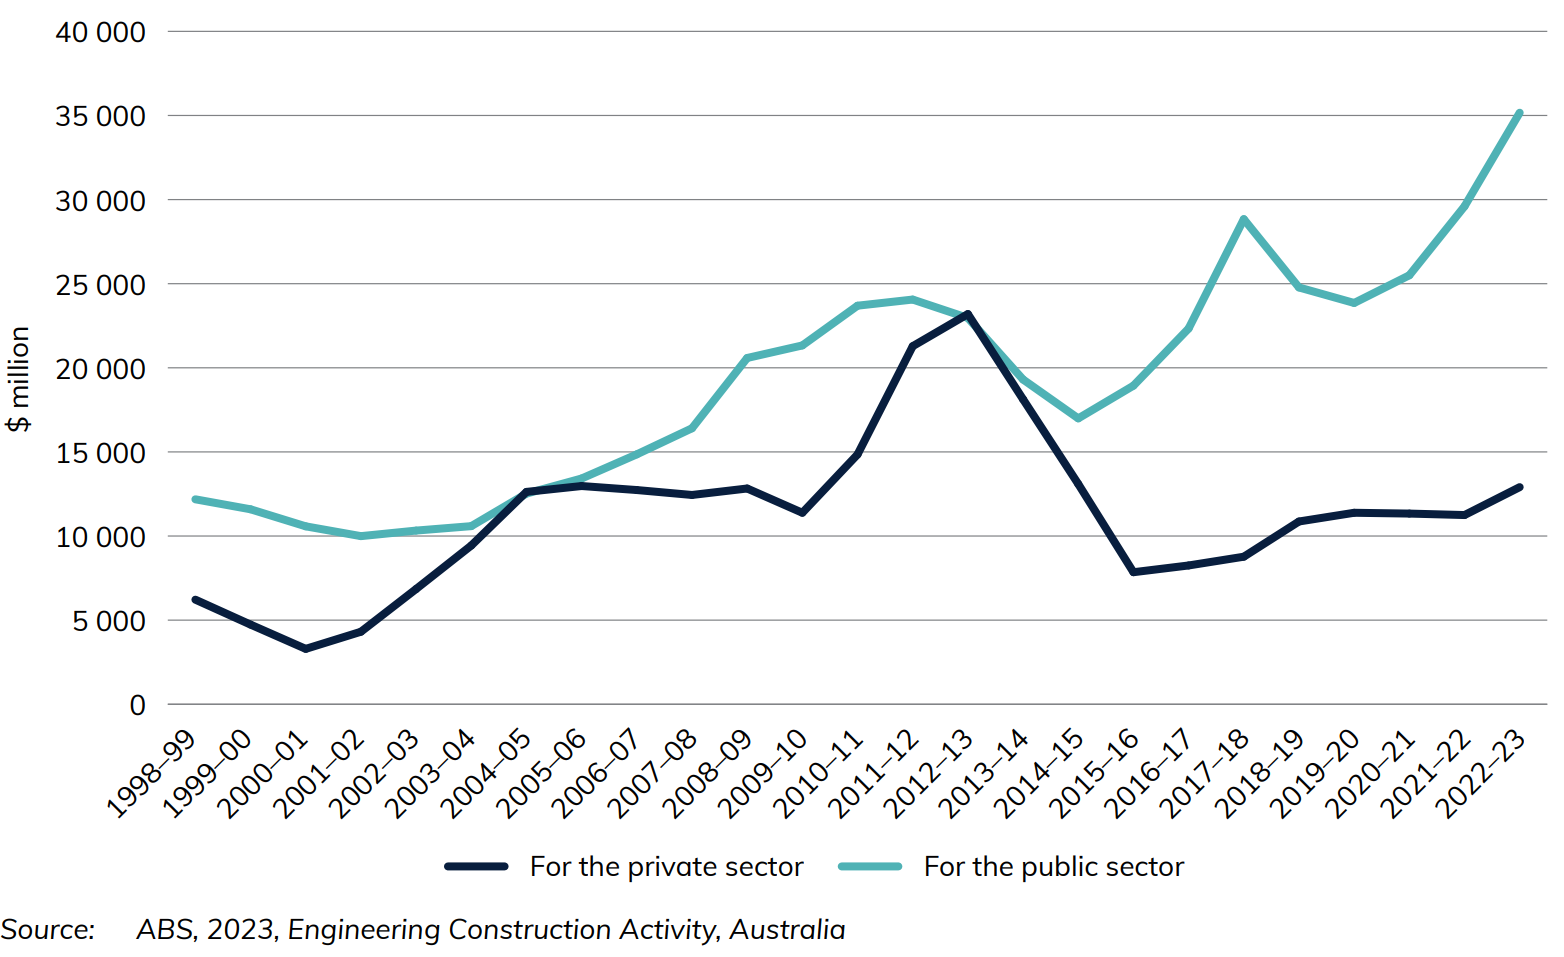
Figure 5 illustrates the private and public sector changes in Australian infrastructure expenditure.
Figure 5 Infrastructure construction activity, by sector, adjusted by chain volume index
Download data
- Infrastructure Construction—Yearbook 2024 (109 KB) - Download Excel file
- Australian Infrastructure and Transport Statistics—Yearbook 2024 - Download PDF
Also see
Infrastructure and the Economy
Chapter 10
- Infrastructure and the Economy—Yearbook 2025 (113 KB) - Download Excel file
- Australian Infrastructure and Transport Statistics Yearbook 2025 - Download PDF
This chapter provides data on the Australian economy, including the gross value added and employment in the transport and storage industry.
- 4.5 per cent of Australia’s GDP was accounted for by Australia’s transport, postal and warehousing industry in 2024-25.
- 273 thousand people were employed in the road transport industry compared to 47 thousand in the rail industry.
- 80 per cent of people employed by the road transport industry identify as male.
The gross value added of transport, postal and warehousing as a percentage of GDP has remained relatively stable since 1974–75, generally ranging between 4-5% of GDP. In terms of employment, although employment in the transport, postal and warehousing industry has grown in overall terms, as a percentage of total Australian employment, it has stayed at around 5% for the last 30 years.
Figure 18 shows employment statistics for various transport industries as at August of each year.
Figure 18 Australian employment numbers in selected major infrastructure industries
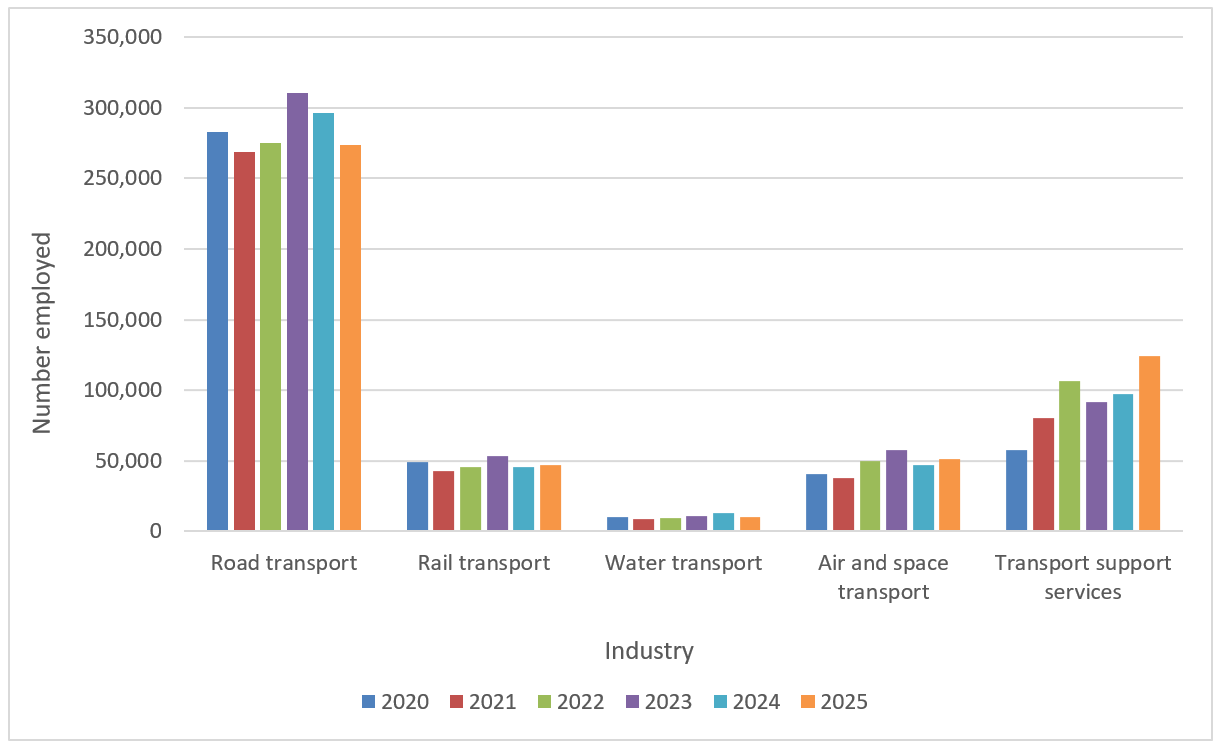
Note: This data refers to employment in August of each reference year.
Source: ABS (2025), Labour Force Australia, detailed, Canberra
Figure 19 shows employment in the road and rail industries by gender from 2023 to 2025. In 2025, there were around 230 thousand male employees compared with fewer than 50 thousand female employees. In contrast, the rail industry has a smaller workforce overall, but displays a somewhat more balanced distribution. Male employment in rail industry is consistently higher than the female employment, though the gap is narrower than in the road transport sector. Over the past three years both road and rail workforces have been declining.
Figure 19 Employment in road and rail industries, by gender
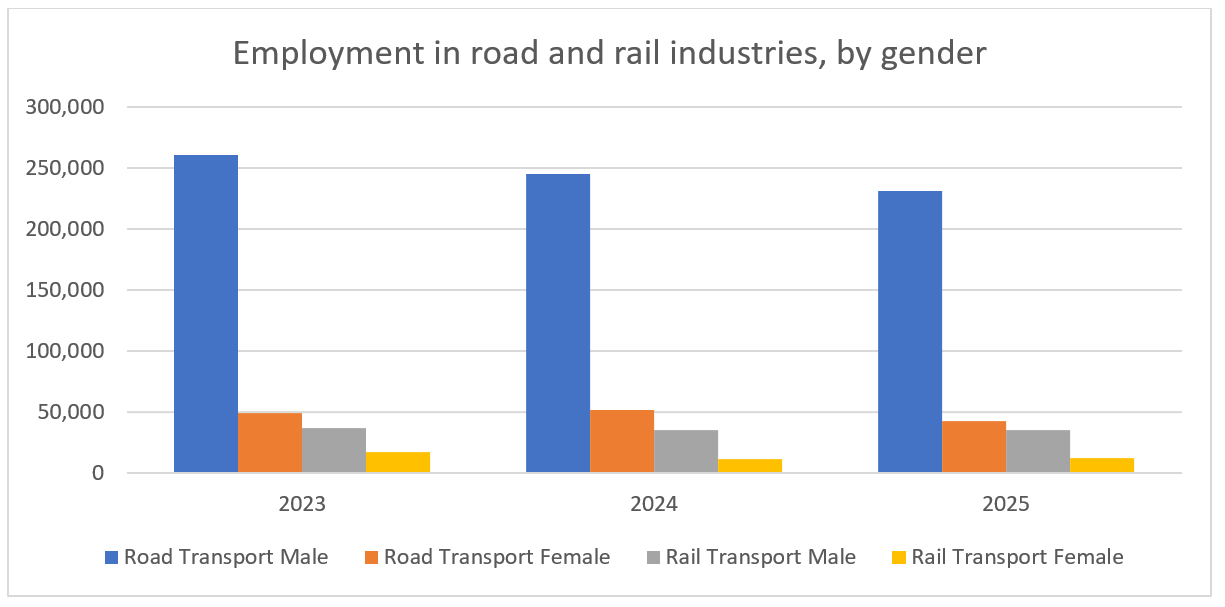
Source: ABS (2025), Labour Force Australia, detailed, Canberra
Infrastructure Construction
Chapter 11
This chapter provides information on Australian measures of infrastructure engineering construction work done for public and private sectors. These are classified as: transport (roads, rail, harbours, etc), energy (electricity and gas transmission networks, etc), telecommunications networks, and water supply and distribution networks. Data is sourced from the Australian Bureau of Statistics, Engineering Construction Activity, Australia publication.
- Transport infrastructure engineering construction work was $52 billion (adjusted by chain volume index) in 2024-25. This accounted for 49 per cent of the value of infrastructure construction work done in Australia (including transport, energy, telecommunications and water).
- In 2024-25, the value of transport engineering construction work done was:
- $34 billion on roads and bridges
- $16 billion on railways
- $1.9 billion on harbours.
Figure 20 and Figure 21 show the change in infrastructure investment activity in Australia over time. Transport, water and energy investment increased relatively consistently until roughly 2012-13, when they each experienced a notable fall. They have recovered in recent years, however, with the Transport sector reaching its highest point of $54 billion in 2023-24 (Figure 20).
Figure 20 Infrastructure construction activity, adjusted by chain volume index
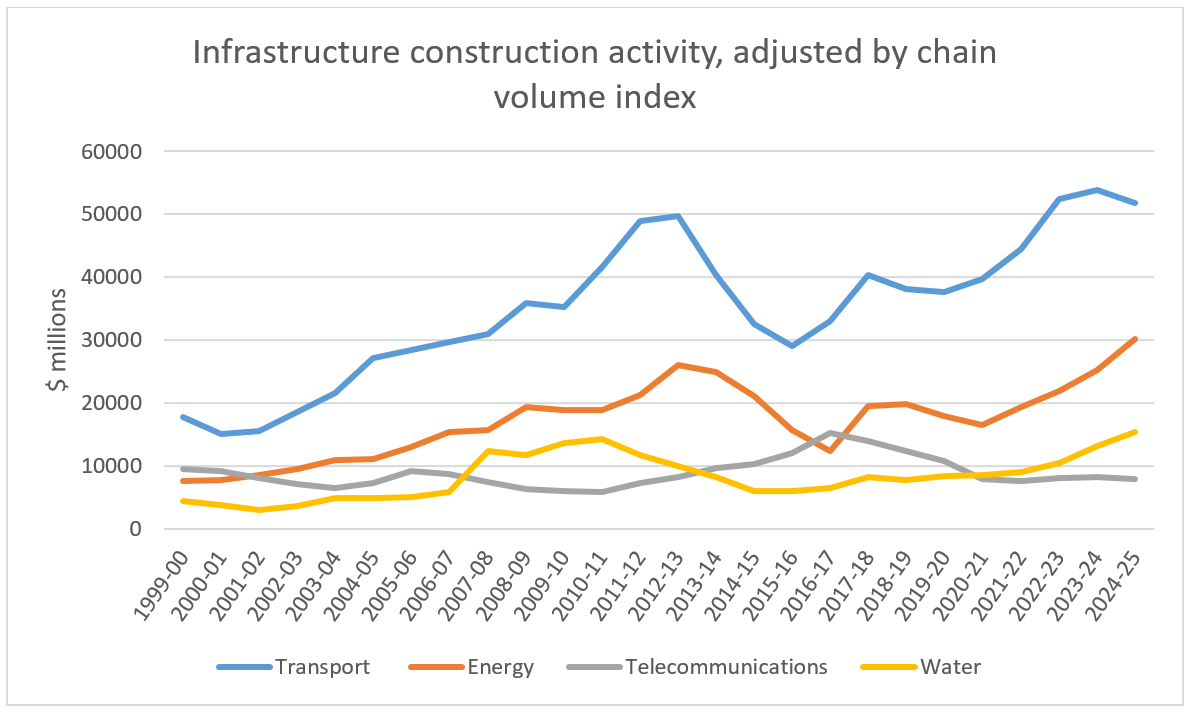
Source: ABS (2025), Engineering Construction Activity, Australia
Figure 21 shows the value of engineering Construction activity on different modes of transport. In 2024-25, both road and rail values dropped slightly after record highs in 2023-24 (at $33 billion for road and $17 billion for rail).
Figure 21 Transport construction activity, adjusted by chain volume index
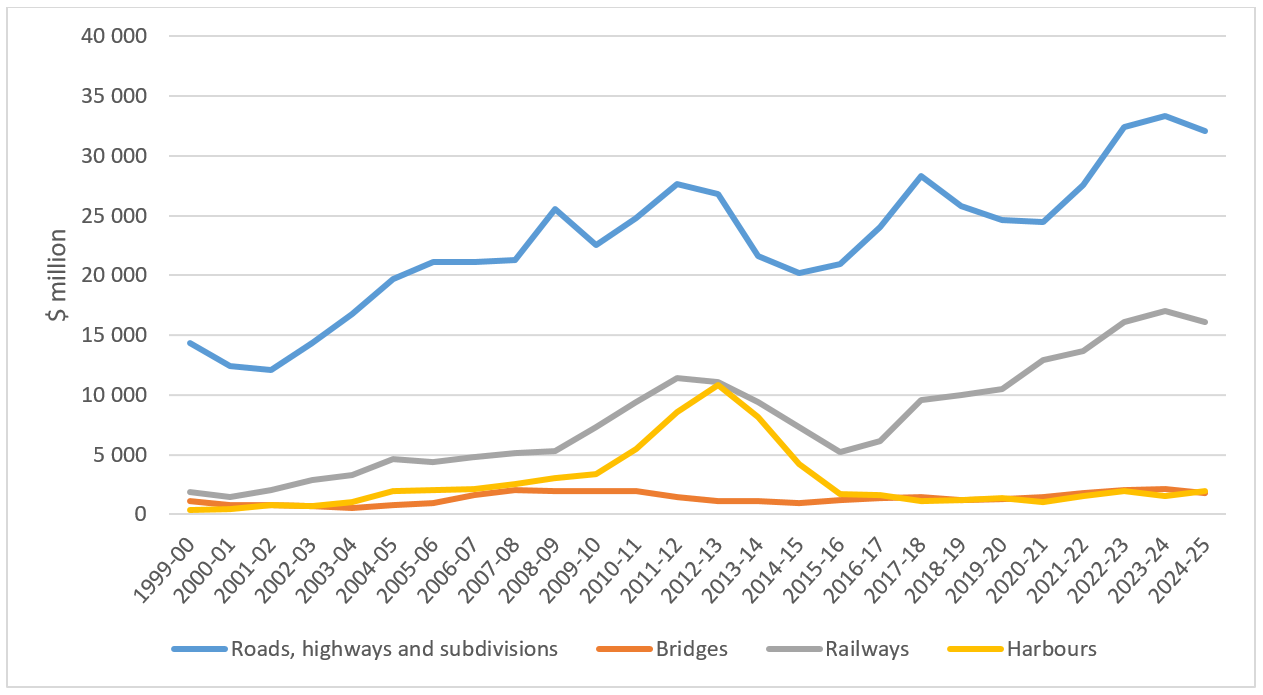
Source: ABS (2025), Engineering Construction Activity, Australia
Figure 22 illustrates the private and public sector changes in Australian infrastructure expenditure.
Figure 22 Value of infrastructure engineering construction work done, by sector, adjusted by chain volume index
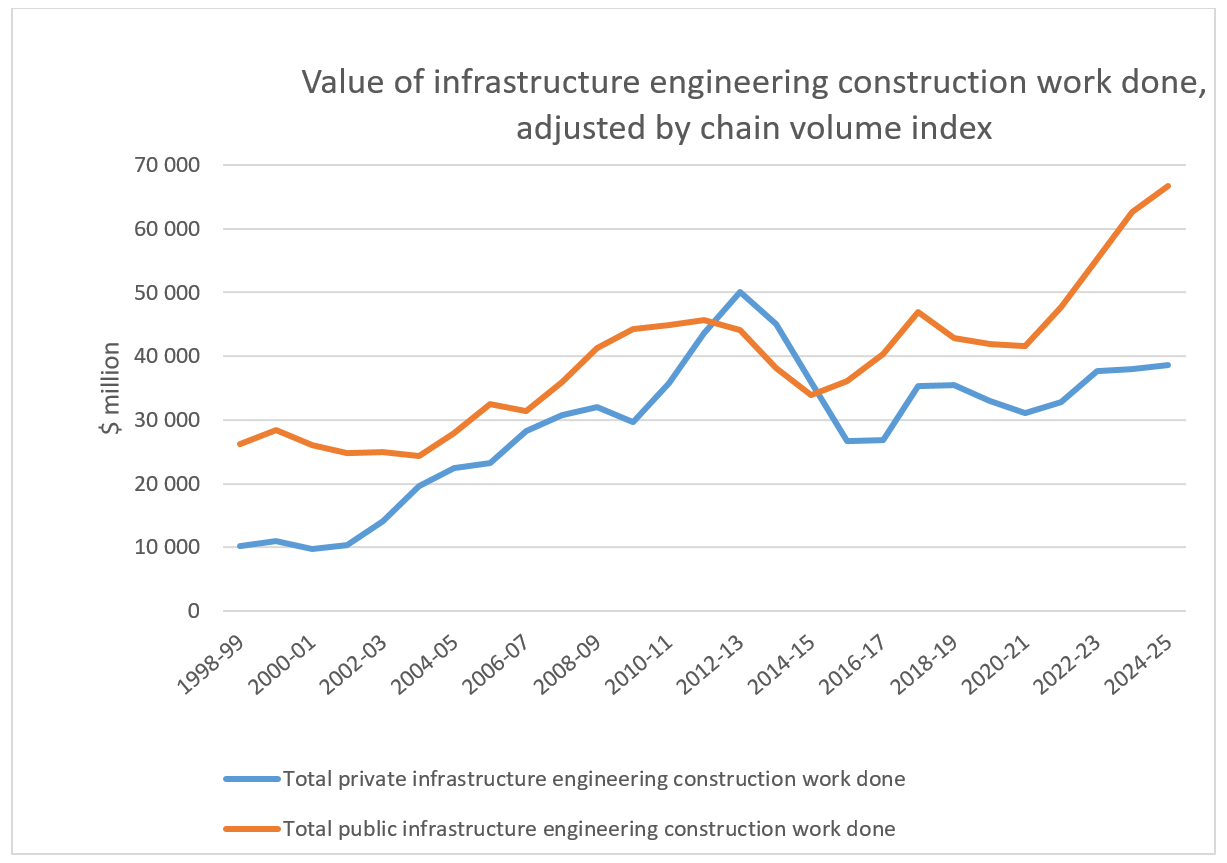
Source: ABS (2025), Engineering Construction Activity, Australia
Download data
- Infrastructure Construction—Yearbook 2025 (115 KB) - Download Excel file
- Australian Infrastructure and Transport Statistics Yearbook 2025 - Download PDF
Also see
Australian Infrastructure and Transport Statistics—Yearbook 2025
The aim of the Australian Infrastructure Statistics and Transport Yearbook is to provide a single, comprehensive annual source of infrastructure statistics for use by policymakers, industry, transport analysts and the wider Australian community. You can download the PDF or data files:
- Australian Infrastructure and Transport Statistics—Yearbook 2025 (PDF 9.3 MB)
- Australian Infrastructure and Transport Statistics—Yearbook 2025 data (ZIP: 1.4 MB)
For a summary of each chapter select from the list below: