
Freight
Chapter 1
- Australian Infrastructure and Transport Statistics Yearbook 2025 - Download PDF
- Freight—Yearbook 2025 (128 KB) - Download Excel file
Freight transport activity (Figures 1 and 2) is measured in terms of tonne kilometres (the number of tonnes moved by a vehicle multiplied by the distance the load travelled in kilometres). The Australian domestic freight task has experienced strong growth over the last 40 years, with road and rail freight now dominating domestic freight activity.
During the COVID-19 pandemic, the total bulk and non-bulk freight task fell slightly, from 780 billion tonne kilometres in 2018–19 to 760 billion tonne kilometres in 2020–21. It has grown over the last three years and is estimated to have reached its highest point in 2024–25 at 786 billion tonne kilometres.
- Melbourne had the most metropolitan road freight estimated at 18.2 billion tonne kilometres in 2024–25.
- NSW’s estimated road freight for 2024–25 was the highest on record at 87.6 billion tonne kilometres.
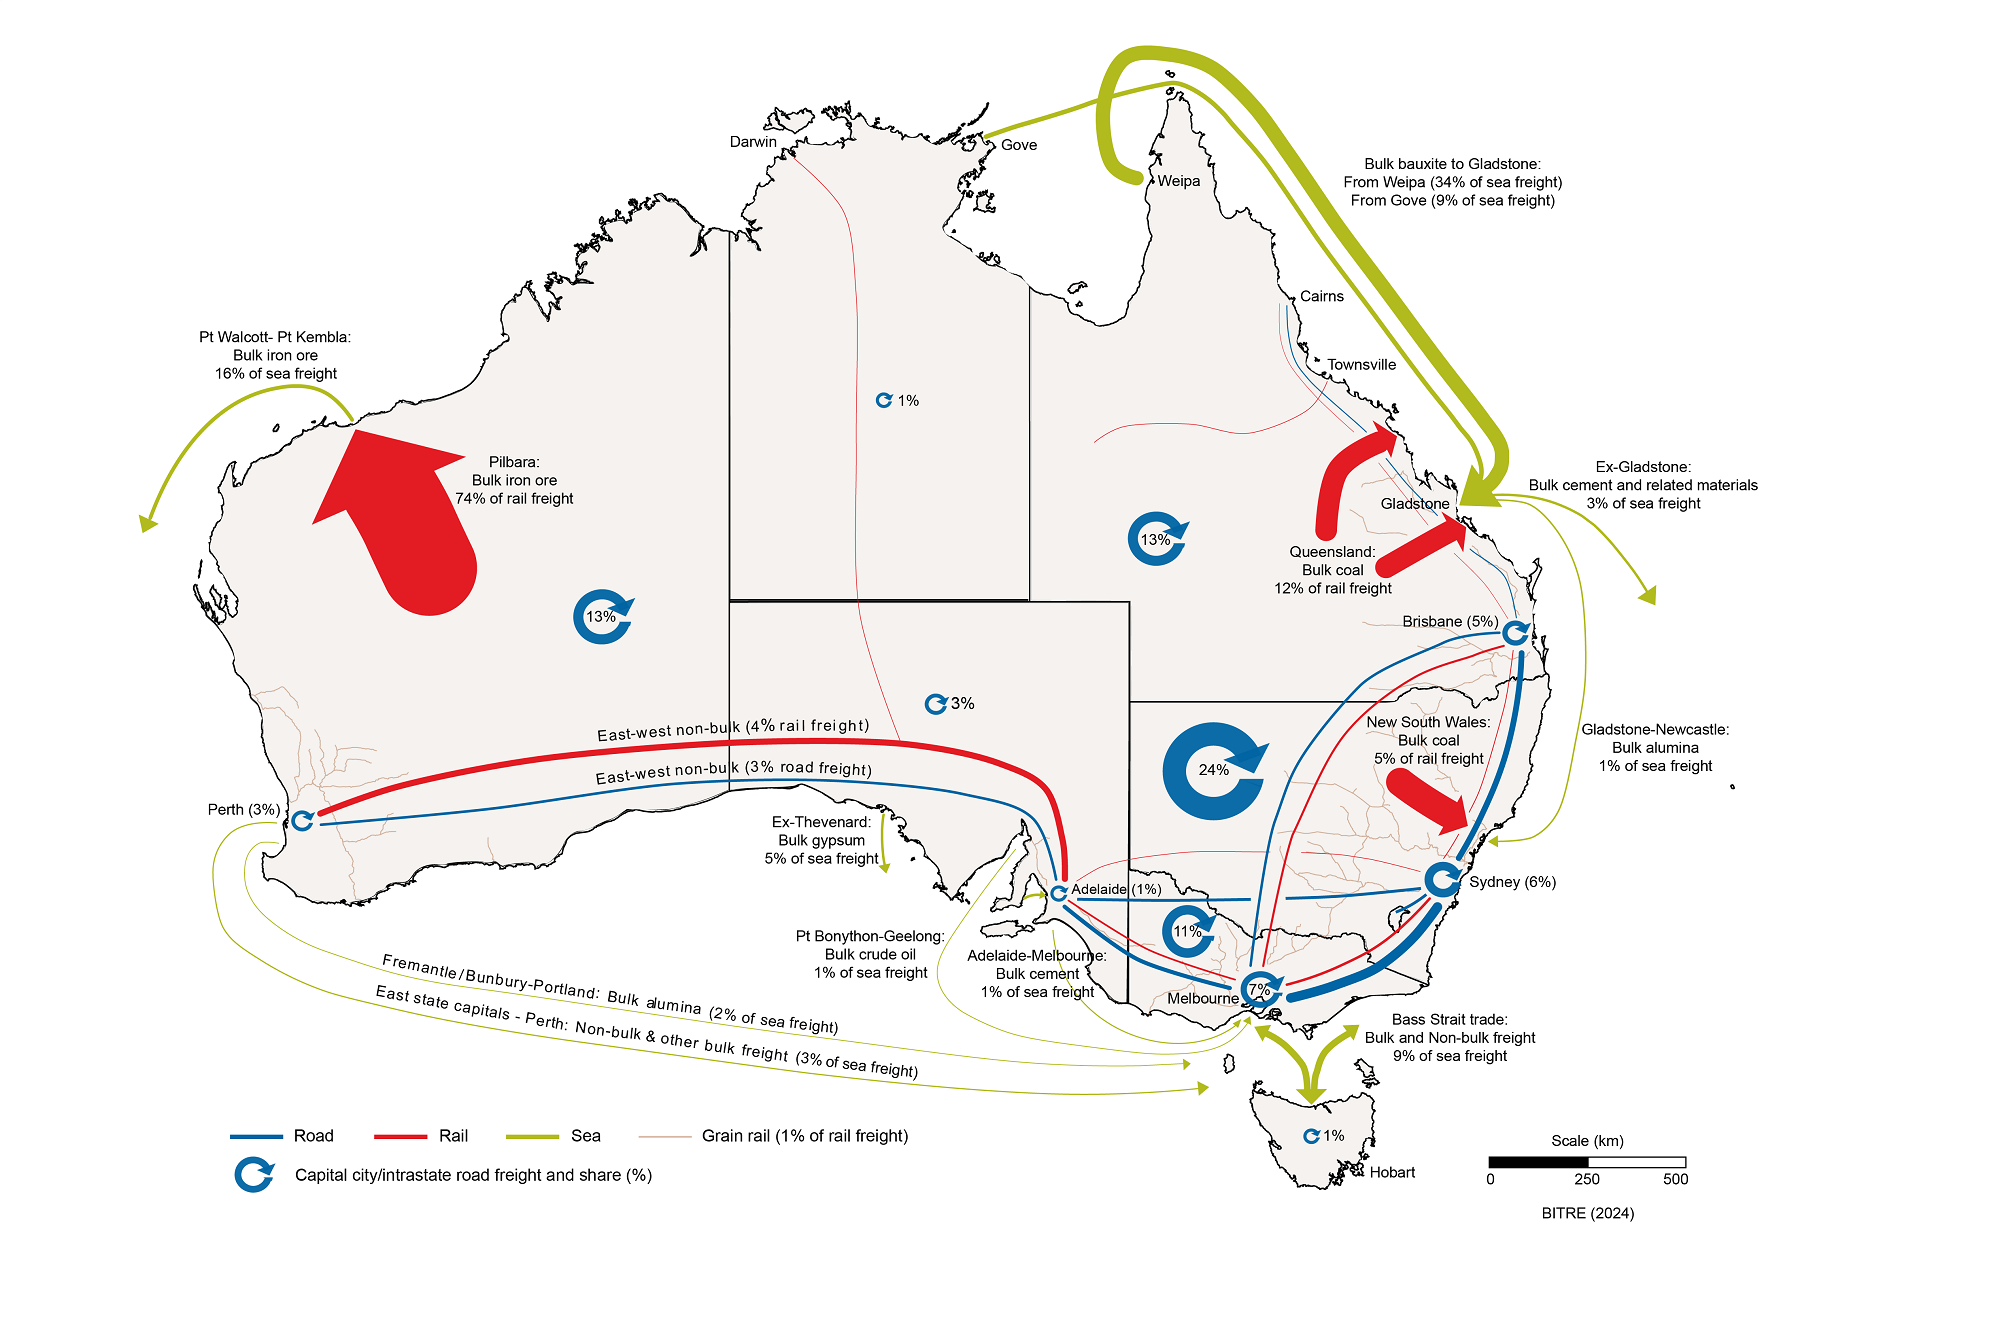
Figure 1 shows a map of Australia's major domestic freight flows by transport mode (based on 2023–24 figures). Line and arrow thickness indicate the volume of freight carried on each route, not the value of freight or performance of supply chains. The map shows that the highest volume domestic freight route is iron ore transported by rail in the Pilbara region. This next largest individual flow is coal carried by rail in Central Queensland and the Hunter Valley, followed by bauxite shipped from Weipa and Gove to Gladstone.
Figure 1 Australian Freight Flows Map
Sources:
ABARES (2024), Agricultural Commodity Statistics, March 2024, ABARES, Canberra.
ABS (2002), Freight Movements, Australia, Summary, Mar 2001 (Reissue), Catalogue no. 9220.0, ABS, Canberra.
ABS (2015), Freight Movements Australia, 12 Months ended 31 October 2014, Catalogue no. 9223.0, ABS, Canberra.
BITRE (2022), Australia interstate, intrastate and capital city road freight forecasts - 2022 update, Research Report 155, BITRE, Canberra.
BITRE (2023), Australian Infrastructure and Transport Statistics Yearbook 2023, BITRE, Canberra.
BITRE (2024), BITRE estimates, BITRE, Canberra.
BITRE, Australian Sea Freight 2023–24, Statistical Report, BITRE, Canberra ACT.
DISER (2024), Resources and Energy Quarterly, December 2023, Office of the Chief Economist, Department of Industry, Science and Resources, Canberra.
DITRDCA (2024), Coastal Trading Licensing System (unpublished data), Canberra ACT.
NFDH (2024), Freight Train Movement Data from ARTC, National Freight Data Hub, Canberra.
Qld DoR (2024), Coal production data, September 2023, Queensland Department of Resources, Brisbane.
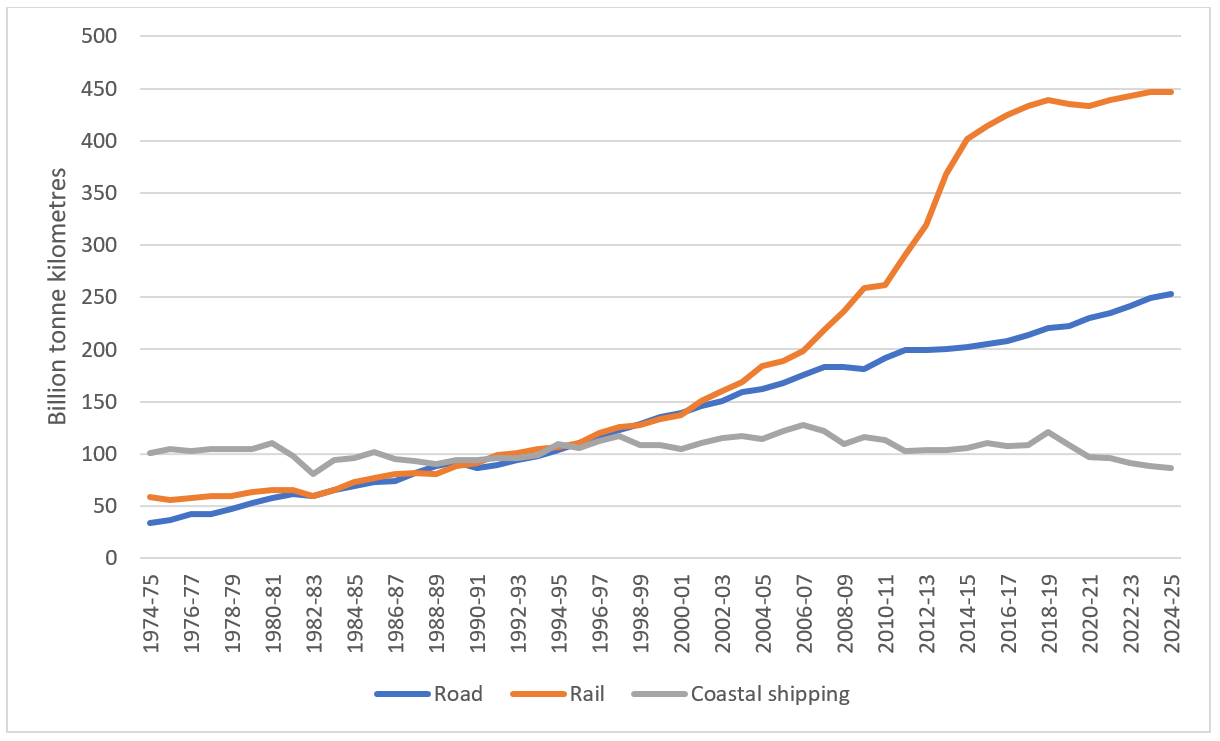
Figure 2 illustrates Australian domestic freight activity by transport mode from 1974–75 to 2024–25. The chart indicates that rail and road account for the majority of domestic freight movement. In 2024–25, rail transported approximately 447 billion tonne kilometres of freight, while road accounted for approximately 253 billion tonne kilometres.
Figure 2 Australian domestic freight task, by mode of transport
Source: BITRE Estimates