
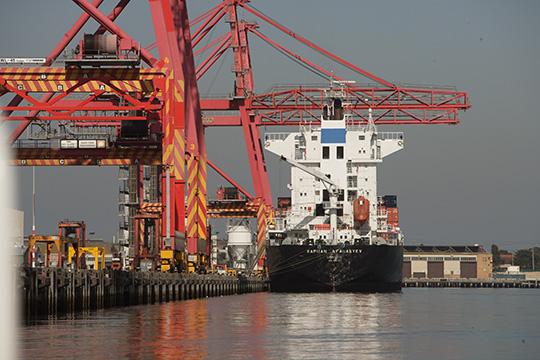
Shipping
Chapter 7
- Shipping—Yearbook 2025 (124 KB) - Download Excel file
- Australian Infrastructure and Transport Statistics Yearbook 2025 - Download PDF
This chapter provides information on Australian ships, cargo, ports and fleet, including mileage, tonnage and number of vessels. The data is sourced from BITRE’s Australian Sea Freight publication, BITRE’s Waterline publication and BITRE estimates based on Lloyd's List Intelligence data.
- 9.1 million TEUs (twenty-foot equivalent units) were exchanged at container terminals in Brisbane, Sydney, Melbourne, Fremantle, and Adelaide in 2024–25.
- 32,142 port calls were made to Australian ports in 2024–25. The states with the highest number were Western Australia with 9,580 and Queensland with 8,244.
- 5,841 different cargo vessels visited Australian ports in 2024–25.
- There were 53 Australian registered vessels in the Australian trading fleet, including small vessels, and 83 overseas registered vessels in 2022–23.
Figure 14 Principal Australian ports, by commodity
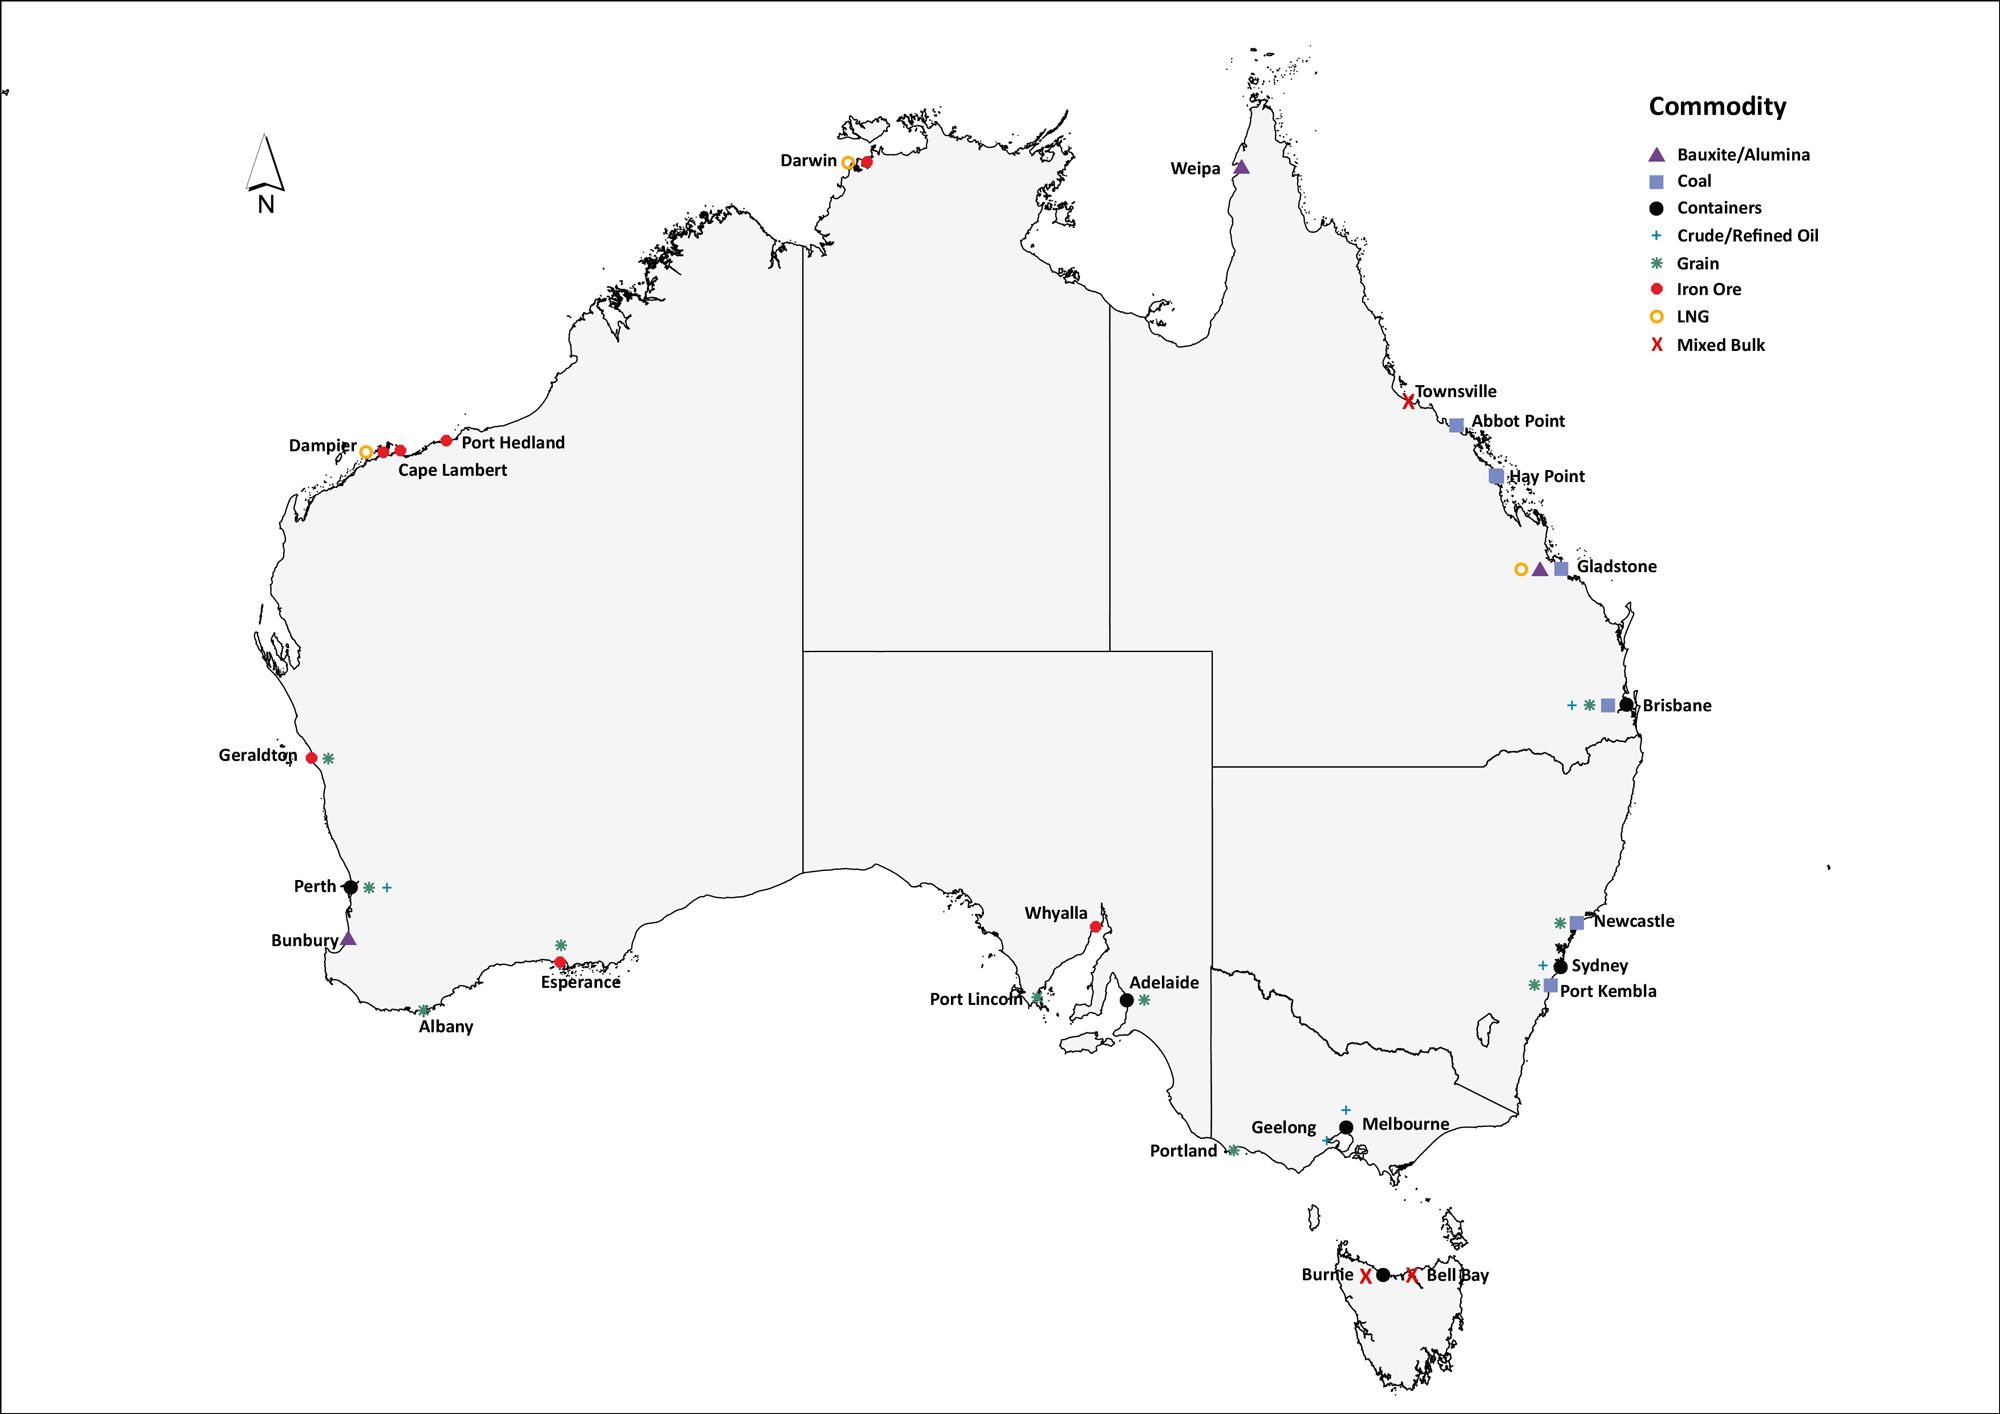
Figure 15 shows the number of port calls by state from 1999-00 to 2024-25. Queensland and Western Australia saw the largest increases and were consistently Australia’s two most visited states by cargo ships.
Figure 15 Number of port calls by state/territory
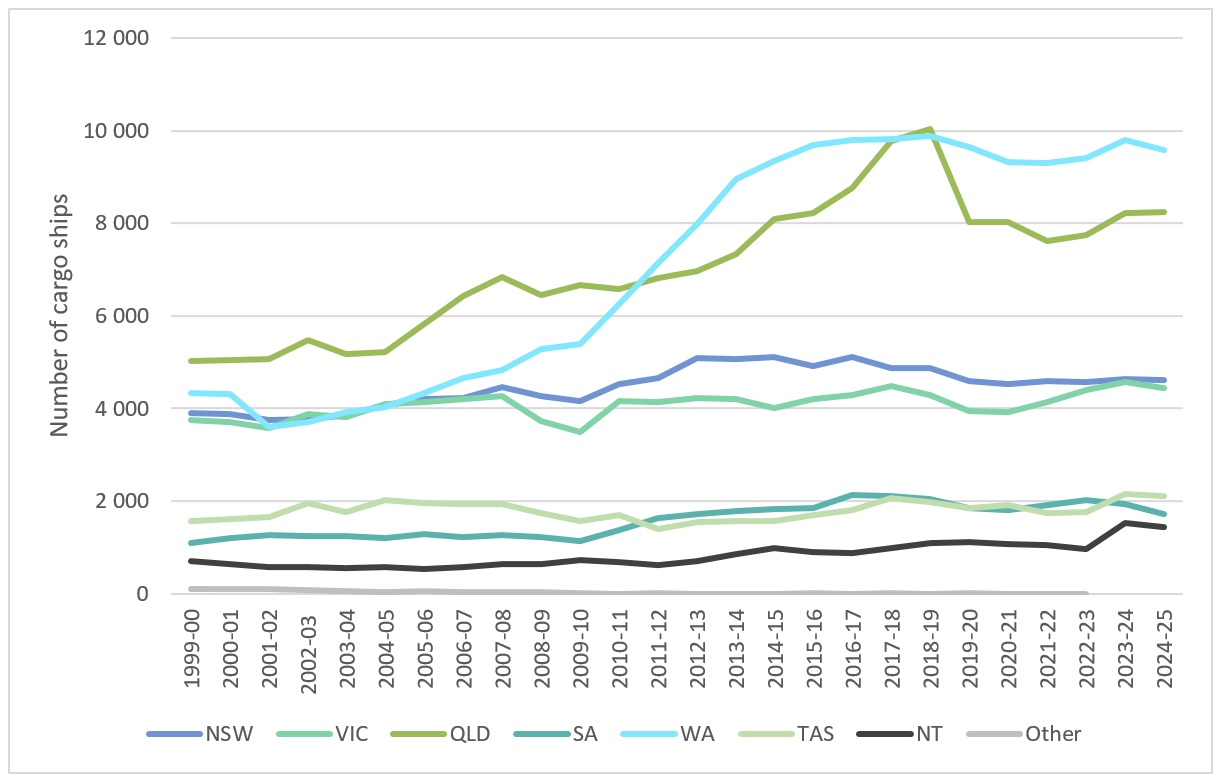
Note: “Other” includes state/territory not clearly specified in the source data.
Data may change slightly from year to year due to revisions to historical data. Ships that have made only port calls in the financial year where the target port equals the previous recorded port are excluded.
Source: BITRE estimates based on Lloyd’s List Intelligence data