
Rail
Chapter 5
- Australian Infrastructure and Transport Statistics Yearbook 2025 - Download PDF
- Rail—Yearbook 2025 (99 KB) - Download Excel file
This chapter provides information on rail expenditure, activity and network lengths. Estimates of passenger kilometres up to 2024-25 can be found in Chapter 2 - Passengers.
- People in Melbourne use light rail more than any other city with 155 million passengers in 2023–24.
- People in Sydney use heavy rail more than any other city with 352 million passengers in 2023–24.
- In 2023-24 there were $36 billion of public rail-related expenditure.
Figure 10 shows Australia’s network of railways by gauge and Figure 11 shows rail public transport patronage by million passenger movements. This refers to all trips on suburban rail networks and is based on reporting from train operators. Passenger movements were trending upwards in Sydney, Melbourne, Perth and Adelaide before starting to fall sharply in 2019–20 due to the COVID-19 pandemic. By 2023–24 patronage numbers had generally still not returned to 2018–19 levels.
Figure 10 Australia’s railways, by gauge
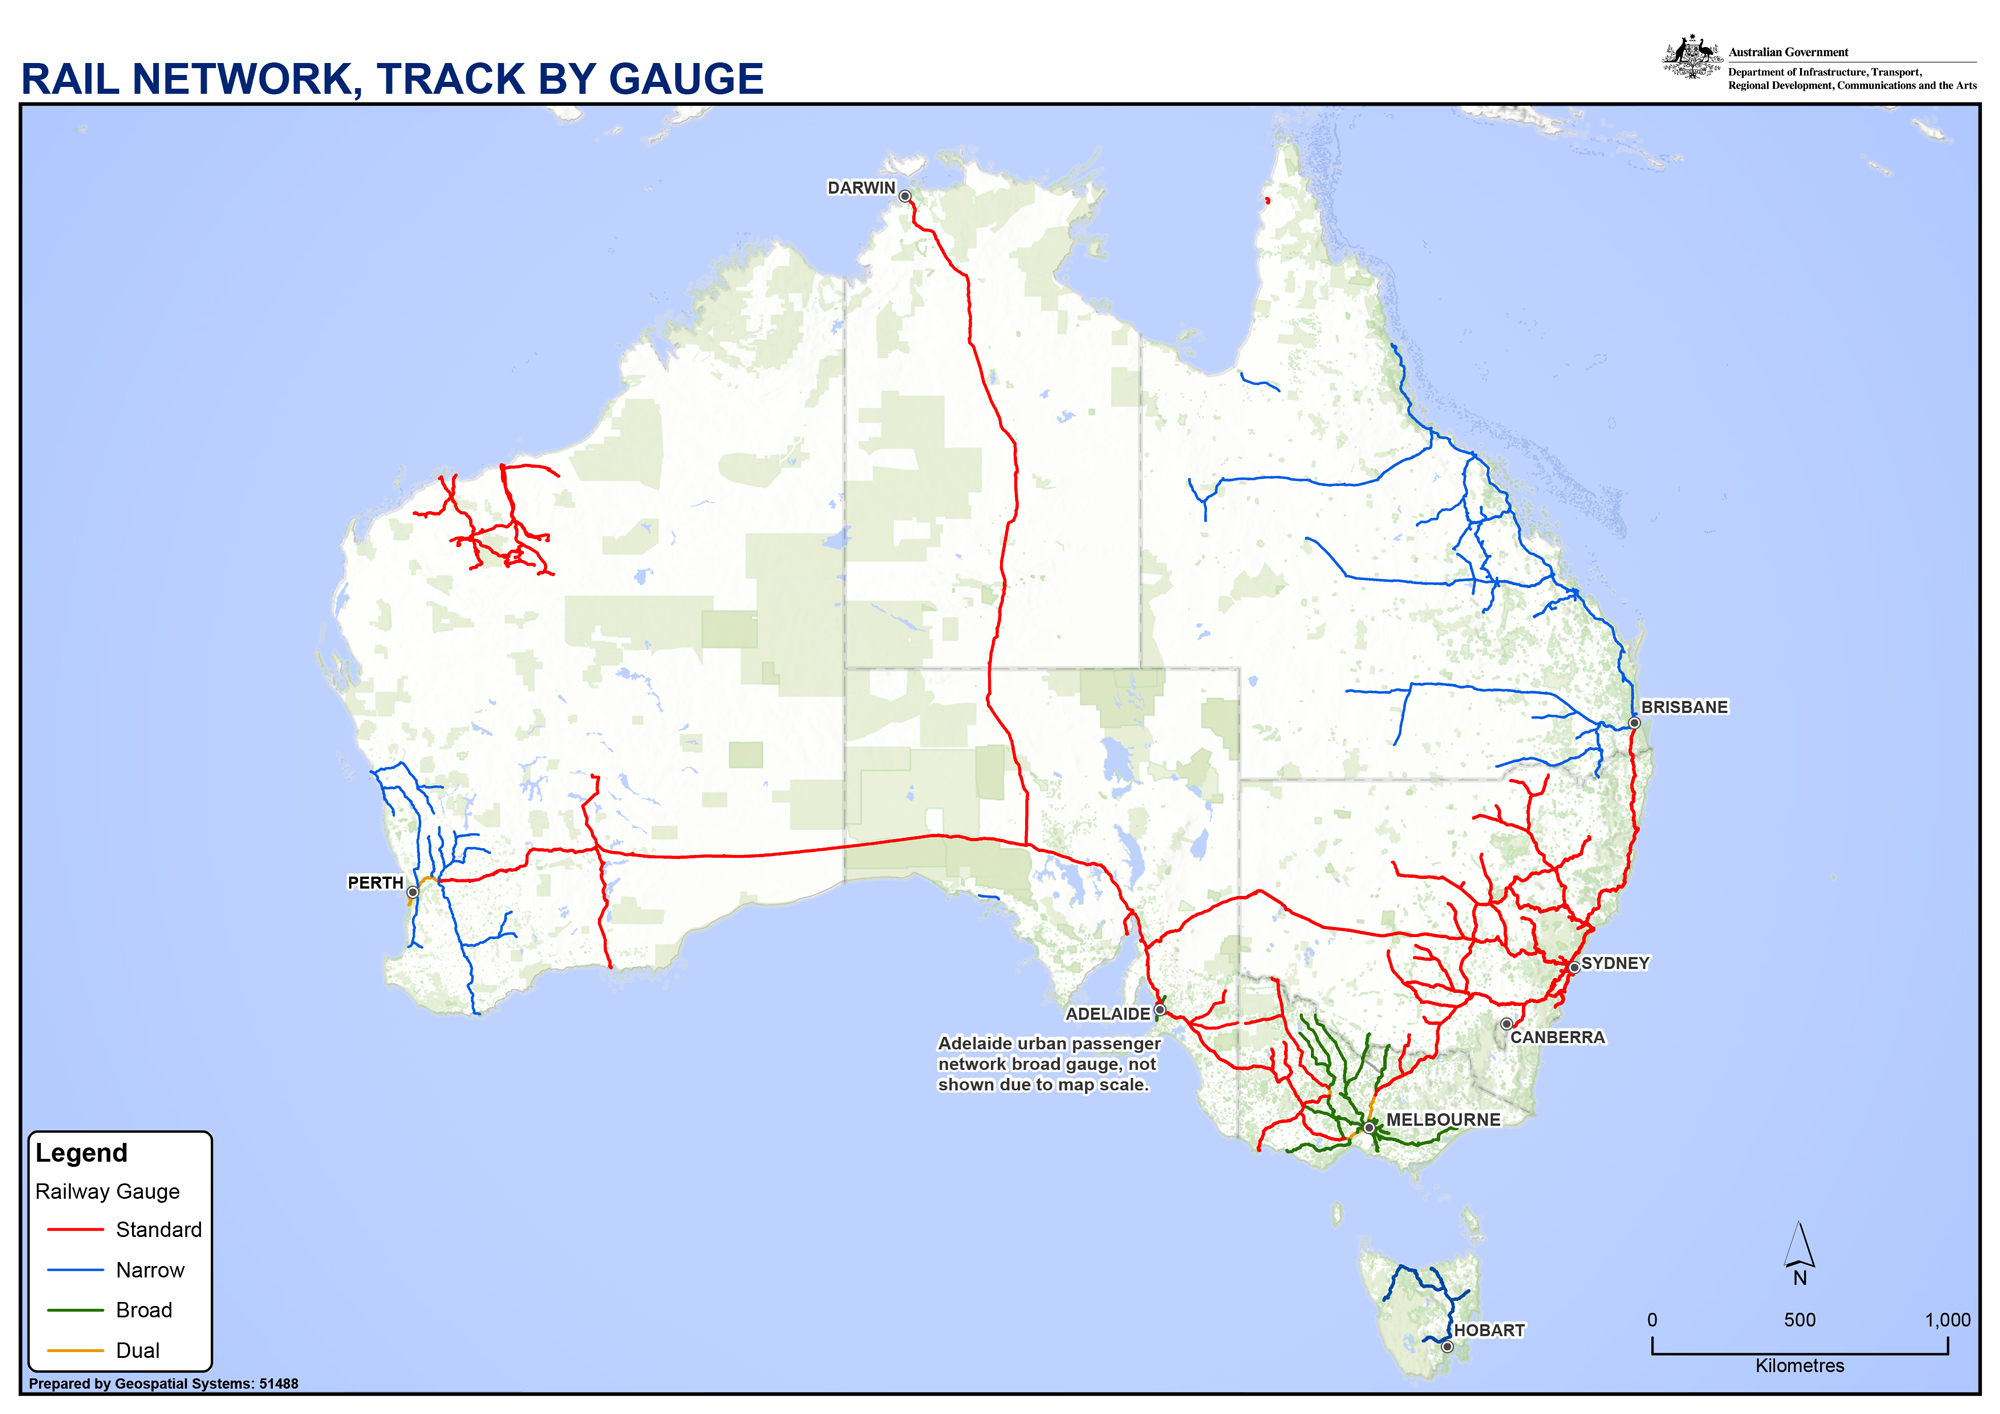
Source: BITRE (2025), Trainline 12
Figure 11 Public transit patronage on heavy rail, Australian capital city networks
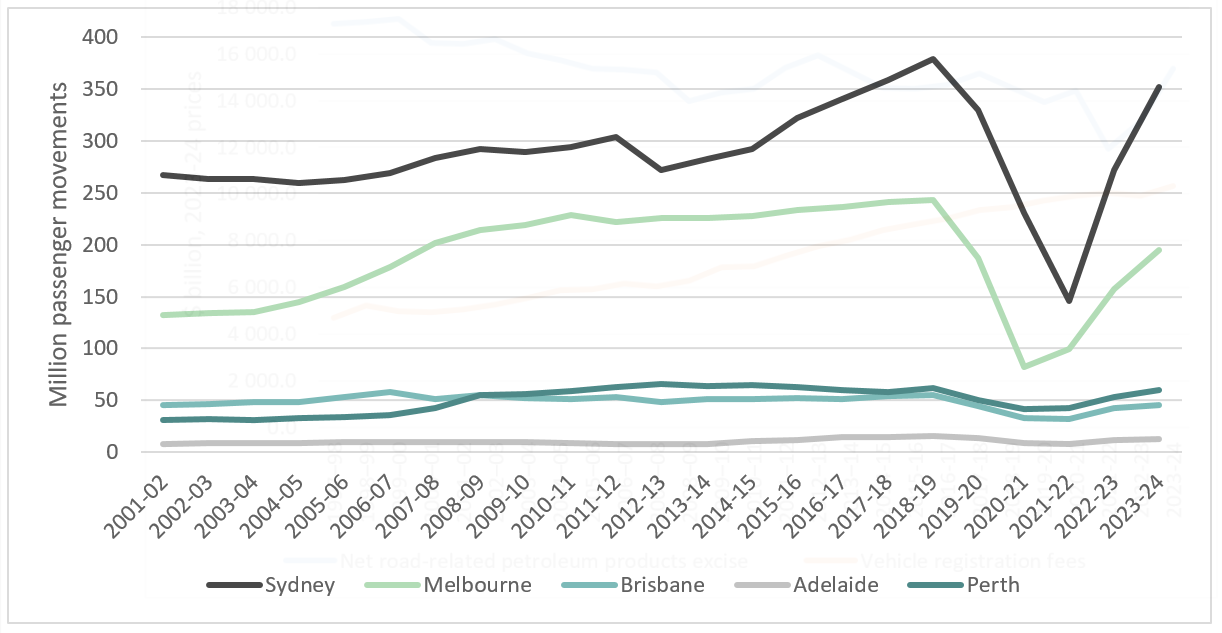
Sources: BITRE (2015), Long-term trends in urban public transport
BITRE (2025), Trainline 12
Prior Trainline publications