
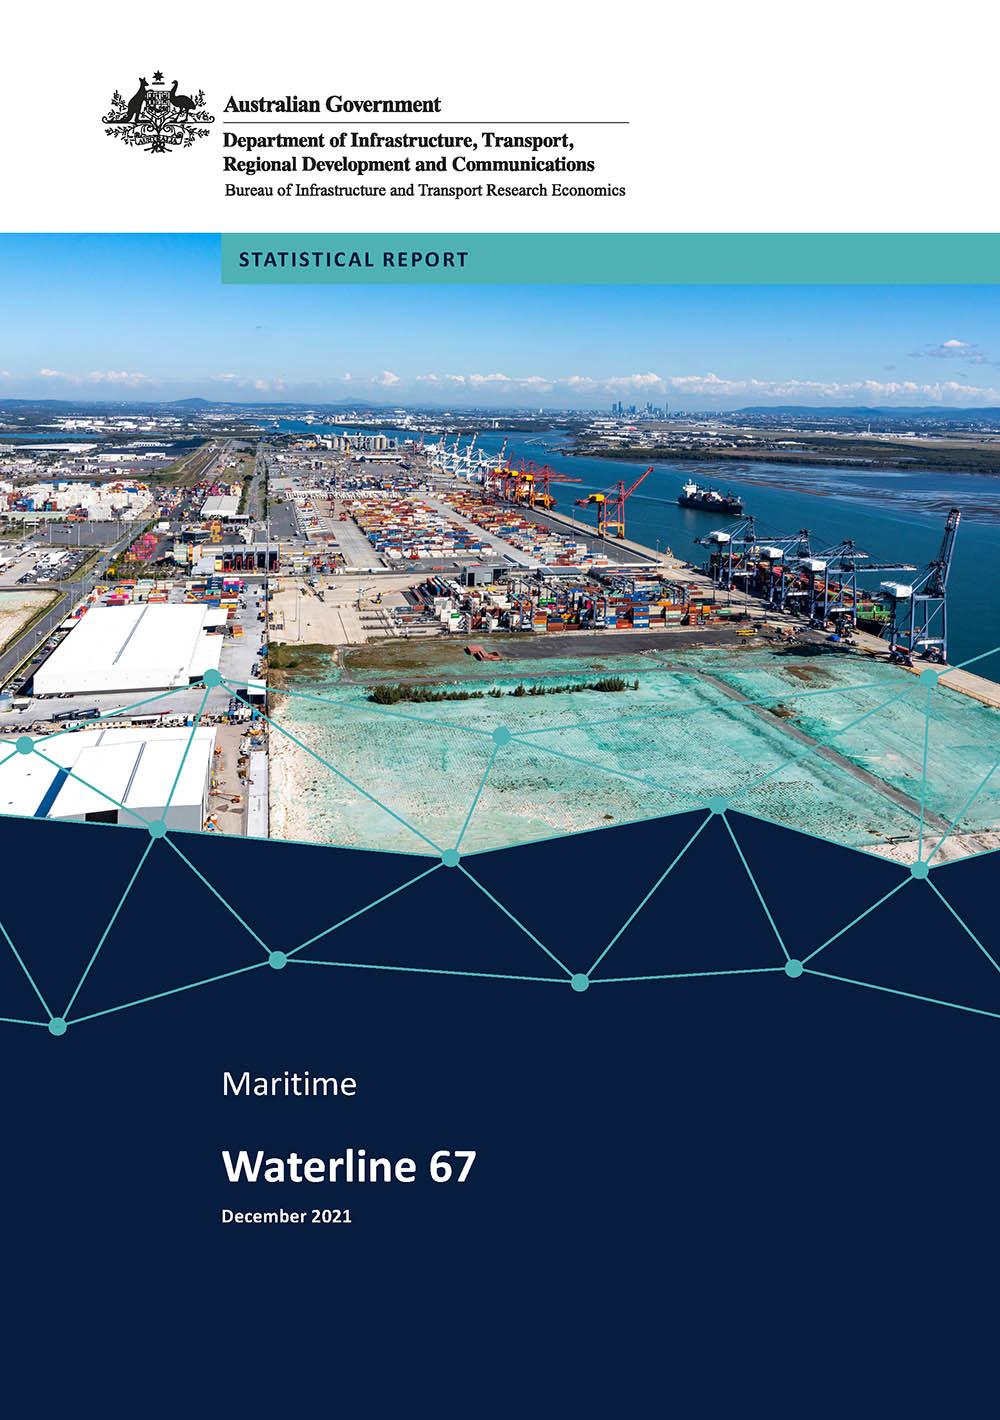
Waterline reports on trends in throughput, container handling productivity on the waterfront and landside of ports in Australia and the cost of importing and exporting containers via 5 container ports. It covers the loading and unloading of container ships and the transport of containers from container terminals.
This issue covers port terminal activity up to the December quarter 2020.
Freight vehicle congestion in Australia’s five major cities – 2020
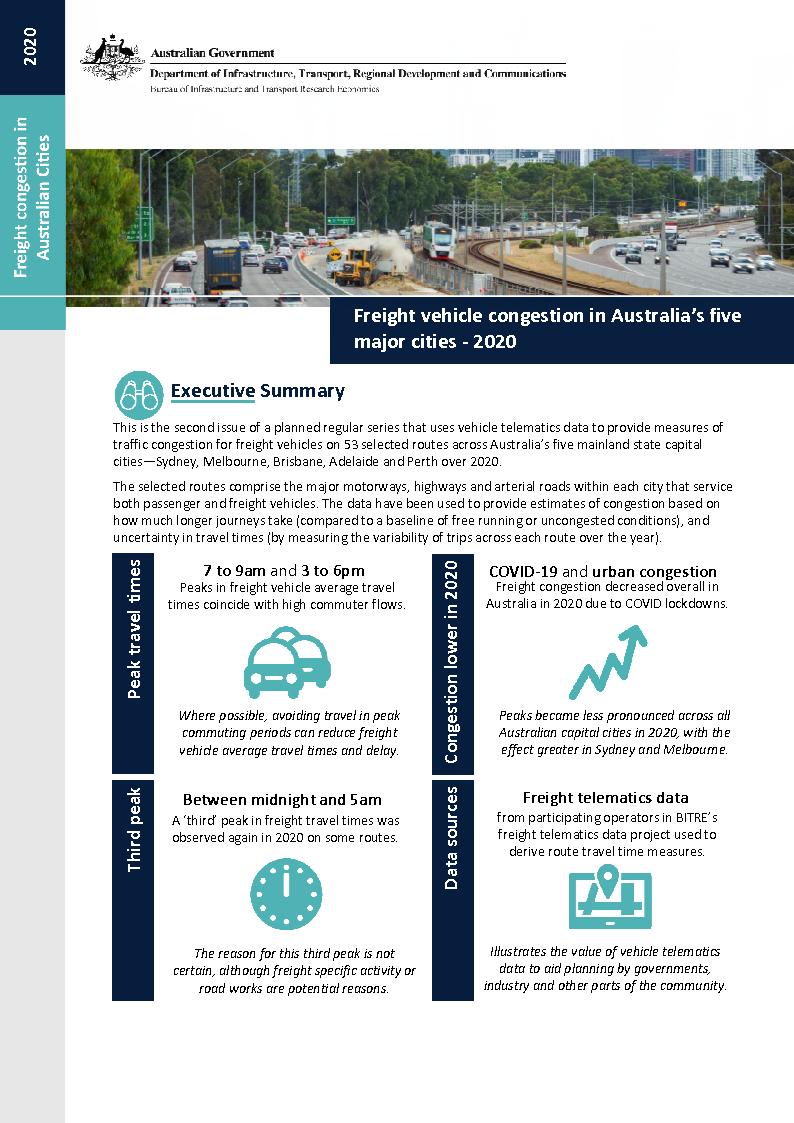
This publication is the second in a planned regular series that uses vehicle telematics data to provide measures of traffic congestion for freight vehicles on 53 selected routes across Australia’s five mainland state capital cities—Sydney, Melbourne, Brisbane, Adelaide and Perth. The selected routes comprise the major motorways, highways and arterial roads within each city that service both passenger and freight vehicles. The estimates presented in this report cover calendar year 2020, and includes a comparison with 2019 traffic congestion measures.
The results show that freight vehicle congestion decreased across all five mainland Australian capital cities in 2020, largely due to lower commuter activity on roads, particularly in peak periods, as a result of COVID-19 lockdowns. Whilst peak period travel times were less pronounced in 2020 across all cities, this effect was more significant in Sydney and Melbourne, because those cities had larger pre-COVID-19 traffic peaks and experienced longer lockdowns (particularly Melbourne), and less significant in other state capital cities. Copies of the data displayed in the report are available here and on data.gov.au.
Freight vehicle congestion in Australia’s five major cities - 2019
This publication is the first of a planned annual series that uses vehicle telematics data to provide measures of traffic congestion for freight vehicles on 53 selected routes across Australia’s five mainland state capital cities—Sydney, Melbourne, Brisbane, Adelaide and Perth. The selected routes comprise the major motorways, highways and arterial roads within each city that service both passenger and freight vehicles. The estimates presented in this report cover calendar year 2019.
The results show peaks in freight vehicle average travel times coincide with morning and evening peak commuter flows—for instance motorways tend to show morning peaks moving towards city CBDs and afternoon peaks moving away from it. Urban motorways exhibit more distinct travel time peak periods than non-motorway routes.
Australian sea freight 2018-19
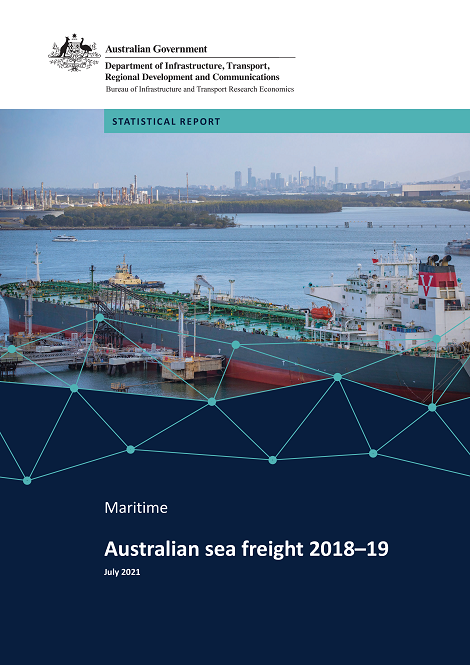
This is the latest in a series of Bureau of Infrastructure and Transport Research Economics (BITRE) reports that provide information on Australian sea freight movements, vessel activity, the use of coastal trading licences, and the size and composition of the Australian trading fleet. This report contains statistics on maritime freight and shipping activities in Australia from 2009–10 to 2018–19.
Import and export data up to 2020 has been made available through a visualisation on the National Freight Data Hub prototype website.
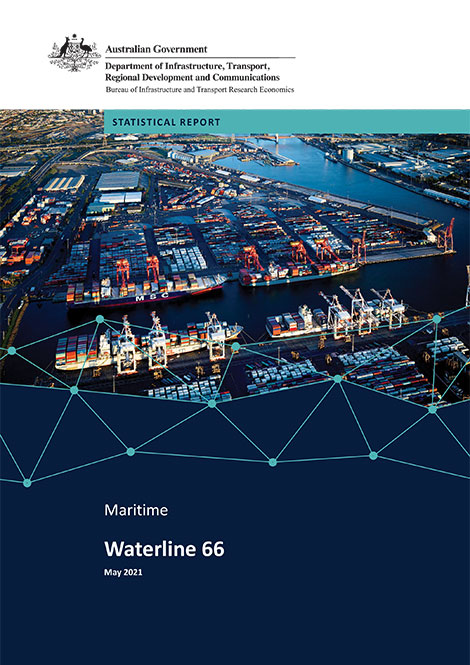
Waterline reports on trends in throughput, container handling productivity on the waterfront and landside of ports in Australia and the cost of importing and exporting containers via 5 container ports. It covers the loading and unloading of container ships and the transport of containers from container terminals.
This issue covers port terminal activity up to the June quarter 2020.
Regional port catchments for road freight
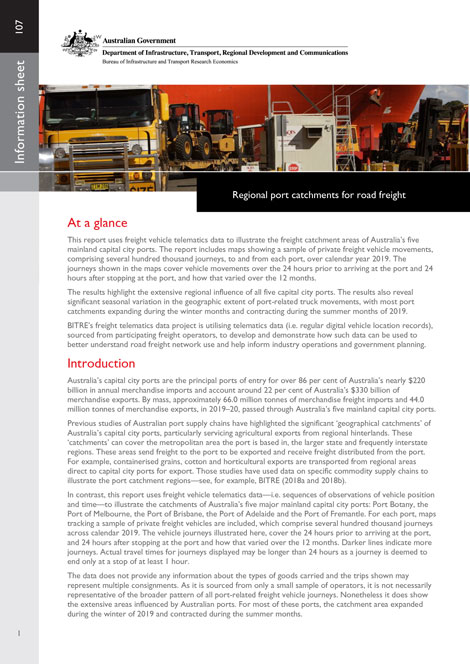
This Information Sheet uses freight vehicle telematics data to illustrate the freight catchment areas of Australia’s five mainland capital city ports. The report includes maps showing a sample of private freight vehicle movements, comprising several hundred thousand journeys, to and from each port, over calendar year 2019. The maps cover the 24 hours prior to arriving at the port and 24 hours after stopping at the port. The results highlight the extensive regional influence of all five capital city ports and also reveal significant seasonal variation in the geographic extent of port-related truck movements.
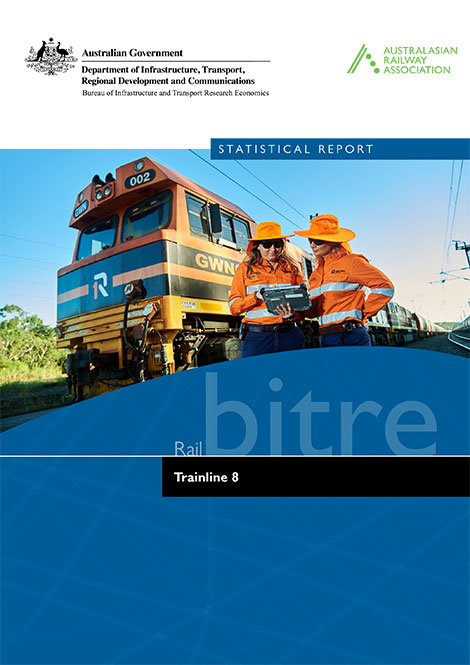
Trainline is a compendium of Australia's railways, providing insights, analysis and an understanding of the railway industry. Australia's railways are evolving via changes within and outside the industry. These changes include logistics, commodity flows, technology, urban patronage and regional passenger services. The publication presents an overview and data on railway transport tasks performed; characteristics of the railways and train operators' rolling stock that runs; and aspects of railway performance including safety, environment and reliability.
Tasmanian Freight Equalisation Scheme Monitoring Report 2020
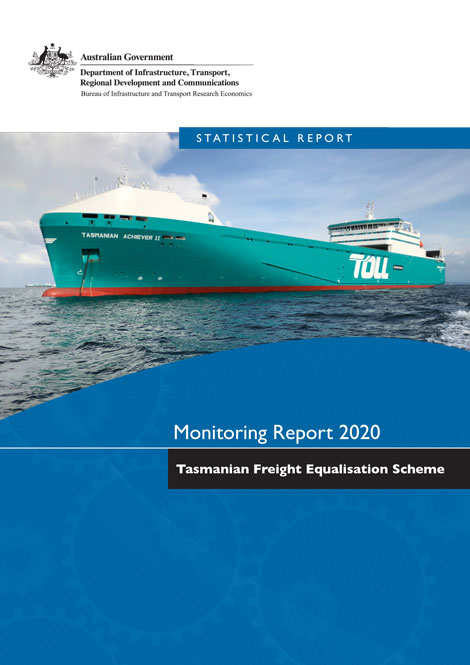
This report presents results of the first 4-yearly review of all components of the Tasmanian Freight Equalisation Scheme (TFES) as directed under Clause 10.5.2 of the TFES Ministerial Directions (Department of Infrastructure, Transport, Regional Development and Communication 2020).
Australian Infrastructure Statistics—Yearbook 2020
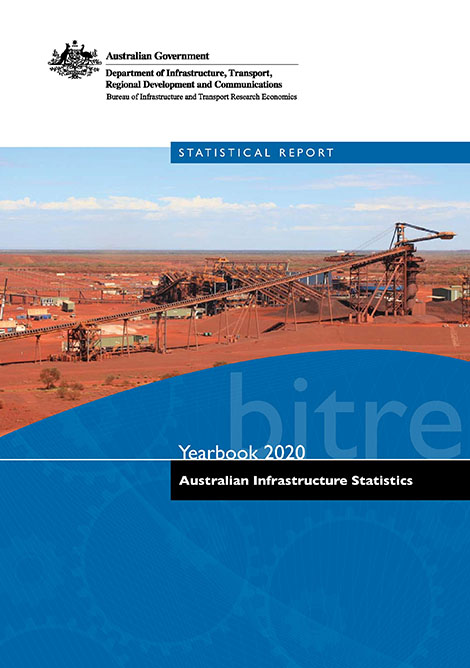
The aim of the Australian Infrastructure Statistics Yearbook is to provide a single, comprehensive annual source of infrastructure statistics for use by policymakers, industry leaders, transport analysts and the wider Australian community.
The publication is primarily a source of long-term, aggregate time series infrastructure statistics. Most statistics included in the publication are currently collected by BITRE or other Australian, state or territory government agencies.
The Yearbook is presented in 5 parts:
The yearbook is accompanied by the Key Australian Infrastructure Statistics Booklet which is a summary of statistics from the yearbook.
Freight Data Exchange pilot projects—Summary Report 2020
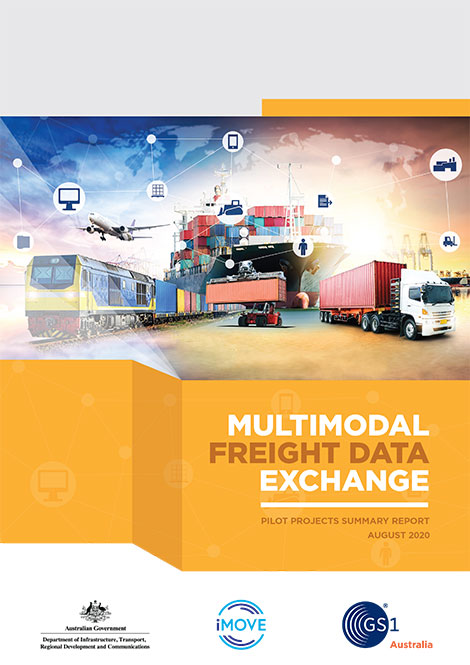
Information technology and data are increasingly essential to modern business operations. The increasing digitalisation of supply chain processes and freight consignment information offers further opportunities to increase the efficiency and productivity of Australian freight supply chains.
For industry, increasing digitalisation can improve visibility of freight consignments and interoperability between supply chain partners, and aid industry in responding to supply chain delays, bottlenecks or errors – and thereby improve overall freight industry efficiency and productivity. For governments and transport planning agencies, the increasing digitalisation of freight supply chain information can potentially provide more timely strategic-level information to help inform planning and investment, and at less cost.
In 2019-20, the Australian Government, in cooperation with iMOVE and selected industry partners, undertook an initial round of Freight Data Exchange pilot projects to investigate, develop and demonstrate the capability for supply chain partners to share freight consignment information in real time and also assess the feasibility of aggregating freight consignment event/message data to produce aggregate outputs that help inform infrastructure planning and policy priorities.
This report briefly outlines some of the key outcomes of the three projects and suggests directions for further work.
The report was produced in collaboration between BITRE and iMOVE Australia, and with the support and assistance of participating industry partners.