Chapter 5

This chapter provides information on passenger transport activity, including nationally, by city pair, by capital city and by method of travel to work. The data in this chapter comes from a variety of sources, being from BITRE’s estimates, the ABS’ Census Basic Community Profiles Series and from Tourism Research Australia.
- 158 billion passenger kilometres were travelled by car on capital city roads in 2022-23.
- 10.5 billion passenger kilometres were travelled on heavy rail networks in 2022-23.
- 164 billion passenger kilometres were travelled by car on capital city roads in 2018-19, prior to any COVID impacts.
- 14.8 billion passenger kilometres were travelled on heavy rail in 2018-19, prior to any COVID impacts.
Figure 1 Australia’s National Passenger travel, 2022-23
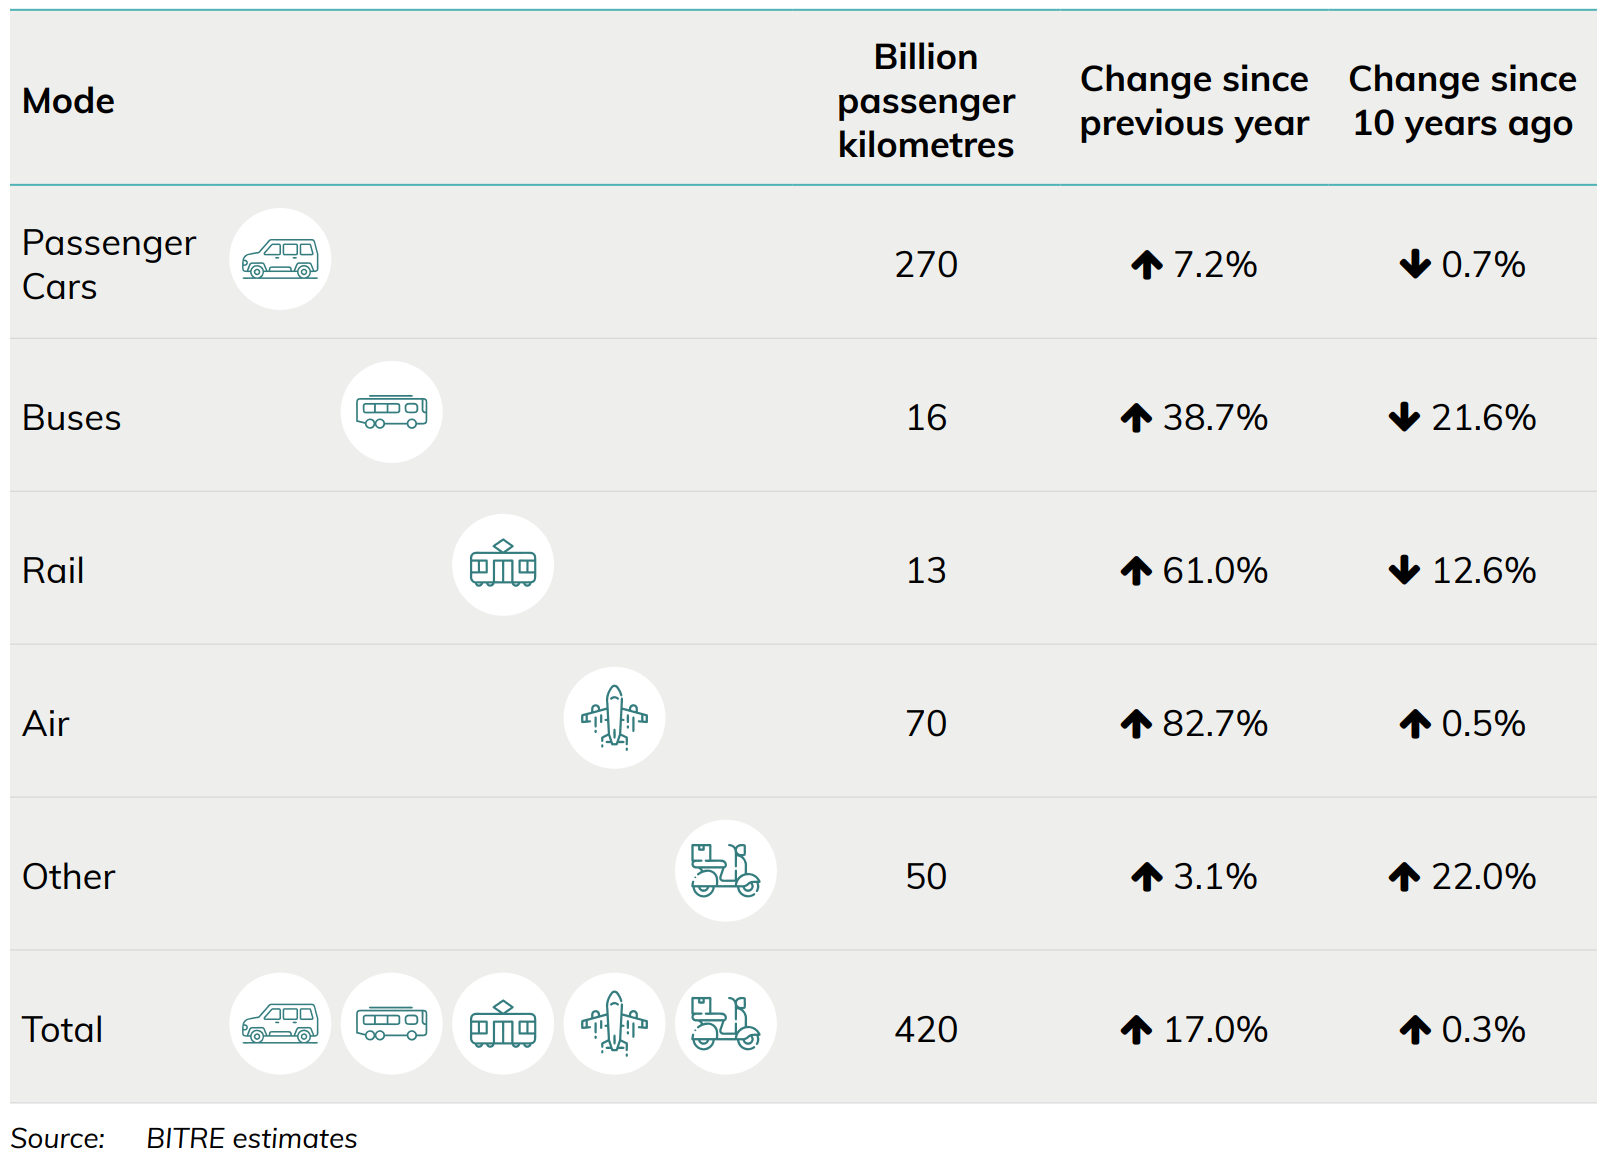
Passenger transport activity (Figure 1) is measured by passenger kilometres (the number of kilometres travelled by passenger vehicles multiplied by the number of occupants in the vehicle).
Figure 2 Australian domestic passenger task, by mode of transport
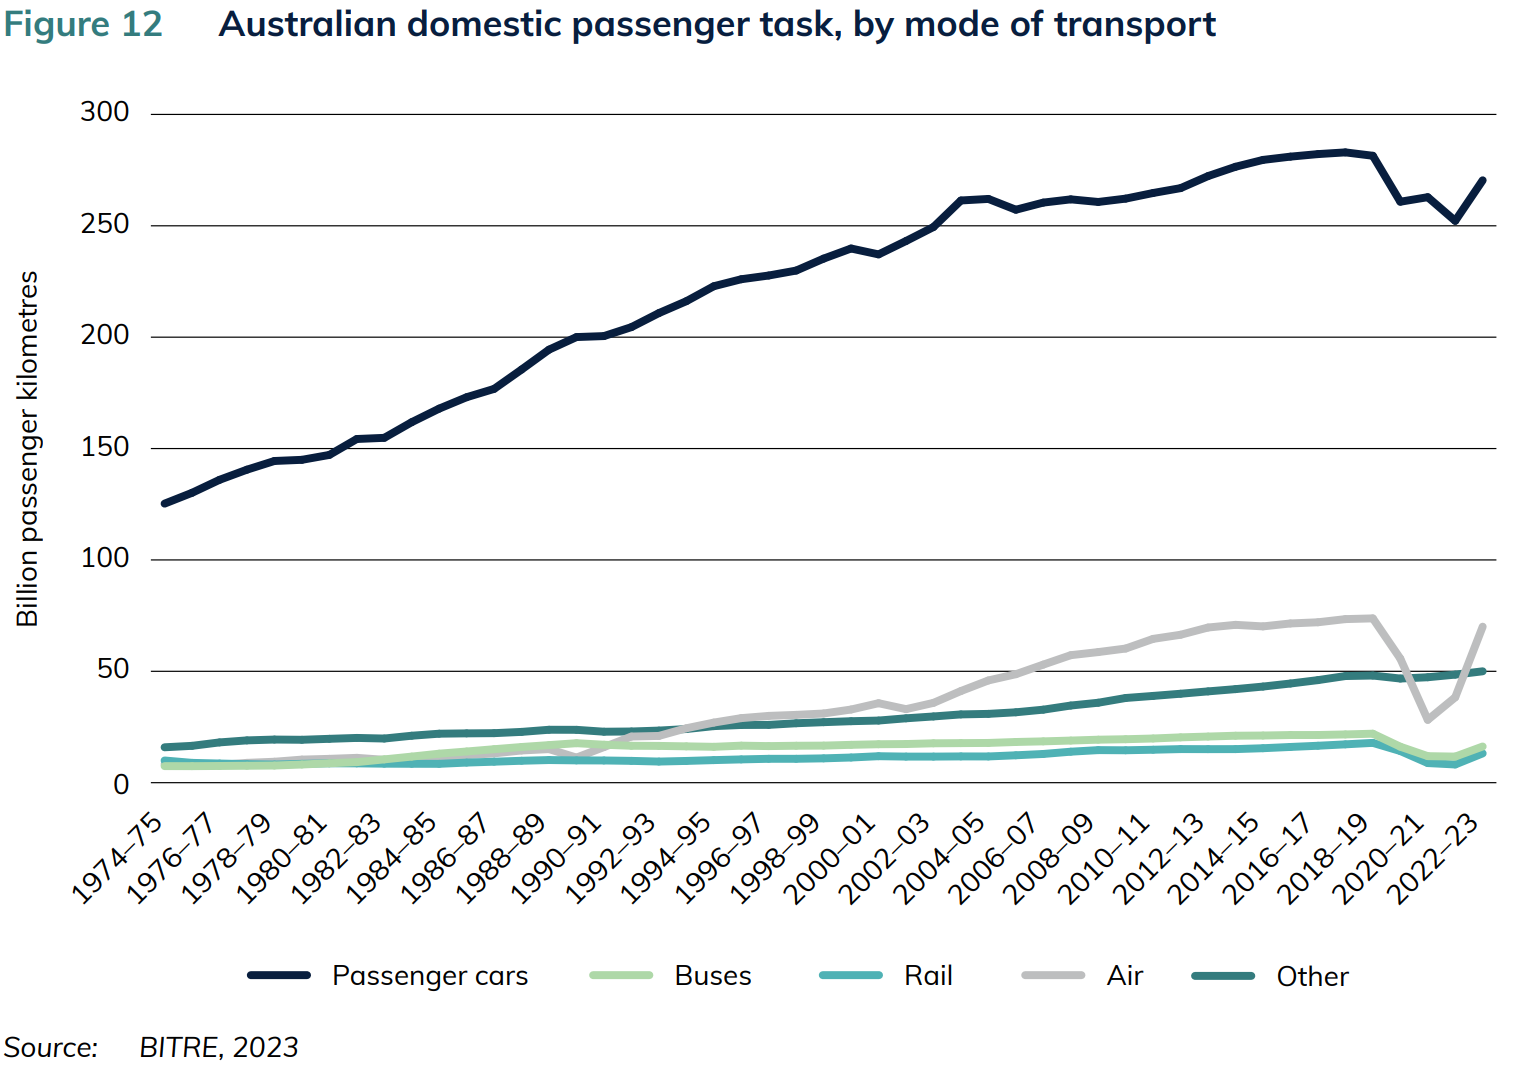
The Australian domestic passenger task is dominated by road transport, mainly passenger cars (Figure 2). Passenger travel on other modes has generally been increasing, albeit with a dip over the pandemic period. Air travel expectedly fell most significantly, however in 2022-23 it had recovered to near its pre-pandemic level.
Download data
Also see
Chapter 2
This chapter provides information on passenger transport activity, including nationally, by city pair, by capital city and by method of travel to work. The data in this chapter comes from a variety of sources, including BITRE estimates, ABS Census and Tourism Research Australia.
- 166 billion passenger kilometres were travelled by car on capital city roads in 2024-25, of a total of 280 billion passenger kilometres nationwide.
- 16 billion passenger kilometres were travelled on rail in 2024-25 compared to 18 billion in 2018-19, prior to any COVID impacts.
Passenger transport activity is measured by passenger kilometres (the number of kilometres travelled by passenger vehicles multiplied by the number of occupants in the vehicle). As shown in Figure 3, the passenger task is dominated by road transport, mainly passenger cars. Passenger travel on other modes has generally been increasing, albeit with a dip over the pandemic. Air travel fell most significantly, however by 2024-25, it had surpassed its pre-pandemic level. Prior to COVID, public transport use was growing relatively quickly, as shown in Figure 4. By 2024-25 it has returned close to its 2018-19 peak.
Figure 3 Total national motorised passenger travel, by mode
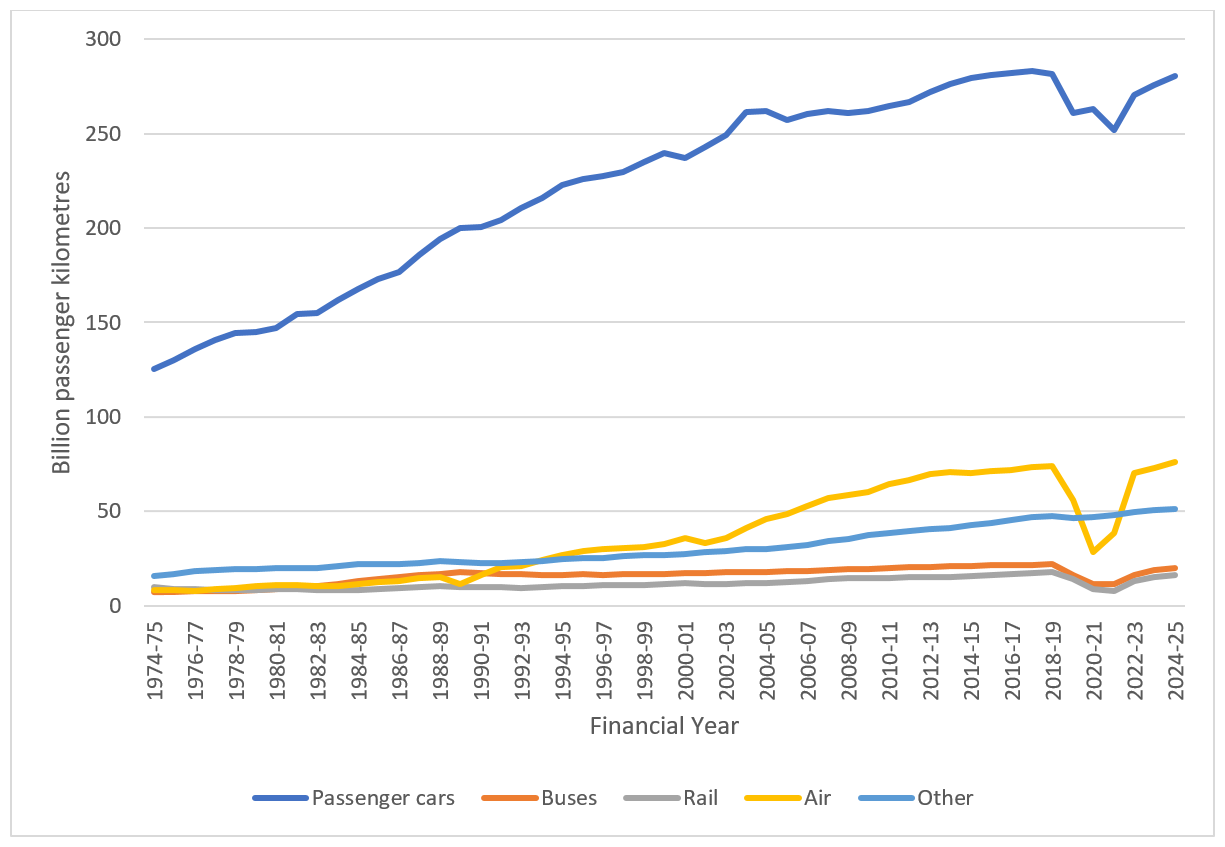
Source: BITRE Estimates
Figure 4 Australian capital city domestic passenger task, by mode
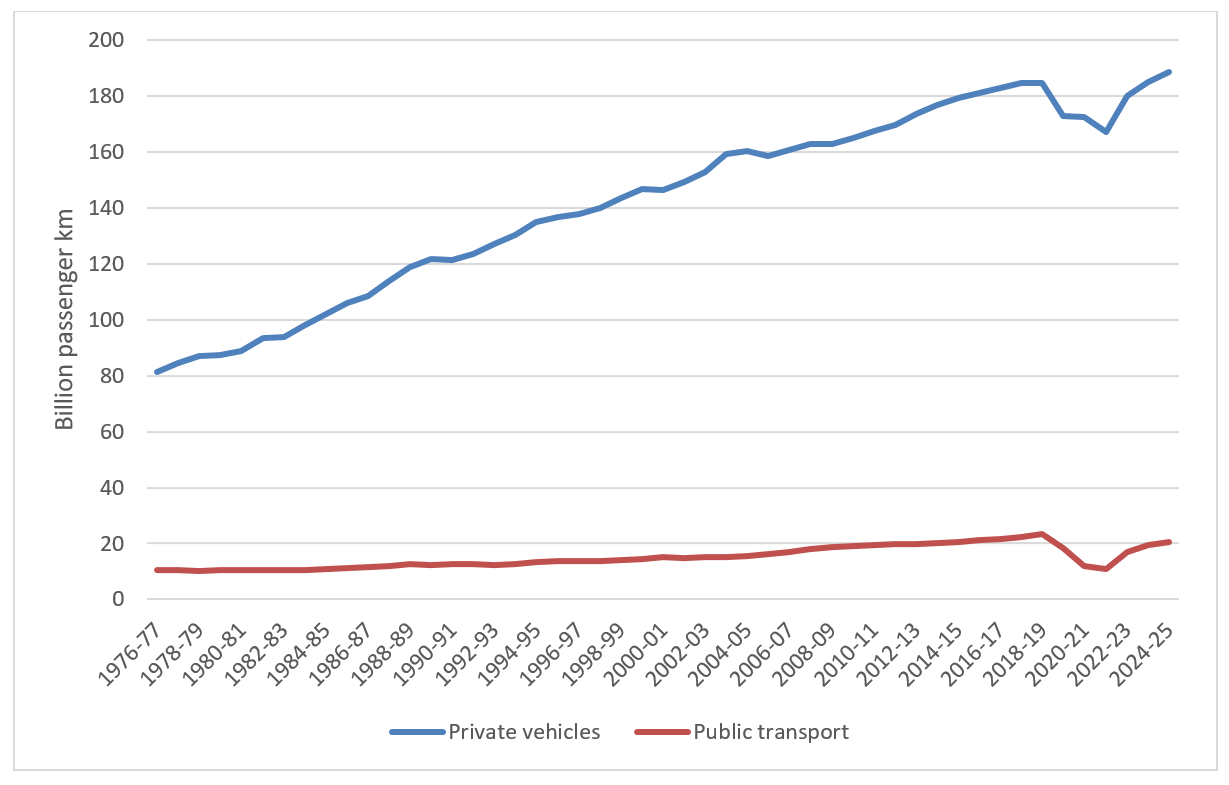
Source: BITRE Estimates
Download data
- Passengers—Yearbook 2025 (188 KB) - Download Excel file
- Australian Infrastructure and Transport Statistics Yearbook 2025 - Download PDF
Also see
The Department undertakes research, data collection and analysis related to issues affecting regional Australia. The information presented here allows policy makers, program administrators and researchers to understand the impacts their activities have on regional communities.
Statistical Analysis
- Population trends BCARR Migration Geography
Fact sheet providing an overview of Australian population trends over the five years between 2016 and 2021, using BCARR migration geography. - 2021 Estimated Resident Population
Statistical fact sheet of the Estimated Resident Population for Australian regions and capital cities to June 2021. - Snapshot of Cities and Regions—chart pack
This chart pack provides a summary of population, employment, housing and liveability trends for our cities and regions.
Understanding regional data series
- Understanding statistical geography
This fact sheet provides a quick guide to assist people to analyse regional data and consider what geographical scale most accurately represents their region/s of interest. - Understanding regional data: Population
This fact sheet provides a high level guide to finding and using regional population data. - Understanding regional data: Employment
This fact sheet provides a guide to sourcing, analysing and presenting regional employment data. It also includes a summary of other labour market data sources and their characteristics. - Understanding regional data: Industry
This fact sheet provides a guide for finding and analysing regional industry data. The fact sheet also describes methods for constructing key indices of industrial diversity and structural change across regions. - Understanding Socio-Economic Indexes for Areas (SEIFA)
This fact sheet provides a guide to understanding and using the Socio-Economic Indexes for Areas (SEIFA) data produced by the Australian Bureau of Statistics. SEIFA is a set of four indexes which are used to compare relative advantage and disadvantage of small areas.
Experimental Gross Regional Product estimates
Gross Regional Product (GRP) is an estimate of each region's unique contribution to the national economy. While Australian regional economies are interlinked, GRP can be used as an indicator of local economic activity.
BCARR has produced experimental estimates of GRP for 2015–16 and 2020–21. The estimates are available for download and are accompanied by a fact sheet summarising GRP size and change across regions, as well as an interactive map page on the Regional Data Hub.
Estimates are produced using the ABS Statistical Areas Level 4 which broadly represents local labour markets. Information is also provided regarding GRP estimates for Northern Australia, which spans across Queensland, the Northern Territory and Western Australia.
Population change and internal migration during the COVID-19 pandemic
Population change and internal migration during the COVID-19 pandemic
Understanding spatial patterns of population change is vital in planning for services and infrastructure, and in managing the pressures created as local populations grow and decline. A large shock to the Australian economy and society, such as the COVID-19 pandemic, has the potential to create new pressure for settlement pattern change. In this context, this report investigates regional population change and internal migration flows during the peak period of the pandemic (2020-21), contrasting with a five-year period representing the medium term, and the population change for 2021-22.
The report uses the BCARR migration geography, which separates regions by characteristics including city status, and whether coastal, inland or remote.
Working zones 2021 update
This fact sheet provides an update to the Working zones geography following the 2021 Australian Statistical Geography Standard. The Working zones statistical geography describes regions that reflect commuting patterns of Australian workers and can be used to analyse local labour markets. The release includes an excel correspondence and a shapefile to enable people to analyse their own data on this geography.
The future of Australian cities and regions in a post-pandemic world
iMOVE report - The future of Australian cities and regions in a post-pandemic world
This research was conducted by the University of South Australia (UniSA) between March 2022 and June 2023, and was co-funded by the Department of Infrastructure, Transport, Regional Development, Communications and the Arts in partnership with the iMOVE Co-operative Research Centre.
The study addresses the following questions:
- What are the primary determinants of firm and residential location patterns across Australia?
- What are the drivers of or barriers to attracting and retaining businesses and households to regional cities, and how do they differ based on characteristics of businesses, households and regions?
- What are the possible long-term impacts of COVID-19 on firm and residential location decisions across metropolitan and regional cities?
- How are these impacts likely to influence resulting spatial patterns of employment activity and residential settlement within and across these cities?
To answer these questions, UniSA undertook nationwide surveys of businesses, landlords and residents, along with conducting interviews and focus groups with residents across different city sizes and types, real estate and property developers, commercial landlords, state and local government officials, business owners and senior executives.
This study provides important insights for policymakers, businesses, and communities on current and possible future patterns of employment activity and residential settlement.
Research
- Nearly twenty years of research within the Department on the important issues facing regional Australia: Research into Regional Australia.
This is not the latest release. View the latest Working zones update
This report provides an overview of the newly developed Australian 'working zone' (WZ) regions which have been compiled by the Bureau of Infrastructure, Transport and Regional Economics (BITRE). WZs are mutually exclusive regions delineated to reflect the commuting patterns of Australian workers. WZs are useful for spatial analysis of economic, social and policy issues at a regional level because they reflect the actual geographic behaviour of individuals, as opposed to other administrative and political boundaries. They are particularly useful for analysing labour markets, because individual WZs have minimal work-based commuting flows either into or out of adjoining WZs.
- Working Zones 2016
- Working Zones 2016 Data
- Working Zones 2016 to SA2 Concordance
- Working Zones 2016 Shape File

Review of the National Cities Performance Framework – Final paper
The National Cities Performance Framework (NCPF) was launched in 2017 with the commitment to conduct reviews every 3 years. This report covers the feedback received and the approach for the future of the NCPF. The conclusion of the NCPF review is that alternate departmental data and research products better meet the needs of stakeholders and that the Framework should be phased out. Targeted research will focus on issues of the highest priority to the government and cities’ stakeholders.
Review of the National Cities Performance Framework - Consultation paper
The National Cities Performance Framework (NCPF) was launched in 2017 with the commitment to conduct reviews every 3 years. The first 3 Year Review will examine what improvements can be implemented in the 2021 update and future years. This consultation paper is the start of the public consultation process, conducted over January-February 2021. It details the 3-year review process, the issues being considered, and the proposed approach for each issue. Some of the topics covered include potential new indicators, a review of the geographies, and improving the structure of the framework.
Population synthesis for travel demand modelling in Australian capital cities
In this research, the proposed synthesis routine has been used to generate full size synthetic populations of households and individuals for Greater Sydney, Melbourne and Brisbane. Two heuristic algorithms have been formulated for data treatment before and after the synthesis process to improve the representation of the synthesised populations. The procedure proposed for data treatment before the synthesis routine ensures the consistency of the input data, whereas the procedure proposed for data treatment after the synthesis routine extends under-synthesised estimates to a complete synthetic population. The synthesis process was tested for its efficacy and the synthesised populations were validated extensively. This research contributes in setting up a replicable population synthesis routine that can be included into a standard methodological toolbox for transport researchers and mainstream social scientists to produce Australian synthetic populations that is essential to microsimulation analysis.
- Population Synthesis for Travel Demand Modelling in Australian Capital Cities
Population and access to local services
The paper considers the relationship between population and services. The approach taken is to consider the role of population before a service provider will enter a market, and then explain why this occurs and how this relates to competition. This paper applies a standard neo-classical micro-economic framework.
- Population and access to local services
Progress in Australian Regions Yearbook 2019
This is not the latest release. View the latest release
The Progress in Australian Regions—Yearbook is a statistical resource that measures progress in a region against social, economic, environmental and governance indicators. The Yearbook brings together information about Australia's regions from a range of different sources and presents that data in a consistent format over time.
This sixth edition updates information from previous editions of the Yearbook. It incorporates updated data where possible.
Excel files with additional geographic boundaries have also been provided, where data is available at that scale (Local Government Areas, Statistical Urban Areas, Statistical Areas Level 2, Statistical Areas Level 3). These are additional to the data in the published Yearbook.
Note that data for areas with very small populations should be used with caution, as small numbers can be significantly impacted by random adjustment.
The full machine-readable dataset of the Progress in Australian Regions–Yearbook can be found at data.gov.au/data/dataset/progress-australian-regions. Where possible, component data used to calculate indicators has been included.
- Progress in Australian Regions Yearbook 2019
PDF: 24633 KB - Introduction, foreword and table of contents
PDF: 16902 KB
Progress
Contextual
Appendices
- Abbreviations and acronyms; Endnotes and definitions; and References
PDF: 2363 KB
Previous yearbooks
- Progress in Australian Regions—Yearbook 2018
- Progress in Australian Regions—Yearbook 2017
- Progress in Australian Regions—Yearbook 2016
- Progress in Australian Regions—Yearbook 2015
- Progress in Australian Regions—Yearbook 2014
Society
- Progress 1: Society
PDF: 3043 KB- P 1.1 Health and wellbeing
- P 1.1.1 Life expectancy at birth
XLSX: 23 KB - P 1.1.2 Psychological distress
XLSX: 24 KB - P 1.1.3 Suicide rate
XLSX: 18 KB - P 1.1.4 Overweight or obese
XLSX: 62 KB - P 1.1.5 Physical activity
XLSX: 64 KB - P 1.1.6 Smoking rates
XLSX: 76 KB
- P 1.1.1 Life expectancy at birth
- P 1.2 Close relationships
- P 1.2.1 Children developmentally vulnerable due to physical health and wellbeing
XLSX: 16 KB
- P 1.2.1 Children developmentally vulnerable due to physical health and wellbeing
- P 1.3 Home
- P 1.3.1 Homelessness
XLSX: 32 KB- P 1.3.1 Homelessness - Additional boundaries
XLSX: 284 KB
- P 1.3.1 Homelessness - Additional boundaries
- P 1.3.2 Overcrowded conditions
XLSX: 33 KB- P 1.3.2 Overcrowded conditions - Additional boundaries
XLSX: 219 KB
- P 1.3.2 Overcrowded conditions - Additional boundaries
- P 1.3.3 Households that own their own home
XLSX: 34 KB- P 1.3.3 Households that own their own home - Additional boundaries
XLSX: 228 KB
- P 1.3.3 Households that own their own home - Additional boundaries
- P 1.3.4 Recognising traditional country
XLSX: 18 KB
- P 1.3.1 Homelessness
- P 1.4 Safety
- P 1.4.1 Victims of physical assault
XLSX: 31 KB - P 1.4.2 Victims of malicious property damage
XLSX: 26 KB - P 1.4.3 Road fatalities
XLSX: 25 KB
- P 1.4.1 Victims of physical assault
- P 1.5 Learning and knowledge
- P 1.5.1 Vocational or higher educational qualifications
XLSX: 34 KB- P 1.5.1 Vocational or higher educational qualifications - Additional boundaries
XLSX: 228 KB
- P 1.5.1 Vocational or higher educational qualifications - Additional boundaries
- P 1.5.2 Year 5 and 9 reading standards
XLSX: 100 KB - P 1.5.3 Year 5 and 9 numeracy standards
XLSX: 17 KB
- P 1.5.1 Vocational or higher educational qualifications
- P 1.6 Community connections
- P 1.6.1 Voluntary work
XLSX: 68 KB- P 1.6.1 Voluntary work - Additional boundaries
XLSX: 225 KB
- P 1.6.1 Voluntary work - Additional boundaries
- P 1.6.1 Voluntary work
- P 1.7 Fair opportunity
- P 1.7.1 Disposable household income for low and middle income households
XLSX: 59 KB
- P 1.7.1 Disposable household income for low and middle income households
- P 1.8 Enriched lives
- P 1.8.1 Unpaid help
XLSX: 37 KB - P 1.8.2 Attendance at cultural venues and events
XLSX: 86 KB
- P 1.8.1 Unpaid help
- P 1.1 Health and wellbeing
Economy
- Progress 2: Economy
PDF: 2944 KB- P 2.1 Opportunities
- P 2.1.1 Having a qualification or working in a skilled occupation
XLSX: 35 KB- P 2.1.1 Having a qualification or working in a skilled occupation - Additional boundaries
XLSX: 282 KB
- P 2.1.1 Having a qualification or working in a skilled occupation - Additional boundaries
- P 2.1.2 Young people earning or learning
XLSX: 34 KB- P 2.1.2 Young people earning or learning - Additional boundaries
XLSX: 227 KB
- P 2.1.2 Young people earning or learning - Additional boundaries
- P 2.1.3 Net business entry rate
XLSX: 41 KB- P 2.1.3 Net business entry rate - Additional boundaries
XLSX: 277 KB
- P 2.1.3 Net business entry rate - Additional boundaries
- P 2.1.1 Having a qualification or working in a skilled occupation
- P 2.2 Jobs
- P 2.2.1 Employed persons
XLSX: 24 KB - P 2.2.2 Unemployment rate
XLSX: 24 KB - P 2.2.3 Youth unemployment rate
XLSX: 25 KB
- P 2.2.1 Employed persons
- P 2.3 A resilient economy
- P 2.3.1 Proportion of unemployed persons unemployed for 12 months or more
XLSX: 16 KB - P 2.3.2 Labour force underutilisation rate
XLSX: 24 KB - P 2.3.3 Value of new building approvals
XLSX: 40 KB- P 2.3.3 Value of new building approvals - Additional boundaries
XLSX: 321 KB
- P 2.3.3 Value of new building approvals - Additional boundaries
- P 2.3.1 Proportion of unemployed persons unemployed for 12 months or more
- P 2.4 Enhanced living standards
- P 2.4.1 Real median weekly household income
XLSX: 33 KB- P 2.4.1 Real median weekly household income - Additional boundaries
XLSX: 282 KB
- P 2.4.1 Real median weekly household income - Additional boundaries
- P 2.4.2 Real household net worth
XLSX: 57 KB - P 2.4.3 Labour force participation
XLSX: 25 KB
- P 2.4.1 Real median weekly household income
- P 2.5 Fair outcomes
- P 2.5.1 Inequality in household income
XLSX: 60 KB- P 2.5.1 Inequality in household income - Additional boundaries
XLSX: 212 KB
- P 2.5.1 Inequality in household income - Additional boundaries
- P 2.5.1 Inequality in household income
- P 2.6 International economic engagement
- P 2.6.1 International visits to resident ratio
XLSX: 21 KB
- P 2.6.1 International visits to resident ratio
- P 2.1 Opportunities
Environment
- Progress 3: Environment
PDF: 2813 KB- P 3.1 Healthy natural environment
- P 3.1.1. Air pollution
XLSX: 17 KB
- P 3.1.1. Air pollution
- P 3.2 Appreciating the environment
- P 3.2.1 Domestic trips involving nature activities
XLSX: 25 KB
- P 3.2.1 Domestic trips involving nature activities
- P 3.3 Protecting the environment
- P 3.3.1 Protected areas of land
XLSX: 90 KB
- P 3.3.1 Protected areas of land
- P 3.4 Sustaining the environment
- P 3.4.1 Greenhouse gas emissions
XLSX: 19 KB
- P 3.4.1 Greenhouse gas emissions
- P 3.5 Healthy built environments
- P 3.5.1 Average commuting time
XLSX: 24 KB - P 3.5.2 Active travel
XLSX: 72 KB- P 3.5.2 Active travel - Additional boundaries
XLSX: 325 KB
- P 3.5.2 Active travel - Additional boundaries
- P 3.5.3 Number of solar panel systems
XLSX: 34 KB- P 3.5.3 Number of solar panel systems - Additional boundaries
XLSX: 109 KB
- P 3.5.3 Number of solar panel systems - Additional boundaries
- P 3.5.1 Average commuting time
- P 3.1 Healthy natural environment
Governance
- Progress 4: Governance
PDF: 2583 KB- P 4.1 Trust
- P 4.1.1 Generalised trust
XLSX: 38 KB - P 4.1.2 Informal votes
XLSX: 19 KB
- P 4.1.1 Generalised trust
- P 4.2 Participation
- P 4.2.1 Voter turnout
XLSX: 19 KB - P 4.2.2 Participation in a civic or political group
XLSX: 24 KB - P 4.2.3 Uptake of Australian citizenship
XLSX: 33 KB- P 4.2.3 Uptake of Australian citizenship - Additional boundaries
XLSX: 270 KB
- P 4.2.3 Uptake of Australian citizenship - Additional boundaries
- P 4.2.1 Voter turnout
- P 4.1 Trust
Population and demographics
- Context 1: Population and Demographics
PDF: 3020 KB- C 1.1 Population
- C 1.1.1 Estimated resident population
XLSX: 107 KB- C 1.1.1 Estimated resident population - Additional boundaries
XLSX: 549 KB
- C 1.1.1 Estimated resident population - Additional boundaries
- C 1.1.2 Population projections
XLSX: 28 KB- C 1.1.2 Population projections - Additional boundaries
XLSX: 149 KB
- C 1.1.2 Population projections - Additional boundaries
- C 1.1.3 Internal migration
XLSX: 24 KB - C 1.1.4 Overseas arrivals
XLSX: 34 KB- C 1.1.4 Overseas arrivals - Additional boundaries
XLSX: 225 KB
- C 1.1.4 Overseas arrivals - Additional boundaries
- C 1.1.5 Aboriginal and Torres Strait Islander people
XLSX: 34 KB- C 1.1.5 Aboriginal and Torres Strait Islander people - Additional boundaries
XLSX: 219 KB
- C 1.1.5 Aboriginal and Torres Strait Islander people - Additional boundaries
- C 1.1.1 Estimated resident population
- C 1.2 Age structure
- C 1.2.1 Age profile
XLSX: 47 KB- C 1.2.1 Age profile - Additional boundaries
XLSX: 364 KB
- C 1.2.1 Age profile - Additional boundaries
- C 1.2.2 Proportion of people who are working age
XLSX: 36 KB- C 1.2.2 Proportion of people who are working age - Additional boundaries
XLSX: 520 KB
- C 1.2.2 Proportion of people who are working age - Additional boundaries
- C 1.2.1 Age profile
- C 1.3 Housing
- C 1.3.1 Average household size
XLSX: 33 KB- C 1.3.1 Average household size - Additional boundaries
XLSX: 265 KB
- C 1.3.1 Average household size - Additional boundaries
- C 1.3.2 Multi-unit dwellings
XLSX: 34 KB- C 1.3.2 Multi-unit dwellings - Additional boundaries
XLSX: 226 KB
- C 1.3.2 Multi-unit dwellings - Additional boundaries
- C 1.3.4 Dwelling approvals
XLSX: 153 KB- C 1.3.4 Dwelling approvals - Additional boundaries
XLSX: 286 KB
- C 1.3.4 Dwelling approvals - Additional boundaries
- C 1.3.1 Average household size
- C 1.4 Social characteristics
- C 1.4.1 People who speak a language other than English at home
XLSX: 33 KB- C 1.4.1 People who speak a language other than English at home - Additional boundaries
XLSX: 224 KB
- C 1.4.1 People who speak a language other than English at home - Additional boundaries
- C 1.4.2 People on selected pensions or allowances
XLSX: 32 KB- C 1.4.2 People on selected pensions or allowances - Additional boundaries
XLSX: 127 KB
- C 1.4.2 People on selected pensions or allowances - Additional boundaries
- C 1.4.3 Single parent families
XLSX: 32 KB- C 1.4.3 Single parent families - Additional boundaries
XLSX: 224 KB
- C 1.4.3 Single parent families - Additional boundaries
- C 1.4.1 People who speak a language other than English at home
- C 1.1 Population
Transport and infrastructure
- Context 2: Transport and Infrastructure
PDF: 2832 KB- C 2.1 Moving people
- C 2.1.1 Transport mode for journey to work
XLSX: 64 KB- C 2.1.1 Transport mode for journey to work - Additional boundaries
XLSX: 606 KB
- C 2.1.1 Transport mode for journey to work - Additional boundaries
- C 2.1.2 Passengers through airports
XLSX: 96 KB - C 2.1.3 Dwellings with no motor vehicle
XLSX: 33 KB- C 2.1.3 Dwellings with no motor vehicle - Additional boundaries
XLSX: 223 KB
- C 2.1.3 Dwellings with no motor vehicle - Additional boundaries
- C 2.1.4 Kilometres travelled by passenger vehicles
XLSX: 28 KB - C 2.1.5 Road speed performance
XLSX: 16 KB
- C 2.1.1 Transport mode for journey to work
- C 2.2 Moving freight
- C 2.2.1 Road freight activity
XLSX: 43 KB - C 2.2.2 Volume of freight through ports
XLSX: 93 KB - C 2.2.3 Value of international freight through ports
XLSX: 20 KB
- C 2.2.1 Road freight activity
- C 2.3 Communications and utilities
- C 2.3.1 Dwellings with an internet connection
XLSX: 34 KB- C 2.3.1 Dwellings with an internet connection -Additional boundaries
XLSX: 226 KB
- C 2.3.1 Dwellings with an internet connection -Additional boundaries
- C 2.3.2 Residential water supply
XLSX: 16 KB
- C 2.3.1 Dwellings with an internet connection
- C 2.4 Land use
- C 2.4.1 Land area and land use
XLSX: 38 KB
- C 2.4.1 Land area and land use
- C 2.1 Moving people
Industry and innovation
- Context 3: Industry and Innovation
PDF: 2751 KB- C 3.1 Industry
- C 3.1.1 Top employing industry
XLSX: 34 KB - C 3.1.2 Main growth and decline industry
XLSX: 27 KB - C 3.1.3 Structural change index
XLSX: 21 KB
- C 3.1.1 Top employing industry
- C 3.2 Business activity
- C 3.2.1 Actively trading businesses
XLSX: 43 KB- C 3.2.1 Actively trading businesses - Additional boundaries
XLSX: 370 KB
- C 3.2.1 Actively trading businesses - Additional boundaries
- C 3.2.2 Business size
XLSX: 39 KB- C 3.2.2 Business size - Additional boundaries
XLSX: 757 KB
- C 3.2.2 Business size - Additional boundaries
- C 3.2.1 Actively trading businesses
- C 3.3 Innovation
- C 3.3.1 Employment in knowledge-intensive service industries
XLSX: 25 KB
- C 3.3.1 Employment in knowledge-intensive service industries
- C 3.1 Industry
Relationship between transport use and income in Australia
This Information Sheet explores the relationship between income and transport use in Australia by identifying the nature of the relationship between income and different types of transport use, and how public transport use (especially rail) varies with income in different locations. The information presented in this publication will be useful to understand the equity implications of government investment in transport infrastructure, particularly new urban rail infrastructure and implementation of regional development policy for regional cities located within commuting distance of the capital cities.
- Relationship between transport use and income in Australia