Freightline 6—Australian rice freight transport
The Freightline series is intended to provide information on interregional freight movements across Australia, filling a major gap in Australian transport-related data and information, to help better inform and support policy development and infrastructure planning. Freightline 1 provides a broad overview of the freight task. Subsequent issues consider specific commodity freight tasks, and include more detailed information about the size and location of major freight movements, supply chain composition and key infrastructure components. This issue (Freightline 6) focusses on Australian rice transport supply chains and freight movements in 2015–16.
- Freightline 6–Australian rice freight transport
Australian Sea Freight 2015–16
This is the latest in a series of Bureau of Infrastructure, Transport and Regional Economics (BITRE) reports that provide information on Australian sea freight movements, vessel activity, the use of coastal trading licences, and the size and composition of the Australian trading fleet. This report contains statistics on maritime freight and shipping activities in Australia from 2006–07 to 2015–16.
Bass Strait Passenger Vehicle Equalisation Scheme Monitoring Report No. 16
The Australian Government spent $44.7 million in 2016–17 on the Bass Strait Passenger Vehicle Equalisation Scheme (the Scheme), and $44.1 million in 2015–16.
Under the Scheme passengers travelling with a vehicle across Bass Strait can receive a rebate applied against the vehicle fare charged by a ferry operator.
Over the two-year monitoring period we estimate that:
- The number of sea passengers with a motor vehicle may have been 29.0% higher than without the Scheme.
- Just under 26 450 additional visitors to Tasmania travelled by sea due to the Scheme in 2016–17 (27 650 new visitors in 2015–16).
These additional visitors to Tasmania spent an estimated $71.4 million in 2016–17 ($74.6 million in 2015–16).
Tasmanian Freight Equalisation Scheme - Review of the expanded component: Final Report
In March 2015 the Australian Government responded to the Productivity Commission's (2014) Tasmanian Shipping and Freight Report by announcing the Tasmanian Freight Equalisation Scheme (TFES) would be expanded from 1 January 2016 to provide assistance to goods going to markets not previously covered by the Scheme.
The announcement included a new monitoring process, with the Bureau of Infrastructure, Transport and Regional Economics (BITRE) to conduct an initial review of the expanded component in 2017 (this review). Thereafter, monitoring of the expanded component will become part of the BITRE's general TFES monitoring reviews commencing in 2019.
In terms of the level and appropriateness of the flat rate for the expanded component, BITRE's finding in this 2017 review are that:
- There is little relevant information on overall rate trends for freight shipped due to a limited claims history and many destinations.
- The appropriate benchmark for freight costs is the shipping cost across Bass Strait as, to be eligible, freight must be transhipped via an Australian mainland port.
BITRE sought public comment on a draft of this review in December 2017. Two submissions were received (including one after the finalisation of the report).
The Australian Government's response is available here.
Freightline 5—Australian cotton freight transport
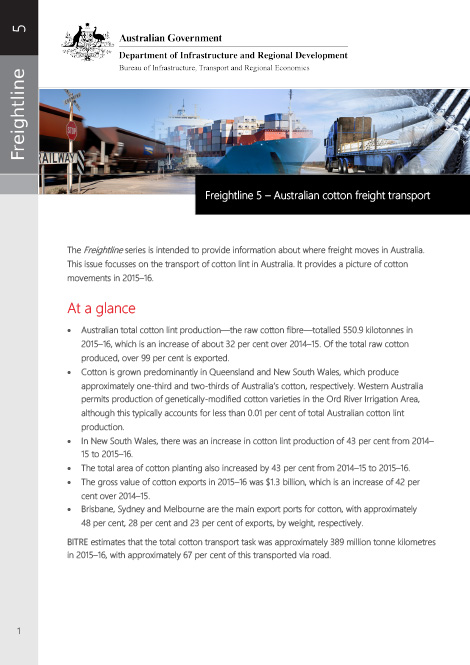
The Freightline series is intended to provide information on interregional freight movements across Australia, filling a major gap in Australian transport-related data and information, to help better inform and support policy development and infrastructure planning. Freightline 1 provides a broad overview of the freight task. Subsequent issues consider specific commodity freight tasks, and include more detailed information about the size and location of major freight movements, supply chain composition and key infrastructure components. This issue (Freightline 5) focusses on Australian cotton transport supply chains and freight movements in 2015–16.
- Freightline 5–Australian cotton freight transport
Waterline 61—December 2017
Waterline reports on trends in (a) throughput, (b) container handling productivity on the waterfront and the land side of ports in Australia, and (c) the cost of importing and exporting containers via five container ports. It covers both the loading and unloading of container ships and the transport of containers from container terminals.
This issue covers port terminal activity up to the June quarter 2017.
- Waterline No 61
- Container Terminal Throughput
- Container Terminal Productivity
- VBS TAS Operations
- Port Interface Cost Index
- Time Series Tables


Australian Infrastructure Statistics—Yearbook 2017
The Australian infrastructure statistics yearbook provides a comprehensive evidence base to examine long-term and emerging trends as well as inform policy development and regulatory reform in the transport, energy, water and communications sectors. It is the only comprehensive source of time series statistics for Australia's major areas of economic infrastructure. The yearbook is accompanied by the Key Australian Infrastructure Statistics Booklet which is a summary of statistics from the yearbook.
- Yearbook 2017–Australian Infrastructure Statistics
- Key Australian Infrastructure Statistics 2017
- Australian Infrastructure Statistics Yearbook 2017 Part I–Infrastructure and the Economy
- Australian Infrastructure Statistics Yearbook 2017 Part T–Transport
- Australian Infrastructure Statistics Yearbook 2017 Part E–Energy
- Australian Infrastructure Statistics Yearbook 2017 Part C–Communication
- Australian Infrastructure Statistics Yearbook 2017 Part W–Water
Progress in Australian Regions Yearbook 2017
This is not the latest release. View the latest release
The Progress in Australian Regions–Yearbook is a statistical resource that measures progress in a region against social, economic, environmental and governance indicators. The Yearbook brings together information about Australia's regions from a range of different sources and presents that data in a consistent format over time.
This fourth edition updates information from previous editions of the Yearbook and is incorporating newly released data from the 2016 Census where appropriate.
Update (July 2018): New Excel files have been added with additional geographic boundaries, where data is available at that scale (Local Government Areas, Statistical Urban Areas, Statistical Areas Level 2, Statistical Areas Level 3). These are additional to the data in the published Yearbook.
Note that data for areas with very small populations should be used with caution, as small numbers can be significantly impacted by random adjustment.
- Progress in Australian Regions Yearbook 2017
- Introduction
- Foreword
- Contents, list of tables, list of figures
Progress indicators
Contextual indicators
Appendices
- Abbreviations and acronyms; Endnotes and definitions; and References
Previous yearbooks
- Progress in Australian Regions–Yearbook 2016
- Progress in Australian Regions–Yearbook 2015
- Progress in Australian Regions–Yearbook 2014
Society
- Progress 1: Society
- P 1.1 Health and wellbeing
- P 1.1.1 Life expectancy at birth
- P 1.1.2 Psychological distress
- P 1.1.3 Suicide rate
- P 1.1.4 Overweight or obese
- P 1.1.5 Physical activity
- P 1.1.6 Smoking rates
- P 1.1.1 Life expectancy at birth
- P 1.2 Close relationships
- P 1.2.1 Children developmentally vulnerable due to physical health and wellbeing
- P 1.2.1 Children developmentally vulnerable due to physical health and wellbeing
- P 1.3 Home
- P 1.3.1 Homelessness
- P 1.3.1 Homelessness–Additional boundaries
- P 1.3.1 Homelessness–Additional boundaries
- P 1.3.2 Overcrowded conditions
- P 1.3.2 Overcrowded conditions–Additional boundaries
- P 1.3.2 Overcrowded conditions–Additional boundaries
- P 1.3.3 Households that own their own home
- P 1.3.3 Households that own their own home–Additional boundaries
- P 1.3.3 Households that own their own home–Additional boundaries
- P 1.3.4 Recognising traditional country
- P 1.3.1 Homelessness
- P 1.4 Safety
- P 1.4.1 Victims of physical assault
- P 1.4.2 Victims of malicious property damage
- P 1.4.3 Road fatalities
- P 1.4.1 Victims of physical assault
- P 1.5 Learning and knowledge
- P 1.5.1 Vocational or higher educational qualifications
- P 1.5.1 Vocational or higher educational qualifications–Additional boundaries
- P 1.5.1 Vocational or higher educational qualifications–Additional boundaries
- P 1.5.2 Year 5 and 9 reading standards
- P 1.5.3 Year 5 and 9 numeracy standards
- P 1.5.1 Vocational or higher educational qualifications
- P 1.6 Community connections
- P 1.6.1 Voluntary work
- P 1.6.1 Voluntary work–Additional boundaries
- P 1.6.1 Voluntary work–Additional boundaries
- P 1.6.1 Voluntary work
- P 1.7 Fair opportunity
- P 1.7.1 Disposable household income for low and middle income households
- P 1.7.1 Disposable household income for low and middle income households
- P 1.8 Enriched lives
- P 1.8.1 Unpaid help
- P 1.8.2 Attendance at cultural venues and events
- P 1.8.1 Unpaid help
- P 1.1 Health and wellbeing
Economy
- Progress 2: Economy
- P 2.1 Opportunities
- P 2.1.1 Having a qualification or working in a skilled occupation
- P 2.1.1 Having a qualification or working in a skilled occupation–Additional boundaries
- P 2.1.1 Having a qualification or working in a skilled occupation–Additional boundaries
- P 2.1.2 Young people earning or learning
- P 2.1.2 Young people earning or learning–Additional boundaries
- P 2.1.2 Young people earning or learning–Additional boundaries
- P 2.1.3 New business entry rate
- P 2.1.3 New business entry rate–Additional boundaries
- P 2.1.3 New business entry rate–Additional boundaries
- P 2.1.1 Having a qualification or working in a skilled occupation
- P 2.2 Jobs
- P 2.2.1 Employed persons
- P 2.2.1 Employed persons–Additional boundaries
- P 2.2.1 Employed persons–Additional boundaries
- P 2.2.2 Unemployment rate
- P 2.2.2 Unemployment rate–Additional boundaries
- P 2.2.2 Unemployment rate–Additional boundaries
- P 2.2.3 Youth unemployment rate
- P 2.2.3 Youth unemployment rate–Additional boundaries
- P 2.2.3 Youth unemployment rate–Additional boundaries
- P 2.2.1 Employed persons
- P 2.3 A resilient economy
- P 2.3.1 Proportion of unemployed persons unemployed for 12 months or more
- P 2.3.2 Labour force underutilisation rate
- P 2.3.3 Value of new building approvals
- P 2.3.1 Proportion of unemployed persons unemployed for 12 months or more
- P 2.4 Enhanced living standards
- P 2.4.1 Real median weekly household income
- P 2.4.2 Real household net worth
- P 2.4.3 Labour force participation
- P 2.4.3 Labour force participation–Additional boundaries
- P 2.4.3 Labour force participation–Additional boundaries
- P 2.4.1 Real median weekly household income
- P 2.5 Fair outcomes
- P 2.5.1 Inequality in household income
- P 2.5.1 Inequality in household income–Additional boundaries
- P 2.5.1 Inequality in household income–Additional boundaries
- P 2.5.1 Inequality in household income
- P 2.6 International economic engagement
- P 2.6.1 International visits to resident ratio
- P 2.6.1 International visits to resident ratio
- P 2.1 Opportunities
Environment
- Progress 3: Environment
- P 3.1 Healthy natural environment
- P 3.1.1. Air pollution
- P 3.1.1. Air pollution
- P 3.2 Appreciating the environment
- P 3.2.1 Domestic trips involving nature activities
- P 3.2.1 Domestic trips involving nature activities
- P 3.3 Protecting the environment
- P 3.3.1 Protected areas of land
- P 3.3.1 Protected areas of land
- P 3.4 Sustaining the environment
- P 3.4.1 Greenhouse gas emissions from road transport
- P 3.4.1 Greenhouse gas emissions from road transport
- P 3.5 Healthy built environments
- P 3.5.1 Average commuting time
- P 3.5.2 Active travel
- P 3.5.2 Active travel–Additional boundaries
- P 3.5.2 Active travel–Additional boundaries
- P 3.5.3 Number of solar panel systems
- P 3.5.3 Number of solar panel systems–Additional boundaries
- P 3.5.3 Number of solar panel systems–Additional boundaries
- P 3.5.1 Average commuting time
- P 3.1 Healthy natural environment
Governance
- Progress 4: Governance
- P 4.1 Trust
- P 4.1.1 Generalised trust
- P 4.1.2 Informal votes
- P 4.1.1 Generalised trust
- P 4.2 Participation
- P 4.2.1 Voter turnout
- P 4.2.2 Participation in a civic or political group
- P 4.2.3 Uptake of Australian citizenship
- P 4.2.3 Uptake of Australian citizenship–Additional boundaries
- P 4.2.3 Uptake of Australian citizenship–Additional boundaries
- P 4.2.1 Voter turnout
- P 4.1 Trust
Population and demographics
- Context 1: Population and demographics
- C 1.1 Population
- C 1.1.1 Estimated resident population
- C 1.1.1 Estimated resident population–additional boundries
- C 1.1.1 Estimated resident population–additional boundries
- C 1.1.2 Population projections
- C 1.1.2 Population projections–Additional boundaries
- C 1.1.2 Population projections–Additional boundaries
- C 1.1.3 Internal migration
- C 1.1.4 Overseas arrivals
- C 1.1.4 Overseas arrivals–Additional boundaries
- C 1.1.4 Overseas arrivals–Additional boundaries
- C 1.1.5 Aboriginal and Torres Strait Islander people
- C 1.1.5 Aboriginal and Torres Strait Islander people–Additional boundaries
- C 1.1.5 Aboriginal and Torres Strait Islander people–Additional boundaries
- C 1.1.1 Estimated resident population
- C 1.2 Age structure
- C 1.2.1 Age profile
- C 1.2.1 Age profile–Additional boundaries
- C 1.2.1 Age profile–Additional boundaries
- C 1.2.2 Proportion of people who are working age
- C 1.2.2 Proportion of people who are working age–Additional boundaries
- C 1.2.2 Proportion of people who are working age–Additional boundaries
- C 1.2.1 Age profile
- C 1.3 Housing
- C 1.3.1 Average household size
- C 1.3.1 Average household size–Additional boundaries
- C 1.3.1 Average household size–Additional boundaries
- C 1.3.2 Multi-unit dwellings
- C 1.3.2 Multi-unit dwellings–Additional boundaries
- C 1.3.2 Multi-unit dwellings–Additional boundaries
- C 1.3.4 Dwelling approvals
- C 1.3.4 Dwelling approvals–Additional boundaries
- C 1.3.4 Dwelling approvals–Additional boundaries
- C 1.3.1 Average household size
- C 1.4 Social characteristics
- C 1.4.1 People who speak a language other than English at home
- C 1.4.1 People who speak a language other than English at home–Additional boundaries
- C 1.4.1 People who speak a language other than English at home–Additional boundaries
- C 1.4.2 People on selected pensions or allowances
- C 1.4.2 People on selected pensions or allowances–Additional boundaries
- C 1.4.2 People on selected pensions or allowances–Additional boundaries
- C 1.4.3 Single parent families
- C 1.4.3 Single parent families–Additional boundaries
- C 1.4.3 Single parent families–Additional boundaries
- C 1.4.1 People who speak a language other than English at home
- C 1.1 Population
Transport and infrastructure
- Context 2: Transport and infrastructure
- C 2.1 Moving people
- C 2.1.1 Transport mode for journey to work
- C 2.1.1 Transport mode for journey to work–Additional boundaries
- C 2.1.1 Transport mode for journey to work–Additional boundaries
- C 2.1.2 Passengers through airports
- C 2.1.3 Dwellings with no motor vehicle
- C 2.1.3 Dwellings with no motor vehicle–Additional boundaries
- C 2.1.3 Dwellings with no motor vehicle–Additional boundaries
- C 2.1.4 Kilometres travelled by passenger vehicles
- C 2.1.5 Network delays due to congestion
- C 2.1.1 Transport mode for journey to work
- C 2.2 Moving freight
- C 2.2.1 Road freight activity
- C 2.2.2 Volume of freight through ports
- C 2.2.3 Value of international freight through ports
- C 2.2.1 Road freight activity
- C 2.3 Communications and utilities
- C 2.3.1 Dwellings with an internet connection
- C 2.3.1 Dwellings with an internet connection–Additional boundaries
- C 2.3.1 Dwellings with an internet connection–Additional boundaries
- C 2.3.2 Residential water supply
- C 2.3.1 Dwellings with an internet connection
- C 2.4 Land use
- C 2.4.1 Land area and land use
- C 2.4.1 Land area and land use
- C 2.1 Moving people
Industry and innovation
- Context 3: Industry and Innovation
- C 3.1 Industry
- C 3.1.1 Top employing industry
- C 3.1.2 Main growth and decline industry
- C 3.1.3 Structural change index
- C 3.1.1 Top employing industry
- C 3.2 Business activity
- C 3.2.1 Actively trading businesses
- C 3.2.1 Actively trading businesses–Additional boundaries
- C 3.2.1 Actively trading businesses–Additional boundaries
- C 3.2.2 Business size
- C 3.2.2 Business size–Additional boundaries
- C 3.2.2 Business size–Additional boundaries
- C 3.2.1 Actively trading businesses
- C 3.3 Innovation
- C 3.3.1 Employment in knowledge-intensive industries
- C 3.3.1 Employment in knowledge-intensive industries
- C 3.1 Industry
Trainline is a compendium of Australia's railways. The compendium provides insights, analysis, and an understanding of the railway industry. Australia's railways are evolving, with changes both outside and within the industry. These changes include logistics, commodity flows, technology, urban patronage, and regional passenger services. The publication presents an overview and data on railway transport tasks performed; characteristics of the railways and train operators' rolling stock that runs; and aspects of railway performance, including safety, environment and reliability.
- TrainLine 5
Road Safety in Australia–Fact Sheet
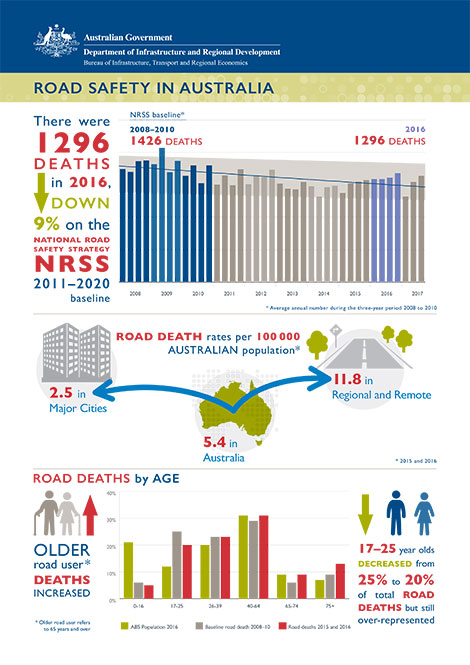
This fact sheet provides key road fatality data for 2015 and 2016, and how some key statistics have changed since the base years (2008 to 2010) of the National Road Safety Strategy 2011–2020.
- Road Safety in Australia–Fact Sheet