
Greenhouse gas abatement potential of the Australian transport sector—Technical report
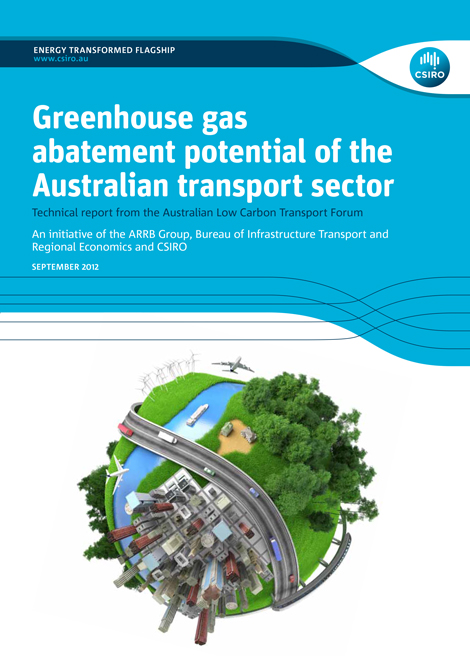
The Australian Low Carbon Transport Forum (ALCTF) was initiated by a project secretariat comprising ARRB Group, BITRE and CSIRO. It was organised to bring together knowledge on the options for greenhouse gas abatement in transport and explore how deeply emissions could be cut in the sector.
A report describing the main findings of the study has been published under the title Greenhouse gas abatement potential of the Australian transport sector: Summary report.
This current Technical Report is a companion document to the Summary Report, and aims to detail the methodology and results of the ALCTF process. That is, it describes how the estimated levels of abatement were calculated for each of the abatement options considered in the ALCFT workshops, and how the various abatement potentials were aggregated into an estimate for the maximal potential reduction.
- Greenhouse gas abatement potential of the Australian transport sector–Technical report
Progress in Australian Regions Yearbook 2017
The Progress in Australian Regions–Yearbook is a statistical resource that measures progress in a region against social, economic, environmental and governance indicators. The Yearbook brings together information about Australia's regions from a range of different sources and presents that data in a consistent format over time.
This fourth edition updates information from previous editions of the Yearbook and is incorporating newly released data from the 2016 Census where appropriate.
Update (July 2018): New Excel files have been added with additional geographic boundaries, where data is available at that scale (Local Government Areas, Statistical Urban Areas, Statistical Areas Level 2, Statistical Areas Level 3). These are additional to the data in the published Yearbook.
Note that data for areas with very small populations should be used with caution, as small numbers can be significantly impacted by random adjustment.
- Progress in Australian Regions Yearbook 2017
- Introduction
- Foreword
- Contents, list of tables, list of figures
Progress indicators
Contextual indicators
Appendices
- Abbreviations and acronyms; Endnotes and definitions; and References
Previous yearbooks
- Progress in Australian Regions–Yearbook 2016
- Progress in Australian Regions–Yearbook 2015
- Progress in Australian Regions–Yearbook 2014
Society
- Progress 1: Society
- P 1.1 Health and wellbeing
- P 1.1.1 Life expectancy at birth
- P 1.1.2 Psychological distress
- P 1.1.3 Suicide rate
- P 1.1.4 Overweight or obese
- P 1.1.5 Physical activity
- P 1.1.6 Smoking rates
- P 1.2 Close relationships
- P 1.2.1 Children developmentally vulnerable due to physical health and wellbeing
- P 1.3 Home
- P 1.3.1 Homelessness
- P 1.3.1 Homelessness–Additional boundaries
- P 1.3.2 Overcrowded conditions
- P 1.3.2 Overcrowded conditions–Additional boundaries
- P 1.3.3 Households that own their own home
- P 1.3.3 Households that own their own home–Additional boundaries
- P 1.3.4 Recognising traditional country
- P 1.4 Safety
- P 1.4.1 Victims of physical assault
- P 1.4.2 Victims of malicious property damage
- P 1.4.3 Road fatalities
- P 1.5 Learning and knowledge
- P 1.5.1 Vocational or higher educational qualifications
- P 1.5.1 Vocational or higher educational qualifications–Additional boundaries
- P 1.5.2 Year 5 and 9 reading standards
- P 1.5.3 Year 5 and 9 numeracy standards
- P 1.6 Community connections
- P 1.6.1 Voluntary work
- P 1.6.1 Voluntary work–Additional boundaries
- P 1.7 Fair opportunity
- P 1.7.1 Disposable household income for low and middle income households
- P 1.8 Enriched lives
- P 1.8.1 Unpaid help
- P 1.8.2 Attendance at cultural venues and events
Economy
- Progress 2: Economy
- P 2.1 Opportunities
- P 2.1.1 Having a qualification or working in a skilled occupation
- P 2.1.1 Having a qualification or working in a skilled occupation–Additional boundaries
- P 2.1.2 Young people earning or learning
- P 2.1.2 Young people earning or learning–Additional boundaries
- P 2.1.3 New business entry rate
- P 2.1.3 New business entry rate–Additional boundaries
- P 2.2 Jobs
- P 2.2.1 Employed persons
- P 2.2.1 Employed persons–Additional boundaries
- P 2.2.2 Unemployment rate
- P 2.2.2 Unemployment rate–Additional boundaries
- P 2.2.3 Youth unemployment rate
- P 2.2.3 Youth unemployment rate–Additional boundaries
- P 2.3 A resilient economy
- P 2.3.1 Proportion of unemployed persons unemployed for 12 months or more
- P 2.3.2 Labour force underutilisation rate
- P 2.3.3 Value of new building approvals
- P 2.4 Enhanced living standards
- P 2.4.1 Real median weekly household income
- P 2.4.2 Real household net worth
- P 2.4.3 Labour force participation
- P 2.4.3 Labour force participation–Additional boundaries
- P 2.5 Fair outcomes
- P 2.5.1 Inequality in household income
- P 2.5.1 Inequality in household income–Additional boundaries
- P 2.6 International economic engagement
- P 2.6.1 International visits to resident ratio
Environment
- Progress 3: Environment
- P 3.1 Healthy natural environment
- P 3.1.1. Air pollution
- P 3.2 Appreciating the environment
- P 3.2.1 Domestic trips involving nature activities
- P 3.3 Protecting the environment
- P 3.3.1 Protected areas of land
- P 3.4 Sustaining the environment
- P 3.4.1 Greenhouse gas emissions from road transport
- P 3.5 Healthy built environments
- P 3.5.1 Average commuting time
- P 3.5.2 Active travel
- P 3.5.2 Active travel–Additional boundaries
- P 3.5.3 Number of solar panel systems
- P 3.5.3 Number of solar panel systems–Additional boundaries
Governance
- Progress 4: Governance
- P 4.1 Trust
- P 4.1.1 Generalised trust
- P 4.1.2 Informal votes
- P 4.2 Participation
- P 4.2.1 Voter turnout
- P 4.2.2 Participation in a civic or political group
- P 4.2.3 Uptake of Australian citizenship
- P 4.2.3 Uptake of Australian citizenship–Additional boundaries
Population and demographics
- Context 1: Population and demographics
- C 1.1 Population
- C 1.1.1 Estimated resident population
- C 1.1.1 Estimated resident population–additional boundries
- C 1.1.2 Population projections
- C 1.1.2 Population projections–Additional boundaries
- C 1.1.3 Internal migration
- C 1.1.4 Overseas arrivals
- C 1.1.4 Overseas arrivals–Additional boundaries
- C 1.1.5 Aboriginal and Torres Strait Islander people
- C 1.1.5 Aboriginal and Torres Strait Islander people–Additional boundaries
- C 1.2 Age structure
- C 1.2.1 Age profile
- C 1.2.1 Age profile–Additional boundaries
- C 1.2.2 Proportion of people who are working age
- C 1.2.2 Proportion of people who are working age–Additional boundaries
- C 1.3 Housing
- C 1.3.1 Average household size
- C 1.3.1 Average household size–Additional boundaries
- C 1.3.2 Multi-unit dwellings
- C 1.3.2 Multi-unit dwellings–Additional boundaries
- C 1.3.4 Dwelling approvals
- C 1.3.4 Dwelling approvals–Additional boundaries
- C 1.4 Social characteristics
- C 1.4.1 People who speak a language other than English at home
- C 1.4.1 People who speak a language other than English at home–Additional boundaries
- C 1.4.2 People on selected pensions or allowances
- C 1.4.2 People on selected pensions or allowances–Additional boundaries
- C 1.4.3 Single parent families
- C 1.4.3 Single parent families–Additional boundaries
Transport and infrastructure
- Context 2: Transport and infrastructure
- C 2.1 Moving people
- C 2.1.1 Transport mode for journey to work
- C 2.1.1 Transport mode for journey to work–Additional boundaries
- C 2.1.2 Passengers through airports
- C 2.1.3 Dwellings with no motor vehicle
- C 2.1.3 Dwellings with no motor vehicle–Additional boundaries
- C 2.1.4 Kilometres travelled by passenger vehicles
- C 2.1.5 Network delays due to congestion
- C 2.2 Moving freight
- C 2.2.1 Road freight activity
- C 2.2.2 Volume of freight through ports
- C 2.2.3 Value of international freight through ports
- C 2.3 Communications and utilities
- C 2.3.1 Dwellings with an internet connection
- C 2.3.1 Dwellings with an internet connection–Additional boundaries
- C 2.3.2 Residential water supply
- C 2.4 Land use
- C 2.4.1 Land area and land use
Industry and innovation
- Context 3: Industry and Innovation
- C 3.1 Industry
- C 3.1.1 Top employing industry
- C 3.1.2 Main growth and decline industry
- C 3.1.3 Structural change index
- C 3.2 Business activity
- C 3.2.1 Actively trading businesses
- C 3.2.1 Actively trading businesses–Additional boundaries
- C 3.2.2 Business size
- C 3.2.2 Business size–Additional boundaries
- C 3.3 Innovation
- C 3.3.1 Employment in knowledge-intensive industries
Fuel economy of Australian passenger vehicles—a regional perspective
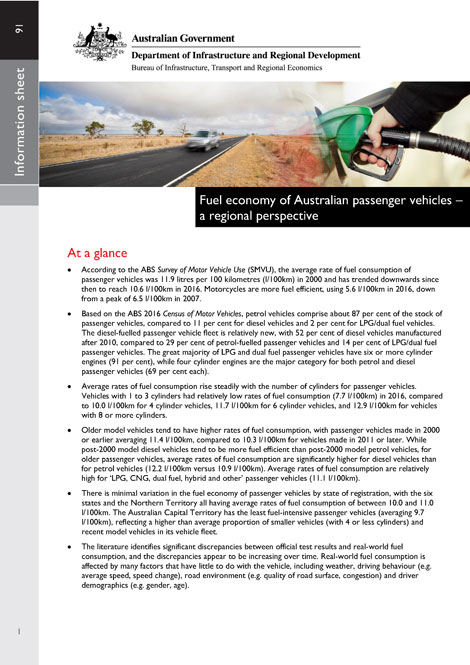
This information sheet presents Australian data on how realised rates of fuel consumption vary over time, and how the rates depend on key vehicle characteristics such as number of cylinders, fuel type and vehicle age. It also investigates state/territory differences in fuel economy and presents new small area estimates of the average rate of fuel consumption for Australia's regions.
These small area estimates are based on the composition of the passenger vehicle and motorcycle fleet in the region, and are derived at both the Statistical Area Level 3 (SA3) and Statistical Area Level 4 (SA4) scale. The key data sources are the Australian Bureau of Statistics (ABS) Survey of Motor Vehicle Use (SMVU) 2016 and the ABS Census of Motor Vehicles 2016.
- Fuel economy of Australian passenger vehicles–a regional perspective
Growth in the Australian Road System
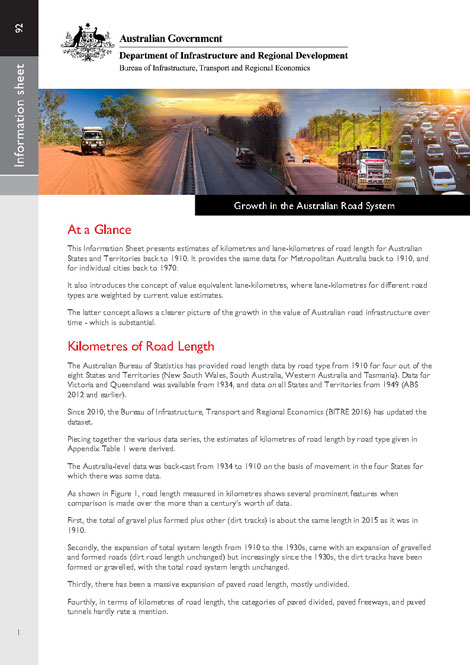
This information sheet presents estimates of Kilometres and lane-kilometres of road length for Australian States and Territories back to 1910. It provides the same data for Metropolitan Australia back to 1910, and for individual cities back to 1970.
It also introduces the concept of value equivalent lane-kilometres, where lane-kilometres for different road types are weighted by current value estimates.
The latter concept allows a clearer picture of the growth in the value of Australian road infrastructure over time–which is substantial.
- Growth in the Australian Road System
Infrastructure and Transport PPPs and Privatisation in Australia
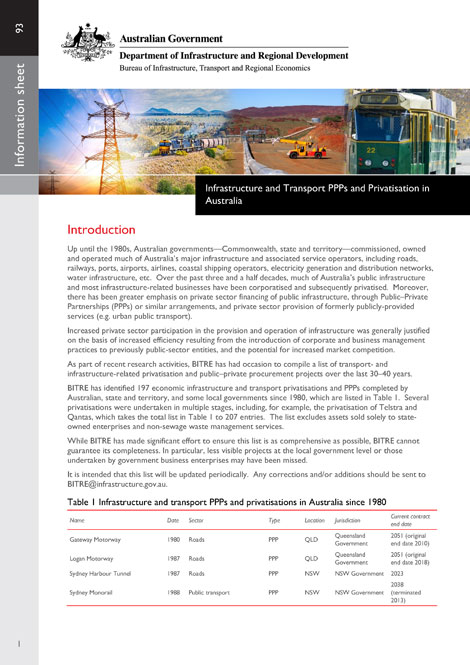
This information sheet provides a list of infrastructure and transport-related Public Private Partnerships and privatisations in Australia since 1980. To the Bureau of Infrastructure Transport and Regional Economics' (BITRE) knowledge, this is the most comprehensive list on the subject to date.
One hundred and ninety seven economic infrastructure assets have been privatised or procured through PPPs since 1980. Several privatisations were undertaken in multiple stages, including, for example, the privatisations of Telstra and Qantas. Including all these stages takes the total list to 207 entries. The list excludes assets sold solely to state-owned enterprises, and non-sewage waste management services.
- Infrastructure and Transport PPPs and Privatisation in Australia
Freight Rates in Australia
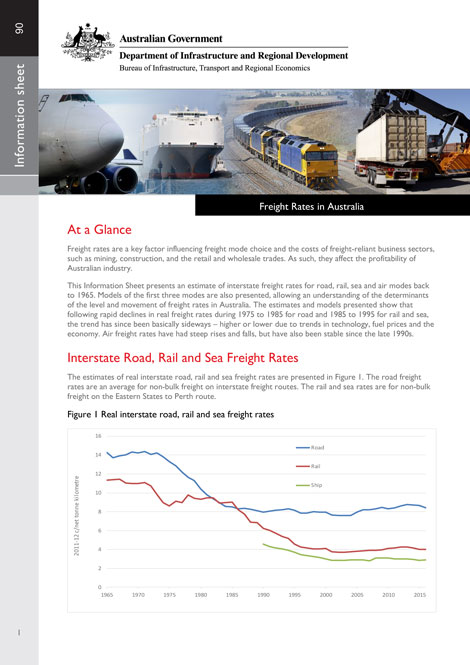
This Information Sheet presents an estimate of interstate freight rates for road, rail, sea and air modes back to 1965. Models of the first three modes are also presented, allowing an understanding of the determinants of the level and movement of freight rates in Australia.
The estimates and models presented show that following rapid declines in real freight rates during 1975 to 1985 for road and 1985 to 1995 for rail and sea, the trend has since been basically sideways–higher or lower due to trends in technology, fuel prices and the economy.
- Freight Rates in Australia
Spending by Australian households on owning and operating vehicles
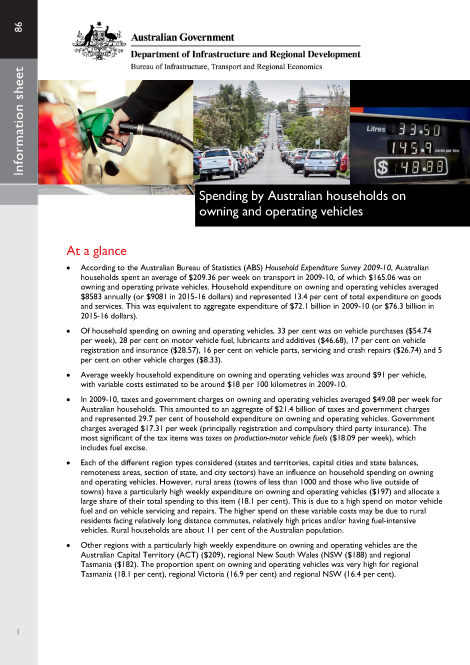
In this research, several elements of spending are examined, including the composition of that expenditure, the contribution of taxes and government charges, how the expenditure varies by broad region type and by key demographic characteristics, as well as the characteristics of those households with the greatest expenditure on owning and operating vehicles.
- Spending by Australian households on owning and operating vehicles
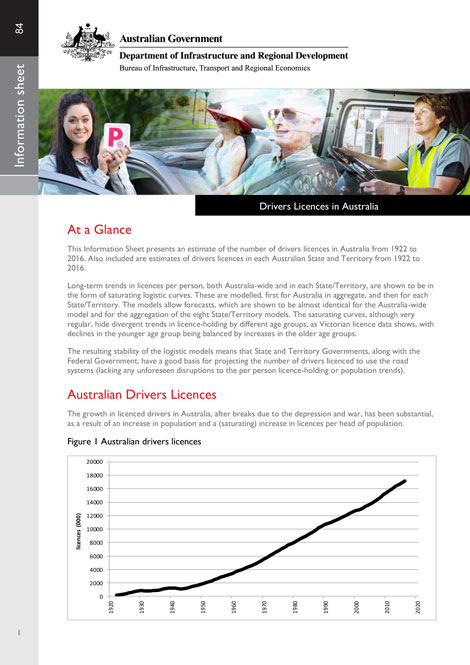
This information sheet presents an estimate of the number of drivers licences in Australia from 1922 to 2016. Also included are estimates of drivers licences in each Australian State and Territory from 1922 to 2016. Long-term trends in licences per person, both Australia-wide and in each State/Territory, are shown to be in the form of saturating logistic curves. These are modelled, first for Australian in aggregate, and then for each State/Territory.
- Drivers Licences in Australia
- State Licences 2018
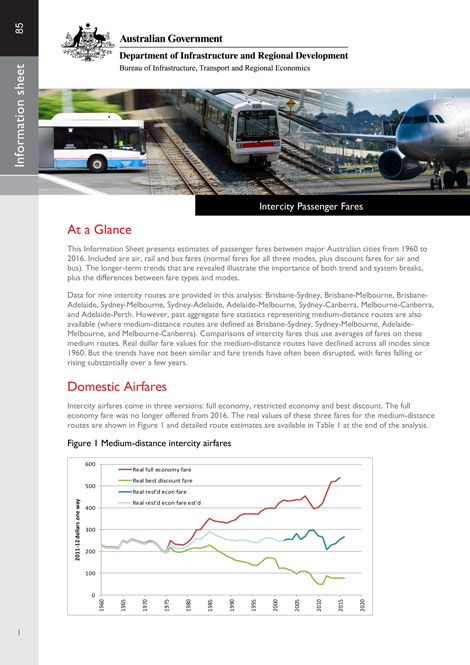
This information sheet presents estimates of air, rail and bus passenger fares between major Australian cities from 1960 to 2016. Data for nine intercity routes are provided in this analysis. Real dollar fare values for the medium-distance routes have declined across all modes since 1960 but the trends have not been similar and fare trends have often been disrupted.
- Intercity Passenger fares
Modelled Road Construction and maintenance Price Index
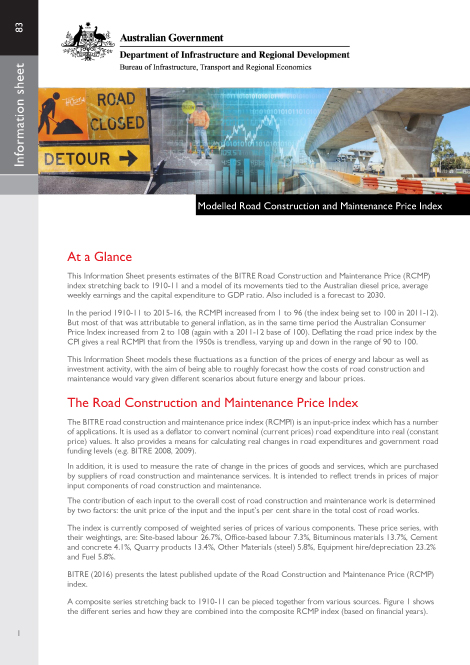
This information sheet presents estimates of the BITRE Road Construction and maintenance Price (RCMP) from 1910-11 and a model of its movements tied to the Australian diesel price, average weekly earnings and the capital expenditure to GDP ratio. Also included is a forecast to 2030.
- Modelled Road Construction and maintenance Price Index