
Freight vehicle congestion in Australia’s five major cities – 2021
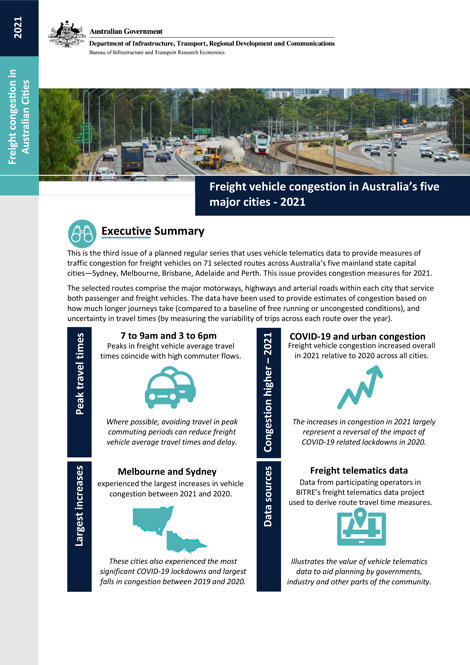
This publication is the third in the series that uses vehicle telematics data to provide measures of traffic congestion for freight vehicles for selected routes across Australia’s five mainland state capital cities—Sydney, Melbourne, Brisbane, Adelaide and Perth. The selected routes comprise the major motorways, highways and arterial roads within each city that service both passenger and freight vehicles. This release includes measures for 71 routes. The estimates presented in this report cover calendar year 2021, and include comparisons with 2020 traffic congestion levels.
The results show that freight vehicle congestion returned to pre-pandemic levels across all five mainland Australian capital cities in 2021, largely due to the return of commuter traffic in our cities, particularly during peak periods, following the impact of COVID-19 lockdowns in 2020. In particular, freight vehicle traffic congestion increases in 2021 were larger in Melbourne, and to a lesser extent Sydney, where lockdown-related reductions in congestion observed in 2020 were most significant. Relative to pre-COVID-19 congestion levels in 2019, freight vehicle congestion increases have been most significant in proportionate terms across Brisbane routes, even higher than experienced across Sydney and Melbourne routes. Brisbane routes also experienced the largest increases in average excess travel time variability (uncertainty) since 2019, greater than in Sydney and Melbourne. Copies of the data displayed in the report are available here and on data.gov.au.
Australian Infrastructure and Transport Statistics—Yearbook 2021
The aim of the Australian Infrastructure Statistics and Transport Yearbook is to provide a single, comprehensive annual source of infrastructure statistics for use by policymakers, industry leaders, transport analysts and the wider Australian community.
The publication is primarily a source of long-term, aggregate time series infrastructure statistics. Most statistics included in the publication are currently collected by BITRE or other Australian, state or territory government agencies.
The Yearbook has 11 chapters:
Freight vehicle congestion in Australia’s five major cities – 2020
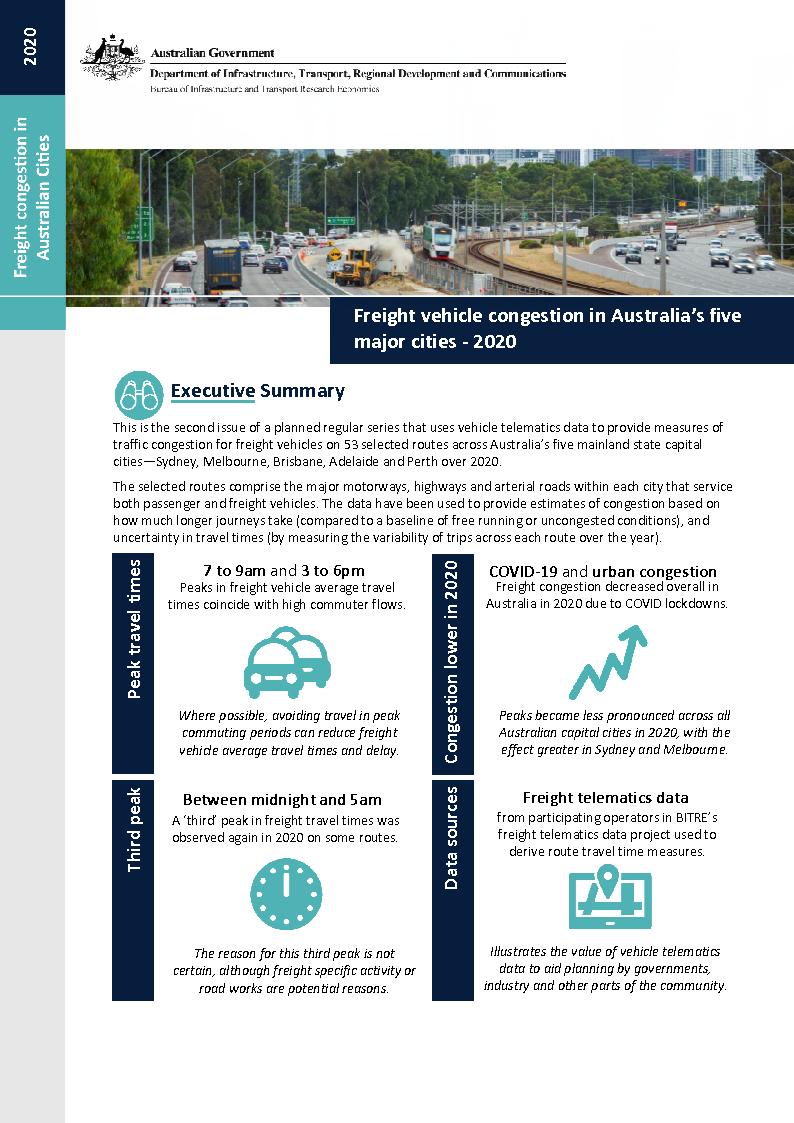
This publication is the second in a planned regular series that uses vehicle telematics data to provide measures of traffic congestion for freight vehicles on 53 selected routes across Australia’s five mainland state capital cities—Sydney, Melbourne, Brisbane, Adelaide and Perth. The selected routes comprise the major motorways, highways and arterial roads within each city that service both passenger and freight vehicles. The estimates presented in this report cover calendar year 2020, and includes a comparison with 2019 traffic congestion measures.
The results show that freight vehicle congestion decreased across all five mainland Australian capital cities in 2020, largely due to lower commuter activity on roads, particularly in peak periods, as a result of COVID-19 lockdowns. Whilst peak period travel times were less pronounced in 2020 across all cities, this effect was more significant in Sydney and Melbourne, because those cities had larger pre-COVID-19 traffic peaks and experienced longer lockdowns (particularly Melbourne), and less significant in other state capital cities. Copies of the data displayed in the report are available here and on data.gov.au.
Forecasting uptake of driver assistance technologies in Australia
This report uses an established modelling framework for forecasting the uptake of technologies that assist drivers and full vehicle automation in Australian light vehicles. Taking uncertainties into consideration, the report provides sensitivity analysis, based on several assumptions, to estimate the possible uptake of sales and fleet penetration till 2070. BITRE will maintain a watch on automated vehicles (AVs) as they are deployed and use the modelling framework to update its estimates when new information to inform forecasts becomes available.
- Forecasting uptake of driver assistance technologies in Australia [PDF: 7029 KB]
Archived Road Trauma Involving Heavy Vehicles—Annual Summaries
-
2020
-
2019
- 2018
- 2017
- 2016
- 2015
- 2014
- 2013
Archived international road safety comparisons—annual
- 2022
- 2020
- 2019
- 2018
- 2017
- 2016
- 2015
- 2014
- 2013
- 2012
- 2011
- 2010
- 2009
- 2007
- 2006
- 2005
- 2004
- 2003
- 2002
- 2001
- Monograph 6: Australia's International Road Safety Performance 1998
- Monograph 2: Australia's International Road Safety Performance 1997
- Pre-ATSB (FORS) Monograph 28: Australia's International Road Safety Performance 1996
- Pre-ATSB (FORS) Monograph 16: Australia's International Road Safety Performance
- CR 114: Trends in Road Crash Fatality Rates: International Comparisons with Australia 1970–1990 (1992)
Freight vehicle congestion in Australia’s five major cities - 2019
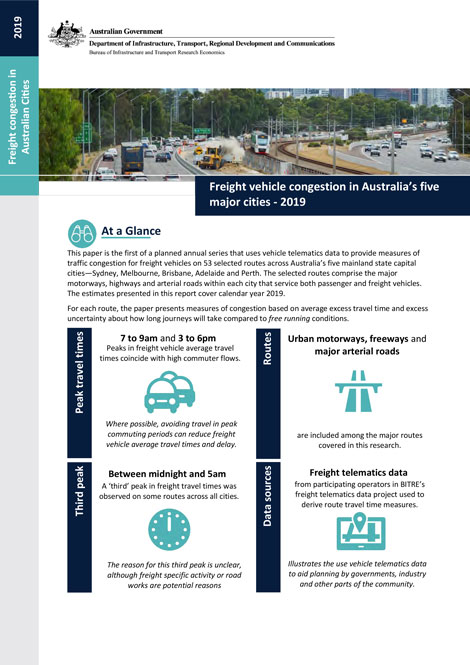
This publication is the first of a planned annual series that uses vehicle telematics data to provide measures of traffic congestion for freight vehicles on 53 selected routes across Australia’s five mainland state capital cities—Sydney, Melbourne, Brisbane, Adelaide and Perth. The selected routes comprise the major motorways, highways and arterial roads within each city that service both passenger and freight vehicles. The estimates presented in this report cover calendar year 2019.
The results show peaks in freight vehicle average travel times coincide with morning and evening peak commuter flows—for instance motorways tend to show morning peaks moving towards city CBDs and afternoon peaks moving away from it. Urban motorways exhibit more distinct travel time peak periods than non-motorway routes.
Archived road trauma Australia—annual summaries
Older issues of Road Trauma Australia—Annual Summaries are available below.
- 2022
- 2021
- 2020
- 2019
- 2018
- 2017
- 2016
- 2015
- 2014
- 2013
- 2012
- 2011
- 2010
- 2009
- 2008
- 2007
- 2006
- 2005
- 2004
- 2002
- 2001
Australia’s light vehicle fleet - some insights
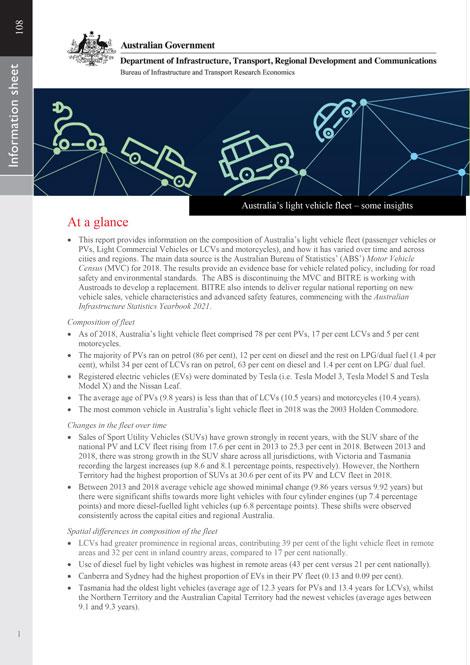
This Information Sheet investigates how the characteristics of Australia’s light vehicle fleet vary across different types of regions, including States/Territories, major cities, city sectors, region types, and small areas. Vehicle characteristics considered include fuel type, average age, cylinders and tare weight. Specific types of vehicles, such as electric vehicles, sports utility vehicles and utilities are also examined. The study also identifies recent changes in the composition of Australia’s light vehicle fleet.
Regional port catchments for road freight
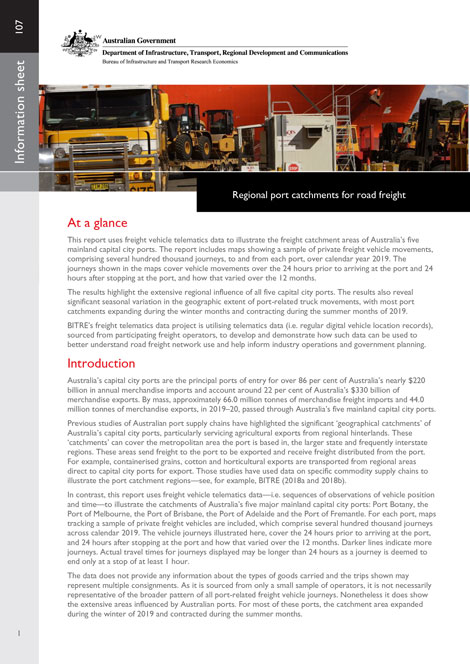
This Information Sheet uses freight vehicle telematics data to illustrate the freight catchment areas of Australia’s five mainland capital city ports. The report includes maps showing a sample of private freight vehicle movements, comprising several hundred thousand journeys, to and from each port, over calendar year 2019. The maps cover the 24 hours prior to arriving at the port and 24 hours after stopping at the port. The results highlight the extensive regional influence of all five capital city ports and also reveal significant seasonal variation in the geographic extent of port-related truck movements.