Bass Strait Passenger Vehicle Equalisation Scheme Monitoring Report No. 18
The Australian Government spent $77.7 million on the Bass Strait Passenger Vehicle Equalisation Scheme in the 2 years to June 2021 ($40.8 million in 2019–20 and $36.9 million in 2020–21).
Under the scheme passengers travelling with a vehicle across Bass Strait can receive a rebate applied against the vehicle fare charged by a ferry operator.
Waterline reports on trends in (a) throughput, (b) container handling productivity on the waterfront and the land side of ports in Australia, and (c) the cost of importing and exporting containers via five container ports. It covers both the loading and unloading of container ships and the transport of containers from container terminals.
This issue covers port terminal activity up to the June quarter 2021.
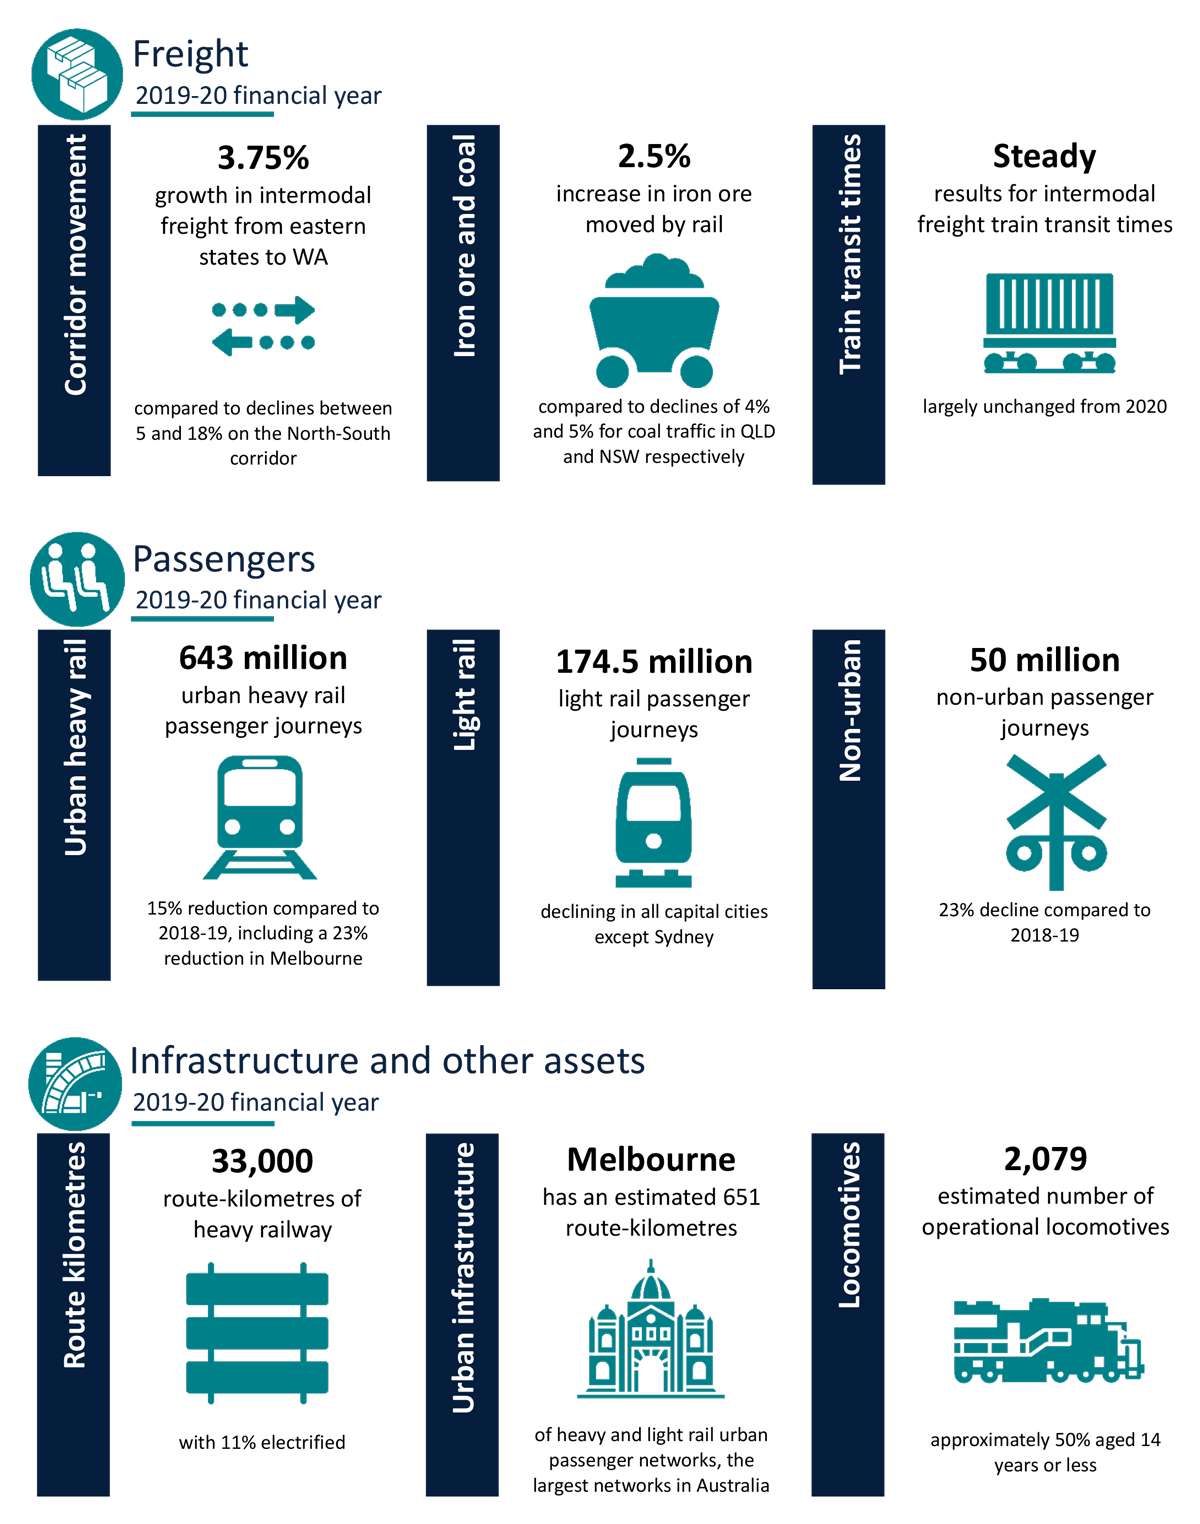
Trainline is a compendium of Australia's railways, providing insights, analysis and an understanding of the railway industry. Australia's railways are evolving, with changes within and outside the industry. These changes include logistics, commodity flows, technology, urban patronage and regional passenger services. The publication presents an overview and data on railway transport tasks performed; characteristics of the railways and train operators' rolling stock that runs; and aspects of railway performance including safety, environment and reliability.
Australian Infrastructure and Transport Statistics - Yearbook 2021
The aim of the Australian Infrastructure Statistics and Transport Yearbook is to provide a single, comprehensive annual source of infrastructure statistics for use by policymakers, industry leaders, transport analysts and the wider Australian community.
The publication is primarily a source of long-term, aggregate time series infrastructure statistics. Most statistics included in the publication are currently collected by BITRE or other Australian, state or territory government agencies.
The Yearbook has 11 chapters:
Waterline reports on trends in (a) throughput, (b) container handling productivity on the waterfront and the land side of ports in Australia, and (c) the cost of importing and exporting containers via five container ports. It covers both the loading and unloading of container ships and the transport of containers from container terminals.
This issue covers port terminal activity up to the December quarter 2020.
Archived Road Trauma Involving Heavy Vehicles—Annual Summaries
-
2020
-
2019
- 2018
- 2017
- 2016
- 2015
- 2014
- 2013
Archived International Road Safety Comparisons—Annual
- 2022
- 2020
- 2019
- 2018
- 2017
- 2016
- 2015
- 2014
- 2013
- 2012
- 2011
- 2010
- 2009
- 2007
- 2006
- 2005
- 2004
- 2003
- 2002
- 2001
- Monograph 6: Australia's International Road Safety Performance 1998
- Monograph 2: Australia's International Road Safety Performance 1997
- Pre-ATSB (FORS) Monograph 28: Australia's International Road Safety Performance 1996
- Pre-ATSB (FORS) Monograph 16: Australia's International Road Safety Performance
- CR 114: Trends in Road Crash Fatality Rates: International Comparisons with Australia 1970–1990 (1992)
Domestic aviation activity – cities and regions
This file provides data on Regular Public Transport (RPT) Domestic Aviation Activity in Australia by sector type.
Each sector is classified using the ABS Australian Statistical Geography Standard (ASGS) 2016 based on location of the airport pair.
‘Major Cities’ covers sectors between 2 airports located in Major Cities, ‘Regional’ covers sectors where at least one airport is in an Inner Regional or Outer Regional area, but no airports are in Remote or Very remote areas and ‘Remote’ covers sectors where at least one airport is in a Remote or Very Remote location.
Data are provided for Flights, Passenger trips, Seats, Revenue Passenger Kilometres (RPKs), Available Seat Kilometres (ASKs), Distance flown, Load factors (RPKs/ASKs), Distance per flight, Seats per flight, Number of operators and Number of sectors.
Raw data is available in the sheet called “Data”. Use the sheet called “Chart” to select a metric and see it as a chart. More information and definitions are provided in the sheet called “Notes”.
Archived Road Trauma Australia—Annual Summaries
Older issues of Road Trauma Australia—Annual Summaries are available below.
- 2022
- 2021
- 2020
- 2019
- 2018
- 2017
- 2016
- 2015
- 2014
- 2013
- 2012
- 2011
- 2010
- 2009
- 2008
- 2007
- 2006
- 2005
- 2004
- 2002
- 2001
Australian Sea Freight 2018-19
This is the latest in a series of Bureau of Infrastructure and Transport Research Economics (BITRE) reports that provide information on Australian sea freight movements, vessel activity, the use of coastal trading licences, and the size and composition of the Australian trading fleet. This report contains statistics on maritime freight and shipping activities in Australia from 2009–10 to 2018–19.
Import and export data up to 2020 has been made available through a visualisation on the National Freight Data Hub prototype website.