Australian Infrastructure and Transport Statistics Yearbook 2025: shipping chapter
Chapter 7: Shipping
- Australian Infrastructure and Transport Statistics Yearbook 2025 - Download PDF
- Shipping—Yearbook 2025 (124 KB) - Download Excel file
This chapter provides information on Australian ships, cargo, ports and fleet, including mileage, tonnage and number of vessels. The data is sourced from BITRE’s Australian Sea Freight publication, BITRE’s Waterline publication and BITRE estimates based on Lloyd's List Intelligence data.
- 9.1 million TEUs (twenty-foot equivalent units) were exchanged at container terminals in Brisbane, Sydney, Melbourne, Fremantle, and Adelaide in 2024–25.
- 32,142 port calls were made to Australian ports in 2024–25. The states with the highest number were Western Australia with 9,580 and Queensland with 8,244.
- 5,841 different cargo vessels visited Australian ports in 2024–25.
- There were 53 Australian registered vessels in the Australian trading fleet, including small vessels, and 83 overseas registered vessels in 2022–23.
Figure 14 Principal Australian ports, by commodity
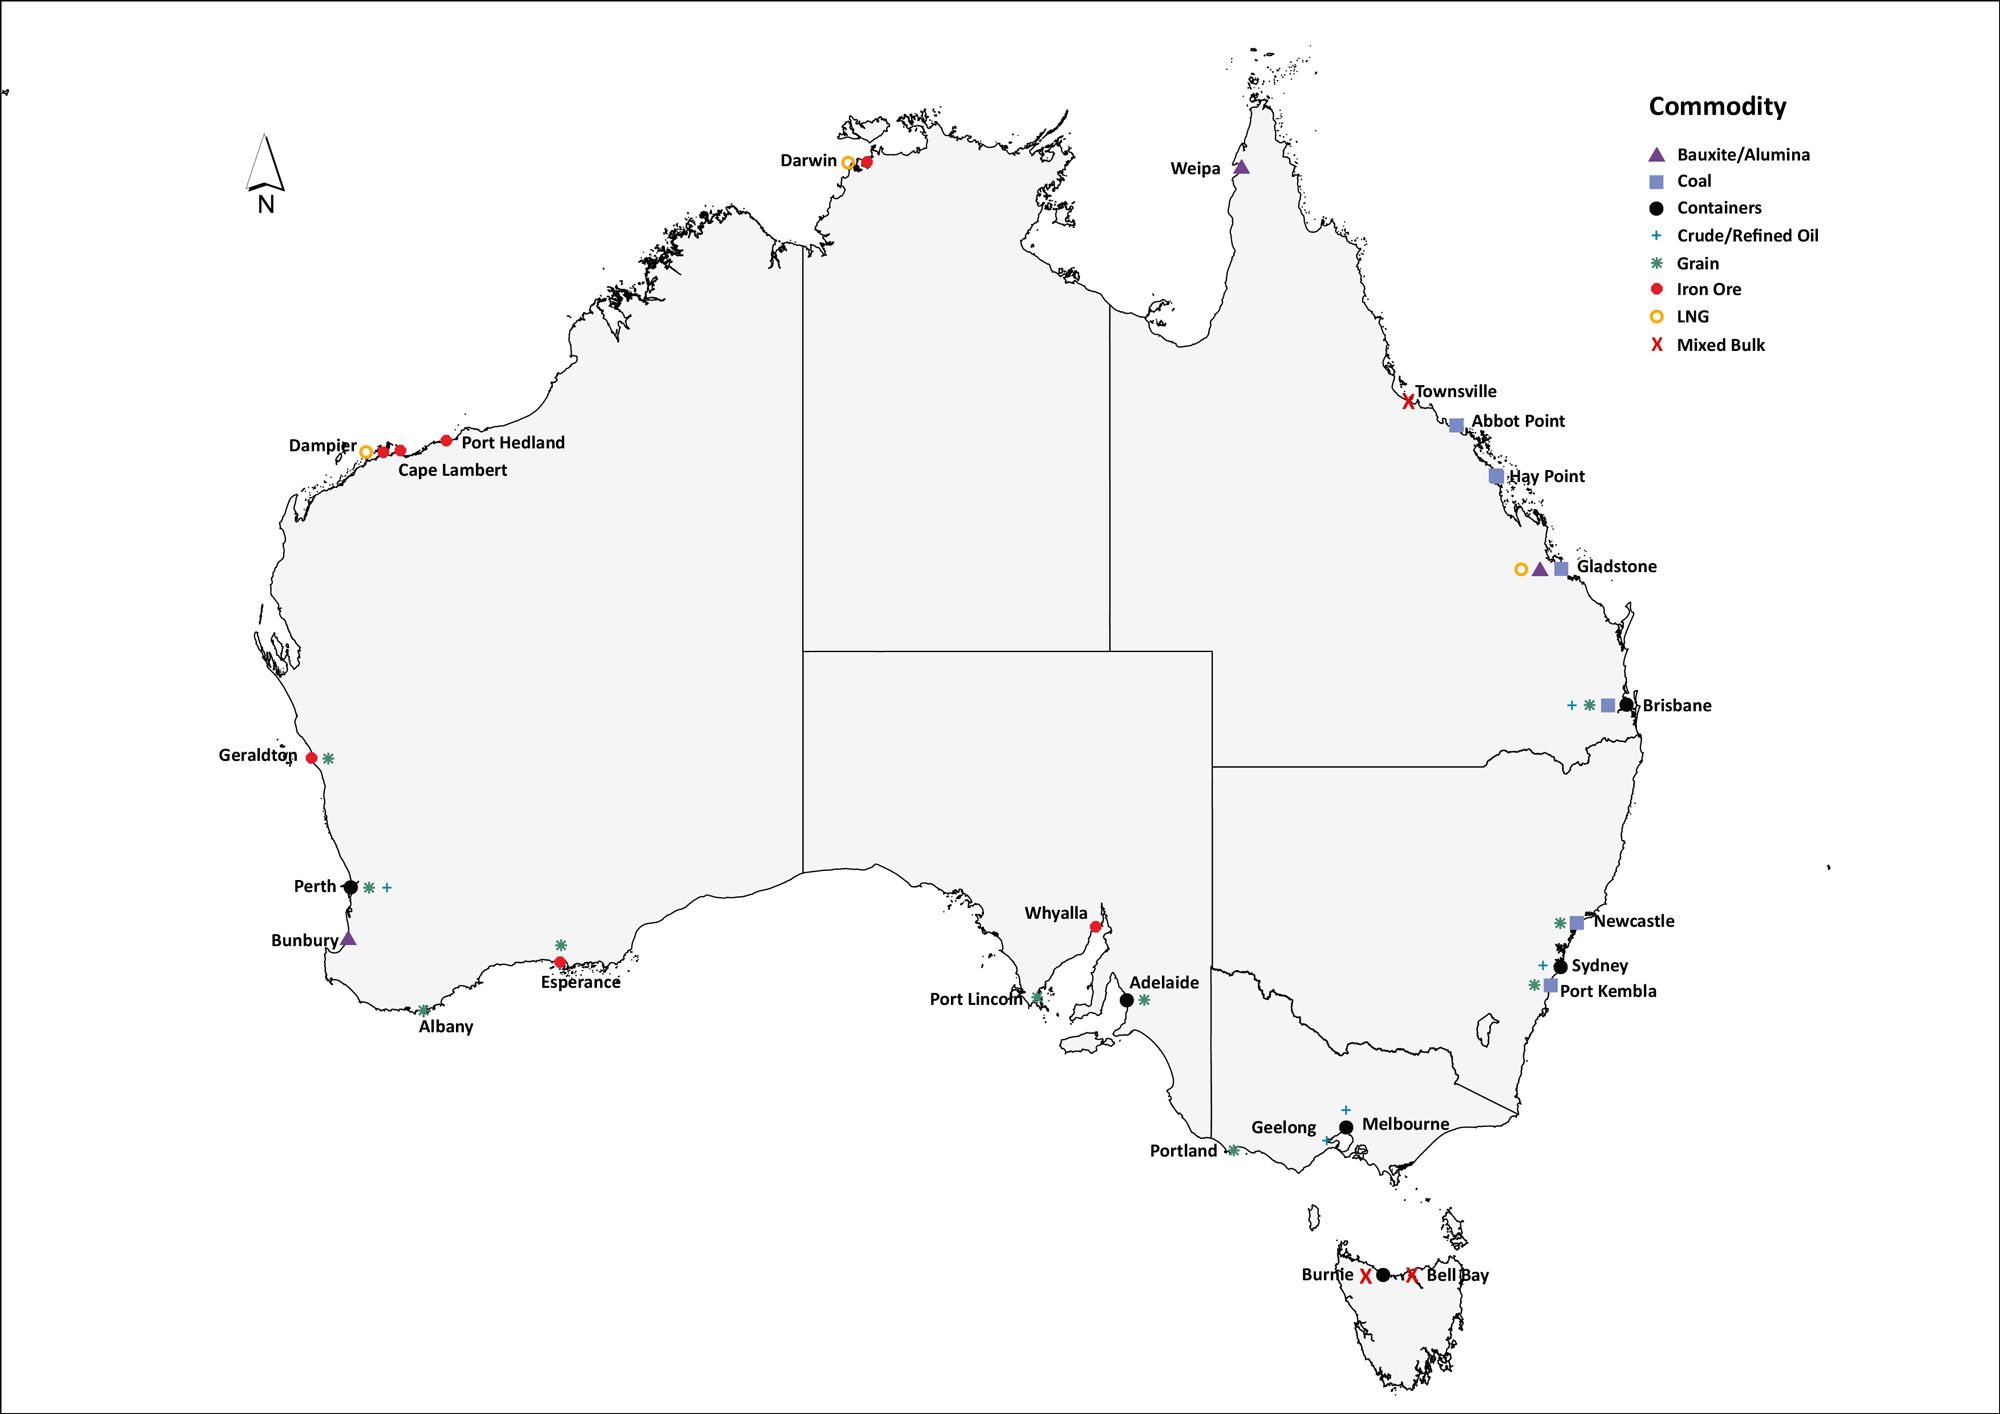
Figure 15 shows the number of port calls by state from 1999-00 to 2024-25. Queensland and Western Australia saw the largest increases and were consistently Australia’s two most visited states by cargo ships.
Figure 15 Number of port calls by state/territory
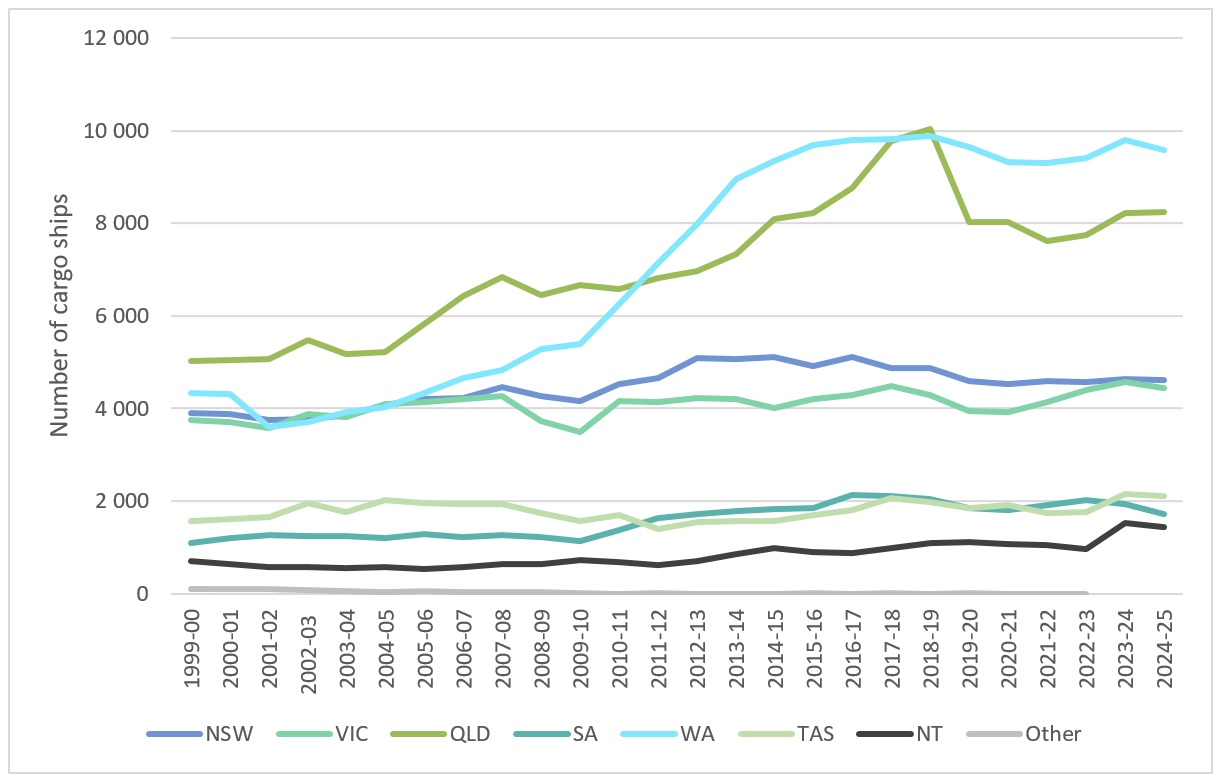
Note: “Other” includes state/territory not clearly specified in the source data.
Data may change slightly from year to year due to revisions to historical data. Ships that have made only port calls in the financial year where the target port equals the previous recorded port are excluded.
Source: BITRE estimates based on Lloyd’s List Intelligence data
Chapter 8
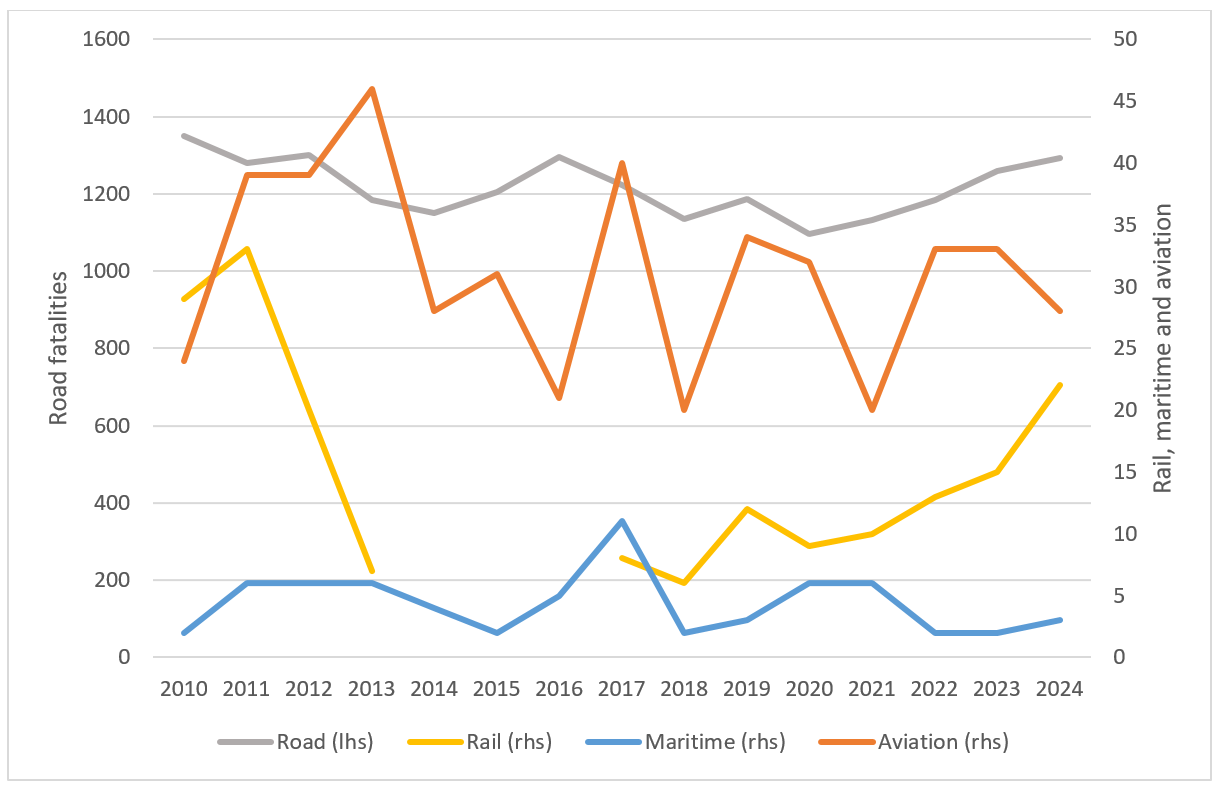
This chapter provides data on Australian safety for road, aviation, rail and maritime transport. This includes data relating to crashes, fatalities, injuries and their rates of occurrence, as well as how this differs for different demographics, states and territories (subject to data availability).
- In 2024, there were 1,294 road deaths, down from 1,737 in 2001.
- 28 aviation fatalities occurred in Australia in 2024.
- Road crashes resulted in approximately 36,000 hospitalised injuries across Australia in calendar year 2022, up from 27,000 in calendar year 2001.
- On Australia’s railways, 22 people died and 66 were seriously injured in 2024 (excludes suspected suicide).
Figure 16 shows the number of fatal crashes over time.
Figure 16 Fatalities by transport mode
Source: Table 8.1
Download data
- Transport Safety—Yearbook 2025 (154 KB) - Download Excel file
- Australian Infrastructure and Transport Statistics Yearbook 2025 - Download PDF
Also see
Transport Energy and Environment
Chapter 9
This chapter provides information on the Australian measures of transport energy and the environment. Data is sourced from industry participants, the Australia Petroleum Statistics, the Australian Energy Statistics, the Department of Environment, Energy, Climate Change and Water and BITRE’s own estimates.
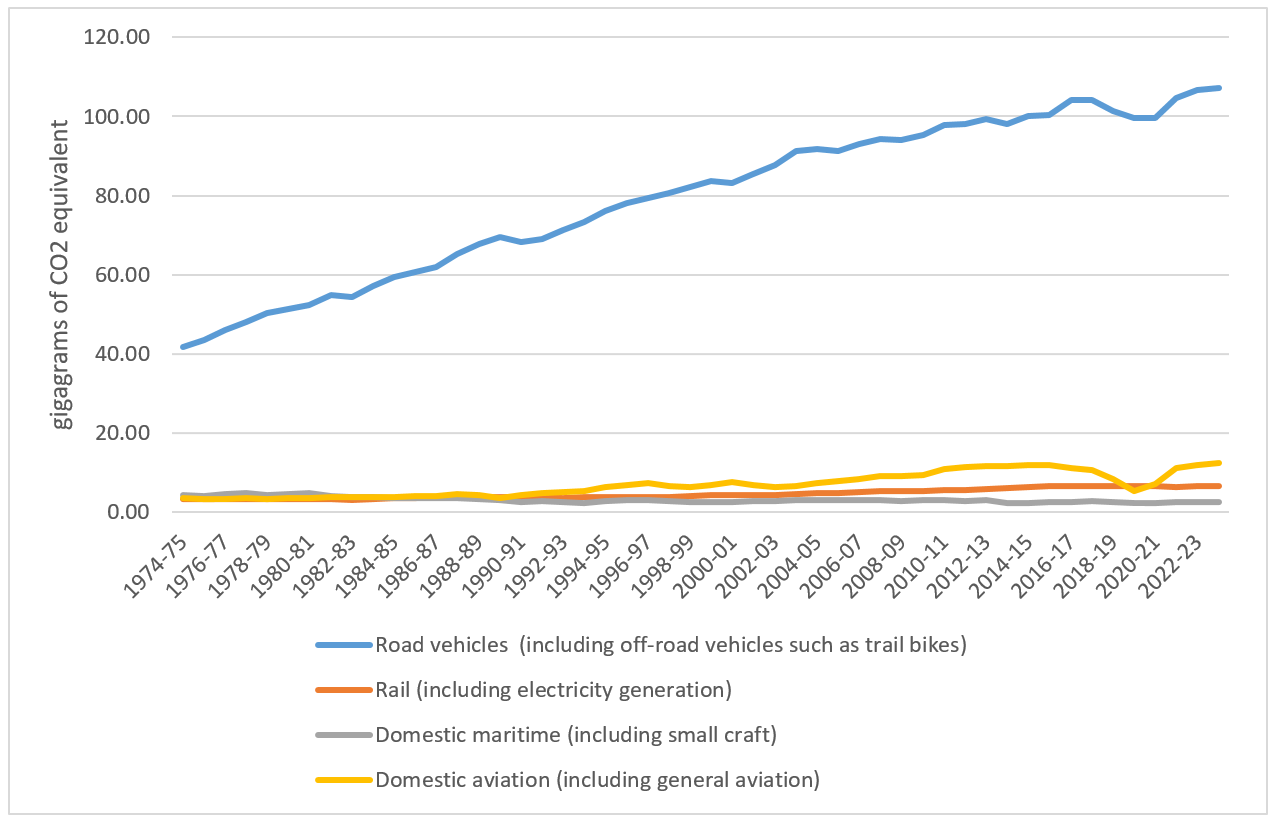
- Road vehicles made up 84 per cent of full fuel cycle greenhouse gas emissions from all domestic transport modes in 2024-25, compared to 10 per cent from aviation.
- In 2024-25, domestic road vehicle full fuel cycle greenhouse gas emissions estimates (carbon dioxide equivalent) reached a record high level of 108 megatonnes of CO2 equivalent.
- The national average price for petrol was 181 cents per litre in the 2024-25 financial year.
- In 2024-25, there was an estimated 59.2 billion litres of transport petroleum sold in Australia.
This chapter provides information on the Australian measures of transport energy and the environment. The methodology for this year’s estimates has been updated to incorporate new data sources and respond to changes in data availability and quality.
Figure 17 shows the full fuel cycle greenhouse gas emissions in megatonnes of CO2 equivalent. Transport emissions in Australia have risen steadily since 1974-75, except over the COVID-19 pandemic period, which saw them dip temporarily for road vehicles and domestic aviation. Transport emissions rose again in 2024-25, but at a slower rate than previous years post-pandemic.
Figure 17 Transport full fuel cycle greenhouse gas emissions
Source: BITRE estimates
Download data
- Transport Energy and Environment—Yearbook 2025 (131 KB) - Download Excel file
- Australian Infrastructure and Transport Statistics Yearbook 2025 - Download PDF
Also see
Infrastructure and the Economy
Chapter 10
- Infrastructure and the Economy—Yearbook 2025 (113 KB) - Download Excel file
- Australian Infrastructure and Transport Statistics Yearbook 2025 - Download PDF
This chapter provides data on the Australian economy, including the gross value added and employment in the transport and storage industry.
- 4.5 per cent of Australia’s GDP was accounted for by Australia’s transport, postal and warehousing industry in 2024-25.
- 273 thousand people were employed in the road transport industry compared to 47 thousand in the rail industry.
- 80 per cent of people employed by the road transport industry identify as male.
The gross value added of transport, postal and warehousing as a percentage of GDP has remained relatively stable since 1974–75, generally ranging between 4-5% of GDP. In terms of employment, although employment in the transport, postal and warehousing industry has grown in overall terms, as a percentage of total Australian employment, it has stayed at around 5% for the last 30 years.
Figure 18 shows employment statistics for various transport industries as at August of each year.
Figure 18 Australian employment numbers in selected major infrastructure industries
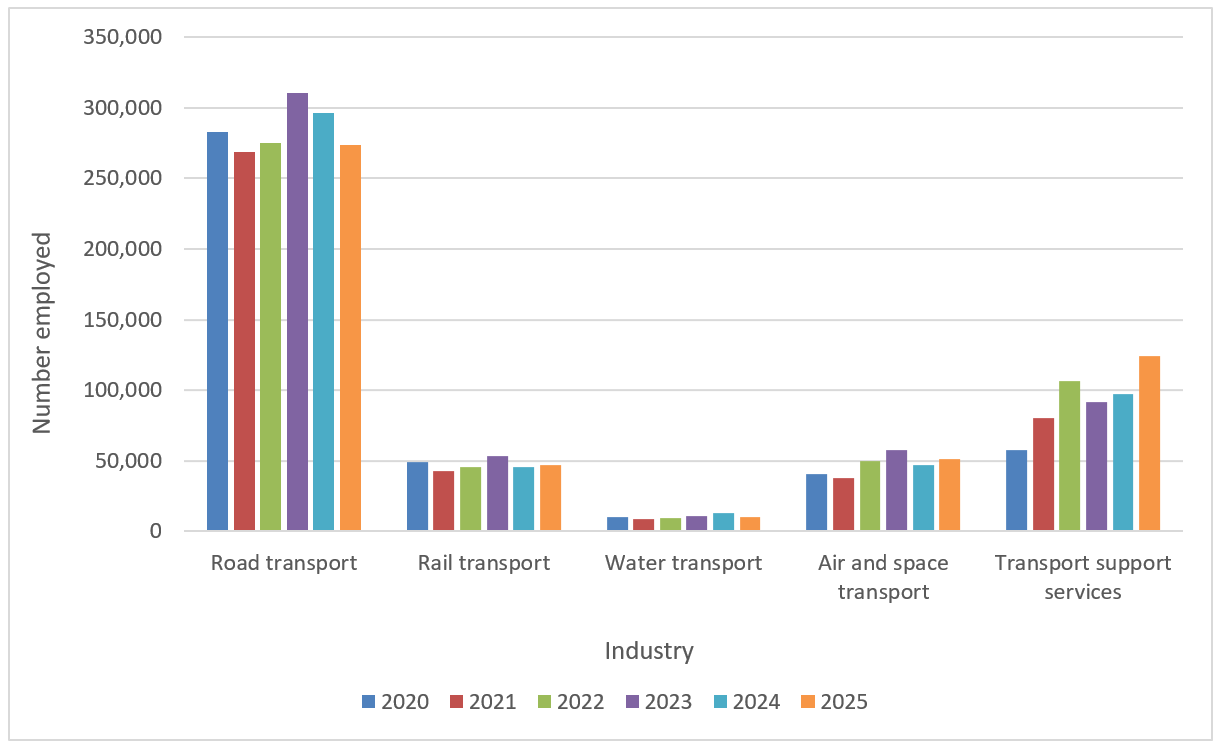
Note: This data refers to employment in August of each reference year.
Source: ABS (2025), Labour Force Australia, detailed, Canberra
Figure 19 shows employment in the road and rail industries by gender from 2023 to 2025. In 2025, there were around 230 thousand male employees compared with fewer than 50 thousand female employees. In contrast, the rail industry has a smaller workforce overall, but displays a somewhat more balanced distribution. Male employment in rail industry is consistently higher than the female employment, though the gap is narrower than in the road transport sector. Over the past three years both road and rail workforces have been declining.
Figure 19 Employment in road and rail industries, by gender
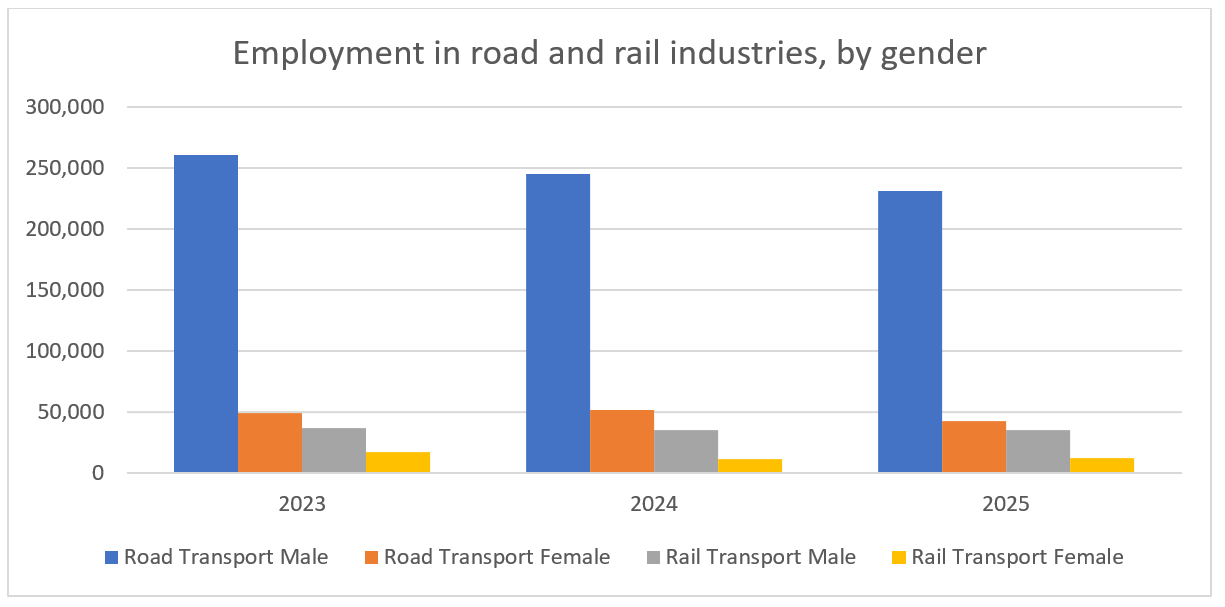
Source: ABS (2025), Labour Force Australia, detailed, Canberra
Infrastructure Construction
Chapter 11
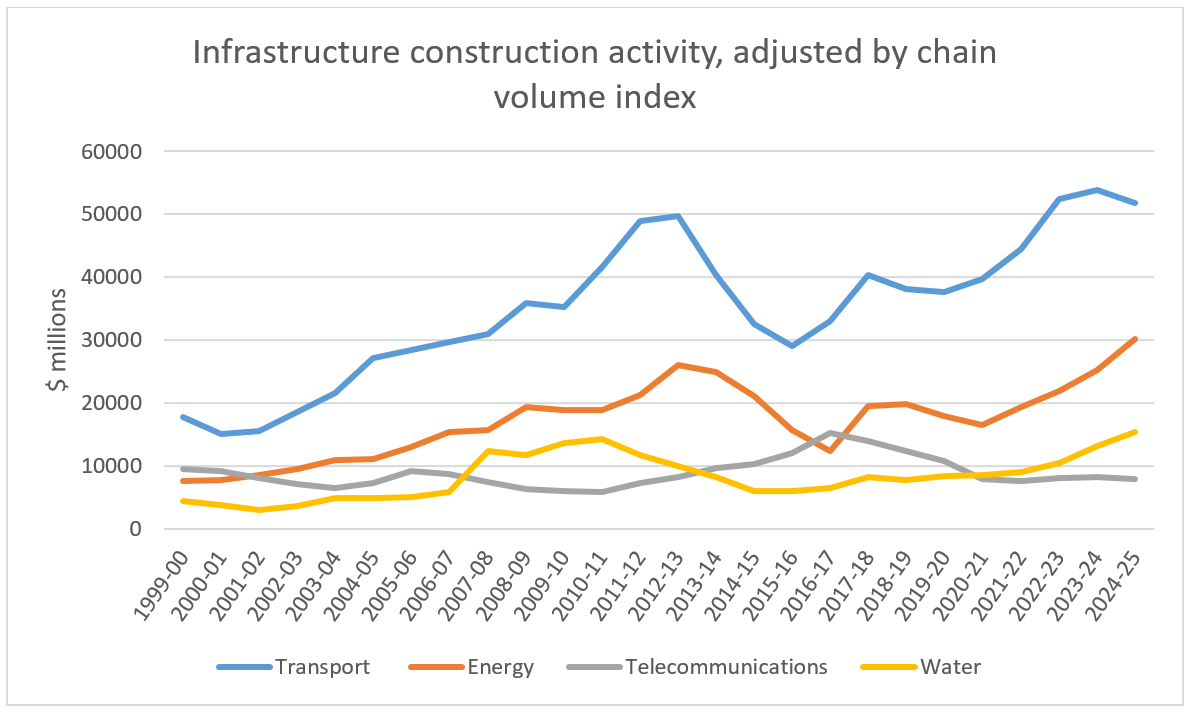
This chapter provides information on Australian measures of infrastructure engineering construction work done for public and private sectors. These are classified as: transport (roads, rail, harbours, etc), energy (electricity and gas transmission networks, etc), telecommunications networks, and water supply and distribution networks. Data is sourced from the Australian Bureau of Statistics, Engineering Construction Activity, Australia publication.
- Transport infrastructure engineering construction work was $52 billion (adjusted by chain volume index) in 2024-25. This accounted for 49 per cent of the value of infrastructure construction work done in Australia (including transport, energy, telecommunications and water).
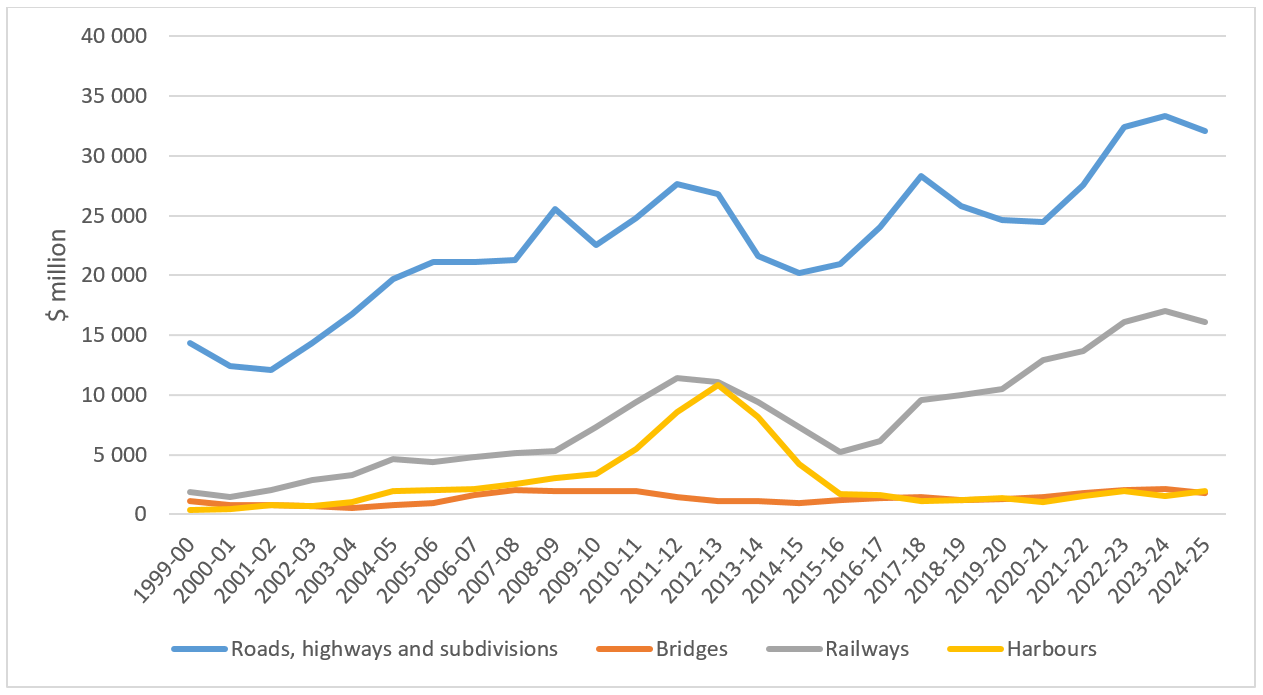
- In 2024-25, the value of transport engineering construction work done was:
- $34 billion on roads and bridges
- $16 billion on railways
- $1.9 billion on harbours.
Figure 20 and Figure 21 show the change in infrastructure investment activity in Australia over time. Transport, water and energy investment increased relatively consistently until roughly 2012-13, when they each experienced a notable fall. They have recovered in recent years, however, with the Transport sector reaching its highest point of $54 billion in 2023-24 (Figure 20).
Figure 20 Infrastructure construction activity, adjusted by chain volume index
Source: ABS (2025), Engineering Construction Activity, Australia
Figure 21 shows the value of engineering Construction activity on different modes of transport. In 2024-25, both road and rail values dropped slightly after record highs in 2023-24 (at $33 billion for road and $17 billion for rail).
Figure 21 Transport construction activity, adjusted by chain volume index
Source: ABS (2025), Engineering Construction Activity, Australia
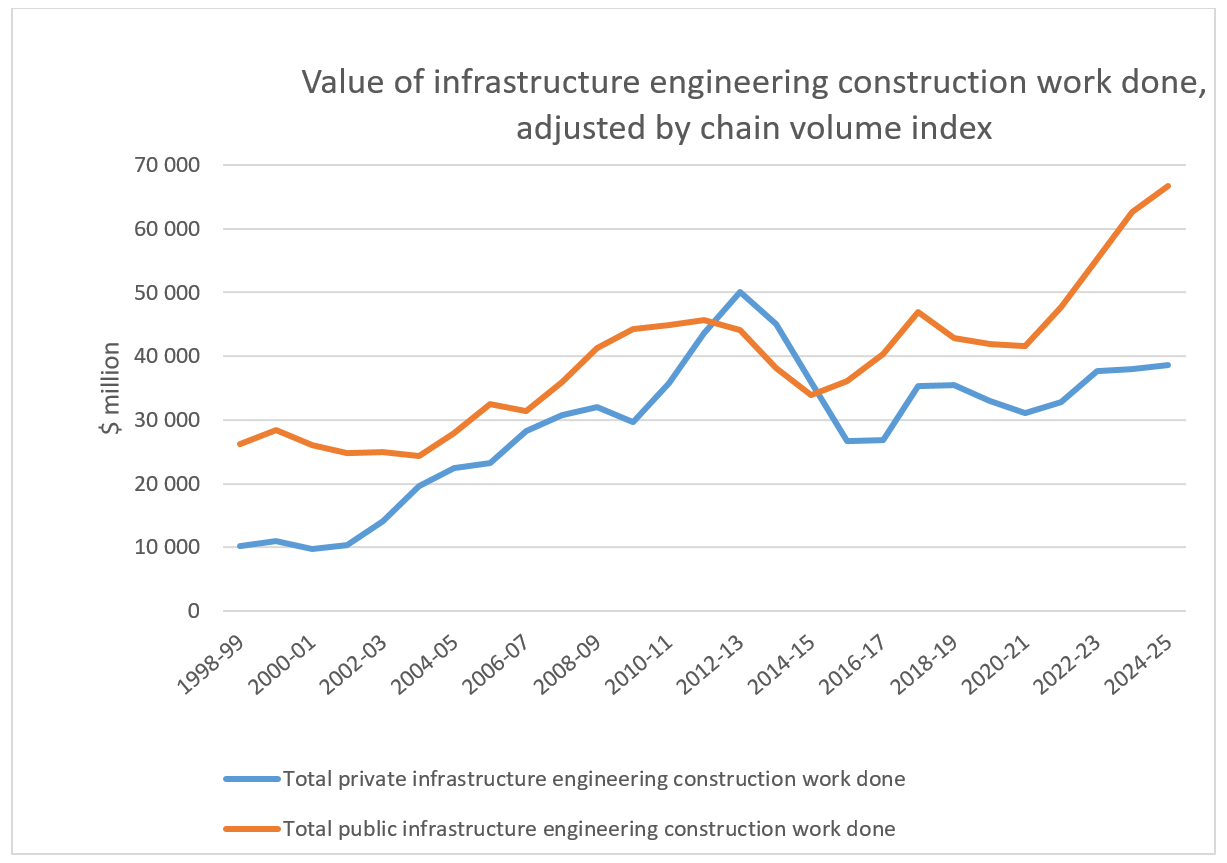
Figure 22 illustrates the private and public sector changes in Australian infrastructure expenditure.
Figure 22 Value of infrastructure engineering construction work done, by sector, adjusted by chain volume index
Source: ABS (2025), Engineering Construction Activity, Australia
Download data
- Infrastructure Construction—Yearbook 2025 (115 KB) - Download Excel file
- Australian Infrastructure and Transport Statistics Yearbook 2025 - Download PDF
Also see
Australian Infrastructure and Transport Statistics—Yearbook 2025
The aim of the Australian Infrastructure Statistics and Transport Yearbook is to provide a single, comprehensive annual source of infrastructure statistics for use by policymakers, industry, transport analysts and the wider Australian community. You can download the PDF or data files:
- Australian Infrastructure and Transport Statistics—Yearbook 2025 (PDF 9.3 MB)
- Australian Infrastructure and Transport Statistics—Yearbook 2025 data (ZIP: 1.4 MB)
For a summary of each chapter select from the list below:
Freight
Passengers

Road-related Revenue and Expenditure
Road
Rail
Aviation

Shipping
Transport Safety
Transport Energy and Environment
Infrastructure and the Economy
Infrastructure Construction
This release provides statistics relating to the number of vehicles registered for road use in Australia on 31 January 2025. The statistics encompass all vehicles that were registered with an Australian state or territory motor vehicle registry for unrestricted use on public roads, as reported by jurisdictions to the National Exchange of Vehicle and Driver Information System (NEVDIS). This is the fourth annual release of Road Vehicles Australia and replaces the ABS Motor Vehicle Census, discontinued in 2021. Relevant statistics are available on data.gov.au.
This compendium provides insights, analysis, and an understanding of the railway industry. Australia's railways are evolving, with changes both outside and within the industry. These changes include logistics, commodity flows, technology, urban patronage, and regional passenger services. The publication presents an overview and data on railway transport tasks performed; characteristics of the railways and train operators' rolling stock that runs; and aspects of railway performance, including safety, environment and reliability.
Trainline 12 gives an overview of freight, urban and non-urban passenger rail. The report analyses traffic levels, the provision of infrastructure and rolling stock, and railway performance. It is the twelfth in the publication series.
Australian Sea Freight 2023–24
This is the latest in a series of BITRE reports that provide information on Australian sea freight movements, vessel activity, the use of coastal trading licences, and the size and composition of the Australian trading fleet.
The latest import and export data has been made available in machine readable form on the National Freight Data catalogue.
Tasmanian Freight Equalisation Scheme Monitoring Report 2024
The Tasmanian Freight Equalisation Scheme (TFES) provides financial assistance for costs incurred by shippers of eligible non-bulk goods moved by sea across Bass Strait. This report is BITRE's second 4-yearly monitoring review of all components of the TFES. The focus is the volume and value of eligible claims for goods shipped between Tasmania and the mainland in the 4 years from 2019–20 to 2022–23.