Chapter 8
This chapter provides data on airline activity, aircraft numbers, on time performance and airfare price indexes. Information is provided for both international and domestic airlines, as well as a breakdown of airport traffic by state.
- 616 thousand Australian domestic flights occurred in 2023–24. As with internal activity, the full recovery of the aviation industry to pre COVID levels has not yet occurred. At the height of the pandemic, domestic flights fell to 327 thousand, fewer than flight numbers in 1977–78.
- Sydney had the highest number of aircraft movements with 300 thousand in 2023–24.
- 11 832 Piston aircraft were registered as of 31 December 2023 which is 812 more than the year before. The number of helicopters registered increased from 2 351 to 2 593 over the same period.
- International flights from Australia are steadily recovering from the impacts of COVID. In 2023‑24 there were 196 thousand flights, up from only 45 thousand three years earlier.
Figure 17 shows Australia's top 40 airports by domestic and international passenger movements. Sydney, Melbourne and Brisbane are the airports which experienced the most activity, with some regional airports outside of the top 30 entering and exiting the list.
Figure 17 Australia's top 40 airports in 2023–24, passengers
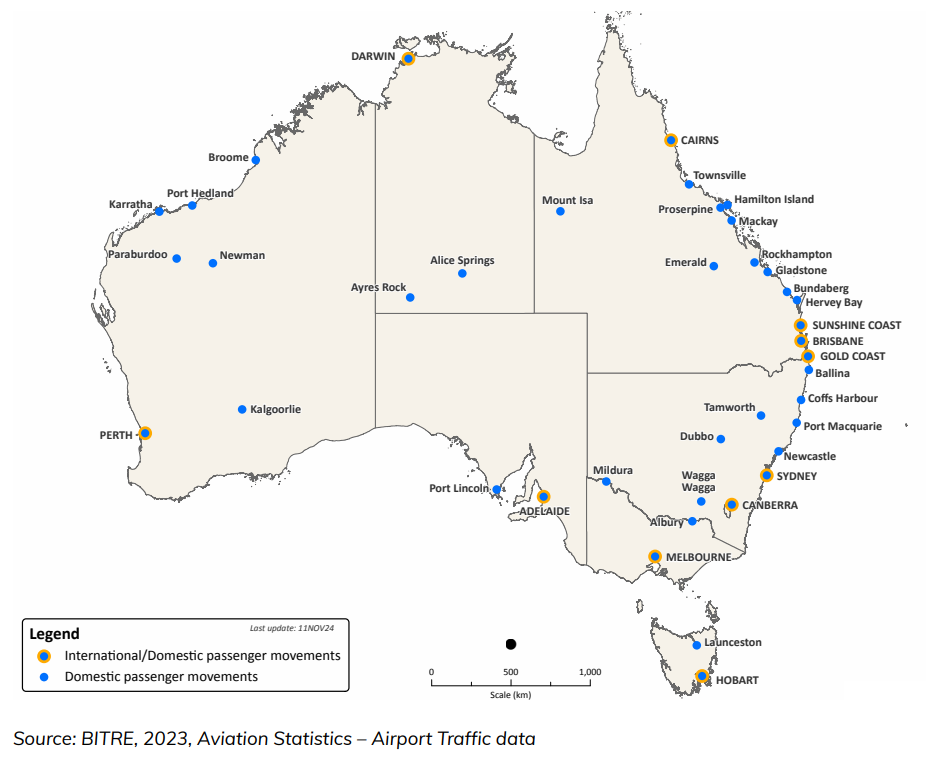
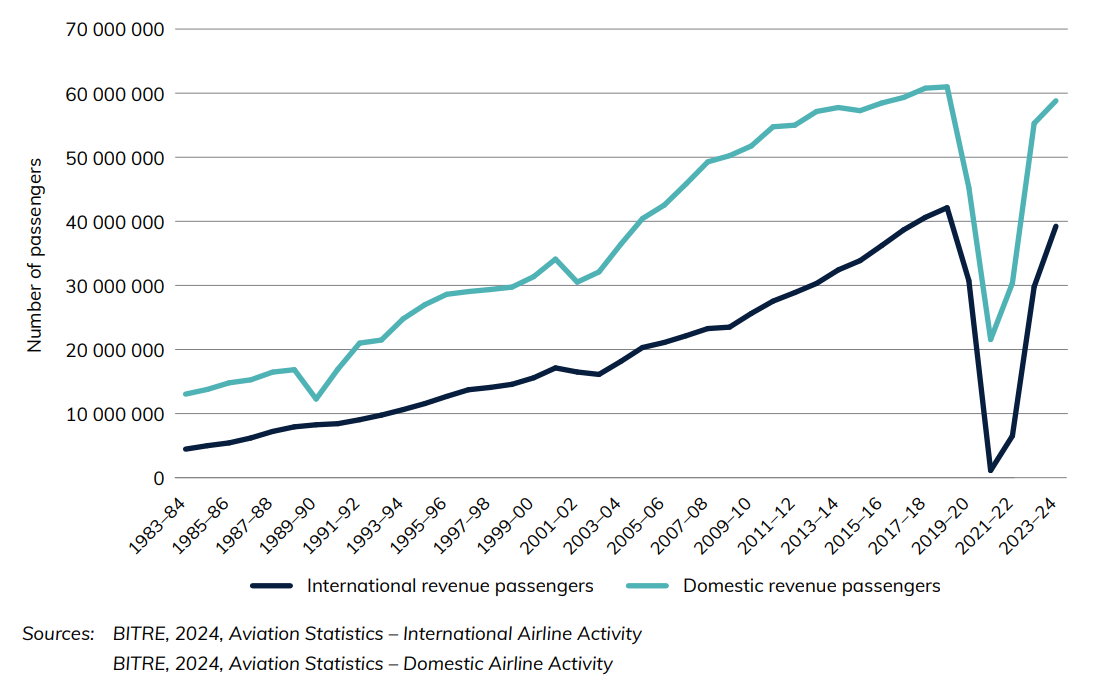
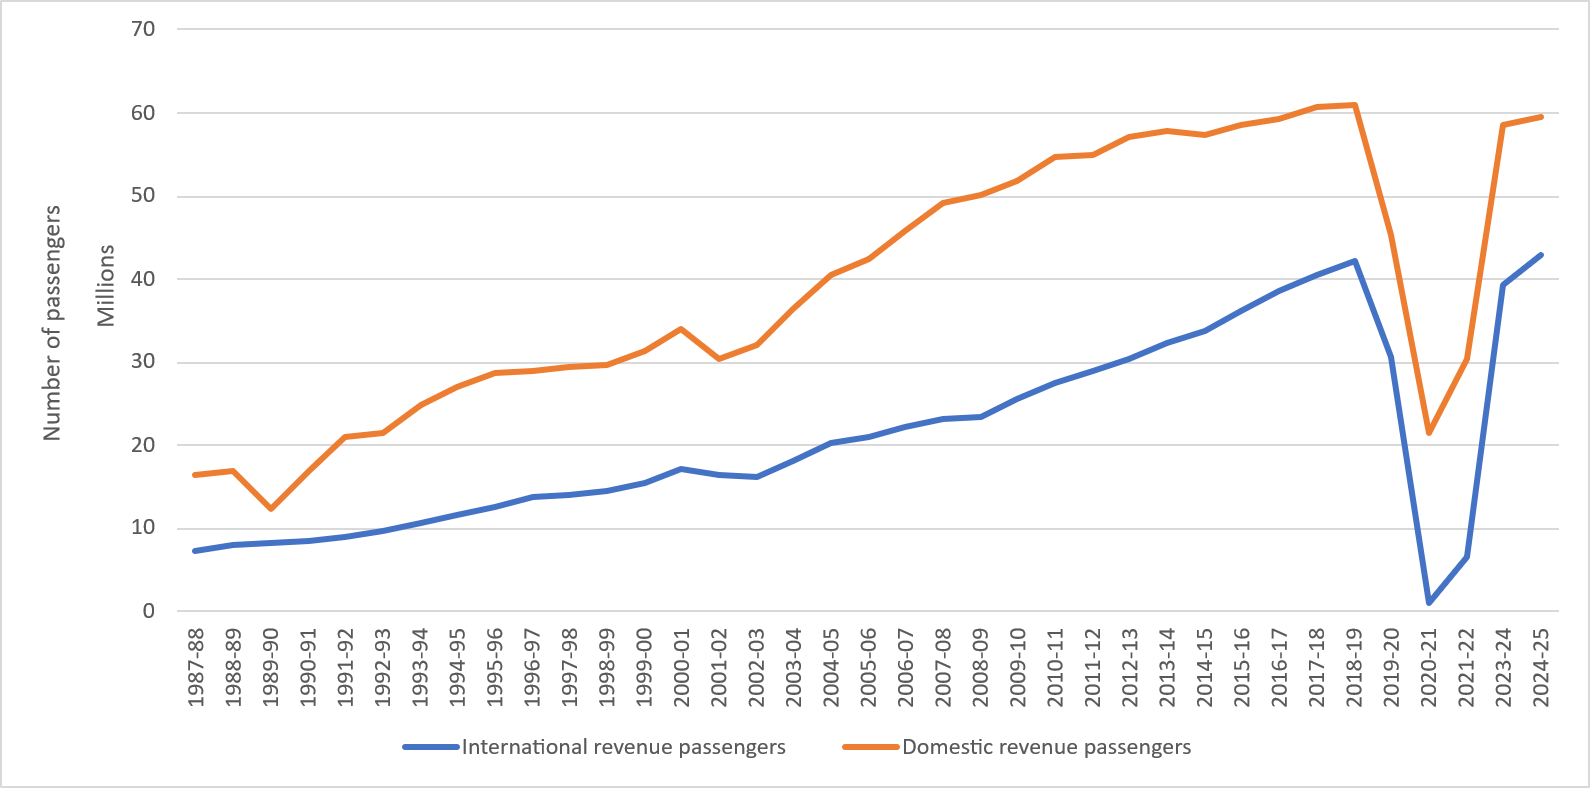
Figure 18 shows international and domestic revenue passengers. Since the early 80s, the number of fare-paying passengers, uplifted and discharged in Australia, was steadily increasing both domestically and internationally, before a sharp drop beginning in 2019–20. 2023–24 activity shows a strong trajectory to return to pre-COVID pandemic record highs in the coming years.
Figure 18 International and domestic airline revenue passengers
Download data
- Aviation—Yearbook 2024 (135.22 KB) - Download Excel file
- Australian Infrastructure and Transport Statistics—Yearbook 2024 - Download PDF
Also see
Chapter 6
This chapter provides data on airline activity, aircraft numbers, on time performance and airfare price indexes. Information is provided for both international and domestic airlines, as well as a breakdown of airport traffic by state.
- 602 thousand Australian domestic flights occurred in 2024–25. As with international activity, the full recovery of the aviation industry to pre-COVID levels has not yet occurred. At the height of the pandemic, domestic flights fell to 327 thousand, fewer than flight numbers in 1977–78.
- 11,995 Piston aircraft were registered as of 31 December 2024, which is 163 more than the year before. The number of helicopters registered increased from 2593 to 2730 over the same period.
- Sydney had the highest number of aircraft movements, with 292 thousand in 2024–25.
- International flights from Australia, are steadily recovering from the impacts of COVID. In 2024–25 there were 209 thousand flights, up from only 45 thousand four years earlier.
Figure 12 Australia’s top 40 airports in 2024-25, passengers
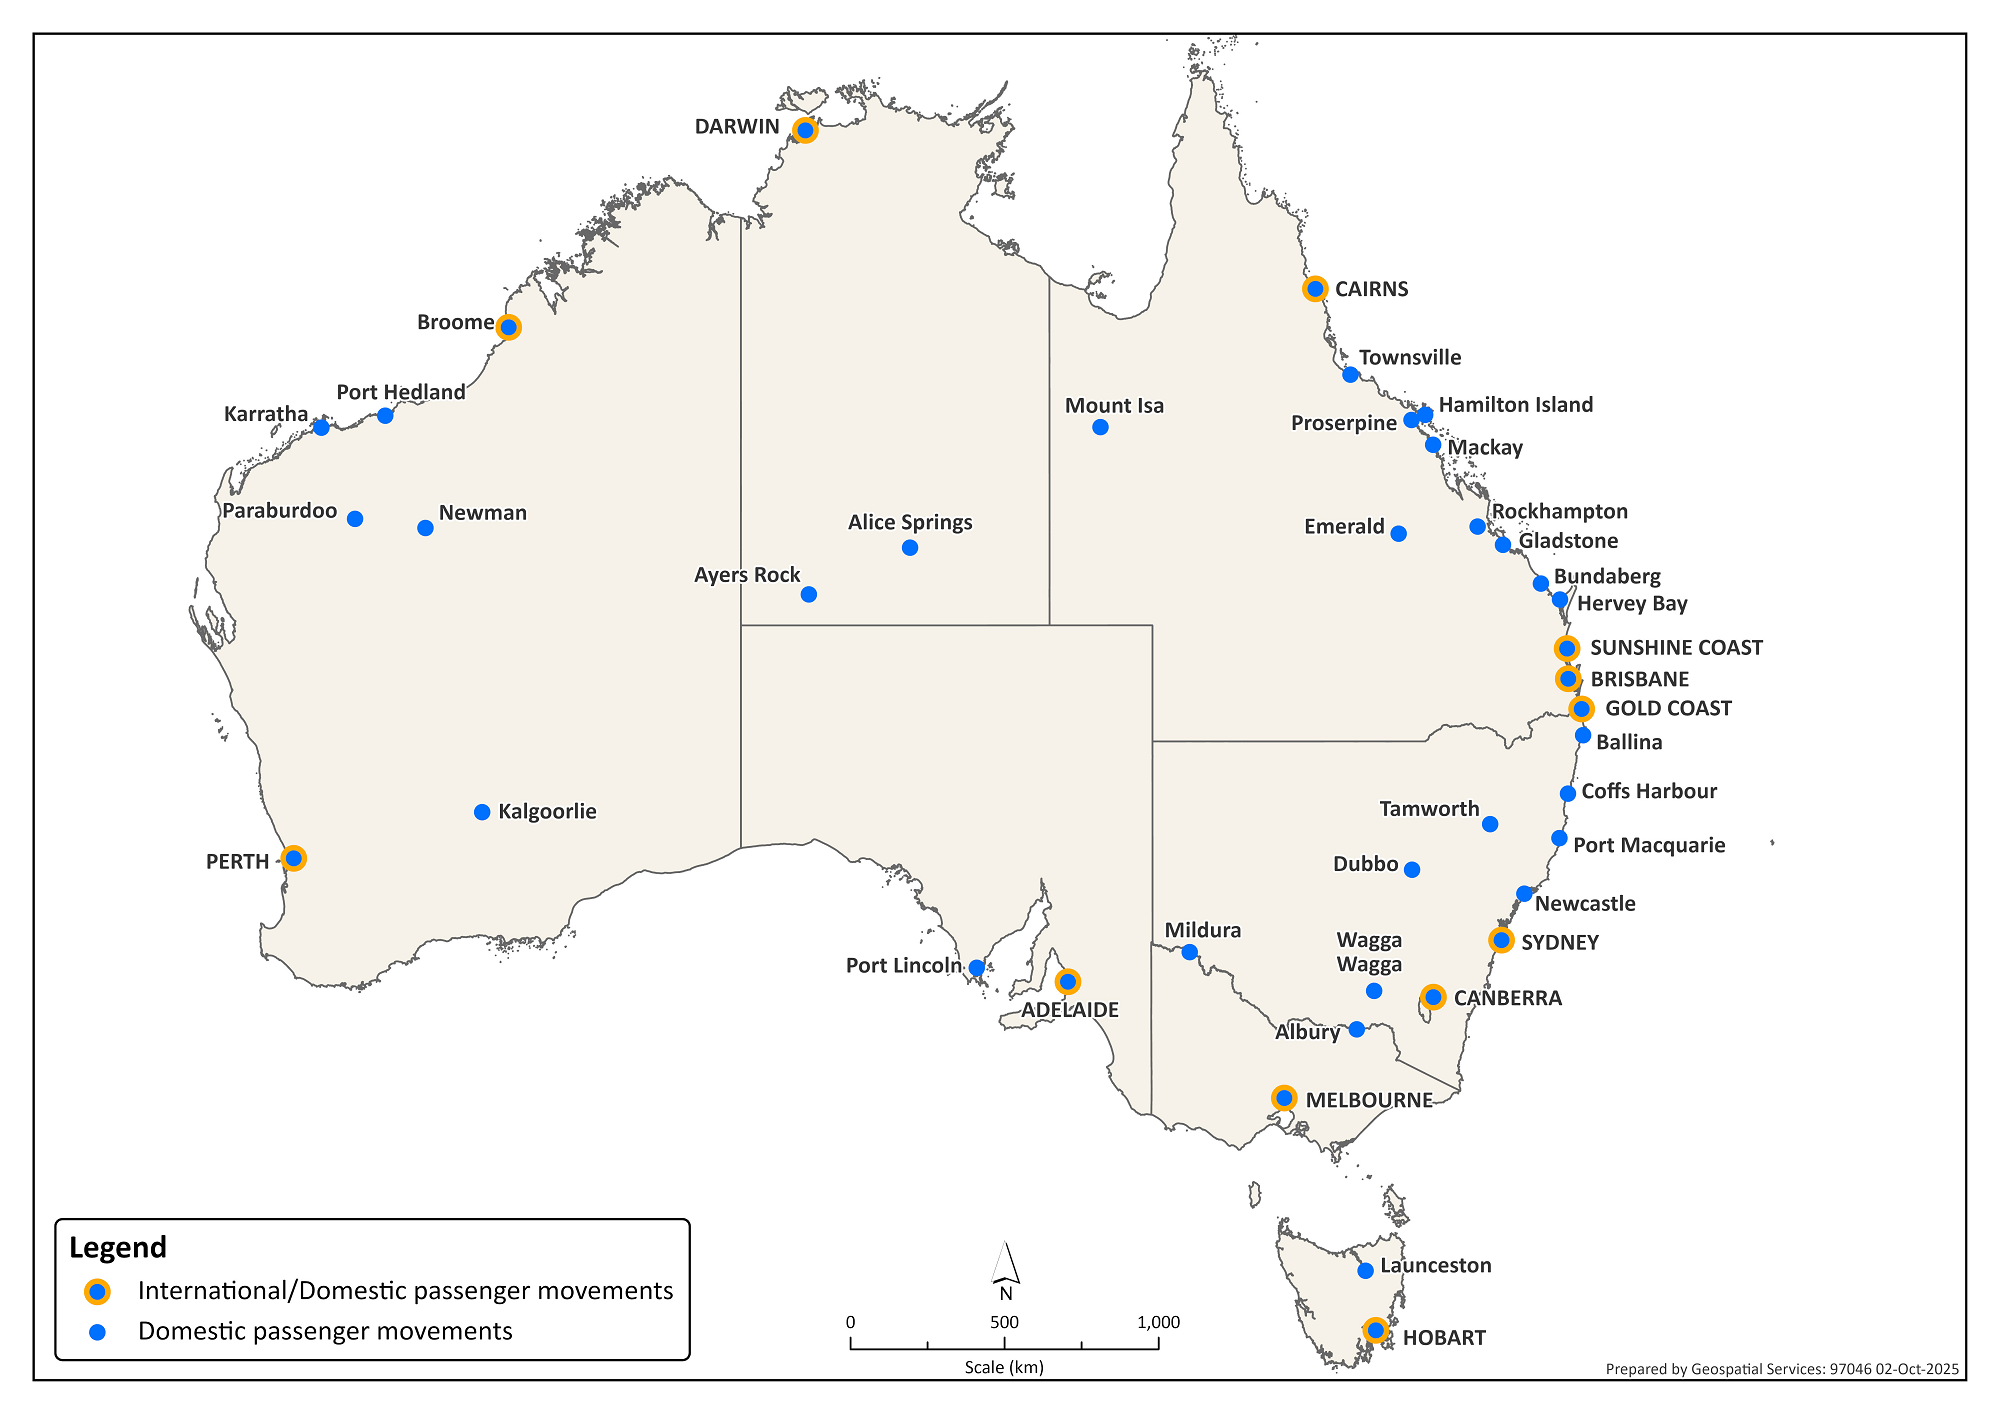
Source: BITRE (2025) Aviation Statistics - Airport Traffic data
Figure 12 shows Australia’s top 40 airports by domestic and international passenger movements. Sydney, Melbourne and Brisbane are the airports which experienced the most activity, with some regional airports outside of the top 30 entering and exiting the list.
Figure 13 International and Domestic airline revenue passengers
Source: BITRE (2025), Aviation Statistics - International Airline Activity
BITRE (2025), Aviation Statistics - Domestic Airline Activity
Figure 13 shows international and domestic revenue passengers. Since the early 1980s, the number of fare-paying passengers, uplifted and discharged in Australia, was steadily increasing both domestically and internationally, before a sharp drop beginning in 2019–20 and recovering to around pre–COVID levels by 2024–25.
Download data
- Aviation—Yearbook 2025 (133 KB) - Download Excel file
- Australian Infrastructure and Transport Statistics Yearbook 2025 - Download PDF
Also see
Economic measures of general aviation in Australia
GA plays a range of essential roles in Australia including servicing regional communities, delivering education and health services, regional freight and transport, tourism, recreation, agricultural mustering and spraying, instructional flying, sport and pleasure flying, and emergency services. However, GA is not a stand-alone category in Australia’s System of National Accounts. Instead, it makes up a small subset of a very wide range of economic activities, making it difficult to estimate its actual economic impact. This study considers a range of sources, including innovative methods of matching aircraft registrations to business activity, to estimate the contribution of GA to Australia’s economy.
Australian Infrastructure and Transport Statistics—Yearbook 2024
The aim of the Australian Infrastructure Statistics and Transport Yearbook is to provide a single, comprehensive annual source of infrastructure statistics for use by policymakers, industry, transport analysts and the wider Australian community. You can download the PDF or data files:
- Australian Infrastructure and Transport Statistics—Yearbook 2024 (PDF 9.2 MB)
- Australian Infrastructure and Transport Statistics—Yearbook 2024 data (ZIP: 2 MB)
For a summary of each chapter select from the list below:
Infrastructure and the Economy
Infrastructure Construction
Road-related Revenue and Expenditure
Freight
Passengers

Road
Rail
Aviation
Shipping
Transport Safety

Transport Energy and Environment
Australian aviation forecasts – 2024 to 2050
Aviation plays a key role in Australia’s transport system, providing regular scheduled services between Australia's highly dispersed major population centres and vital connectivity for rural and remote communities. As a large island nation, located significant distances from our nearest neighbours, aviation is also the primary means of access for international visitors and for domestic residents travelling overseas.
This report presents long-term forecasts of Australian commercial air passenger and freight activity, and forecasts of air passenger numbers through Australia’s 14 busiest airports / air catchments – i.e. Australia’s eight capital cities and six busiest non-capital city airports – and air freight volumes through Australia’s mainland state capital city airports. The forecasts are based on econometric models of Australian domestic and international air passenger and air freight demand, and the most recent long-term economic outlooks for Australia and developed and major developing countries. The forecasts are intended to help inform long-term Australian aviation policy development and planning.
Australian Infrastructure and Transport Statistics - Yearbook 2023
The aim of the Australian Infrastructure Statistics and Transport Yearbook is to provide a single, comprehensive annual source of infrastructure statistics for use by policymakers, industry leaders, transport analysts and the wider Australian community. Download the PDF or select a chapter below. Data files for each chapter are at the bottom of the page.
Australian Infrastructure and Transport Statistics—Yearbook 2023 - PDF (7.23 MB)
Infrastructure and the Economy
Infrastructure Construction
Road-related Revenue and Expenditure
Freight
Passengers
Road
Rail
Aviation
Shipping
Transport Safety
Transport Energy and Environment
Economic Contribution of Transport in Australia, 2020-21
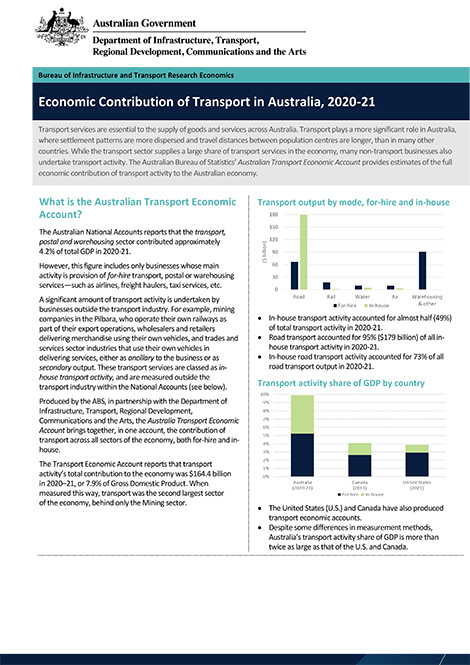
The Australian Bureau of Statistics’ (ABS) Australian Transport Economic Accounts (ATEA) 2020-21 provide estimates of the full economic contribution of transport activity, both for-hire and in-house transport services, to the Australian economy, from 2010-11 to 2020-21.
The ATEA estimates that transport’s total contribution to the economy was $164.4 billion in 2020-21, equivalent to 7.9 per cent of total GDP. Measured in this way, transport was the second largest sector of the economy, behind only the Mining sector.
This release provides a short summary and highlights of the ABS ATEA 2020-21. More detailed ATEA statistics and explanatory notes are available from the ABS website: www.abs.gov.au/statistics/economy/national-accounts/australian-transport-economic-account-experimental-transport-satellite-account
Australian aggregate freight forecasts – 2022 update
Freight transport plays a significant and wide-ranging role across Australia’s economy. It includes the movement of Australia’s major bulk export commodities to ports for export, the transport of raw materials and semi-processed commodities to businesses for further processing and finished products to household consumers.
This report presents long-term forecasts of total Australian freight volumes for road, rail, coastal shipping and aviation between 2020 and 2050. The forecasts are based on a combination of statistical models relating to historical trends in freight volumes and economic activity and on informed assumptions about likely future long-term economic and demographic trends and international assumptions about likely future world demand for key Australian export commodities. This report updates BITRE 2019 aggregate freight forecasts.
Australian Infrastructure and Transport Statistics - Yearbook 2021
The aim of the Australian Infrastructure Statistics and Transport Yearbook is to provide a single, comprehensive annual source of infrastructure statistics for use by policymakers, industry leaders, transport analysts and the wider Australian community.
The publication is primarily a source of long-term, aggregate time series infrastructure statistics. Most statistics included in the publication are currently collected by BITRE or other Australian, state or territory government agencies.
The Yearbook has 11 chapters:
Domestic aviation activity – cities and regions
This file provides data on Regular Public Transport (RPT) Domestic Aviation Activity in Australia by sector type.
Each sector is classified using the ABS Australian Statistical Geography Standard (ASGS) 2016 based on location of the airport pair.
‘Major Cities’ covers sectors between 2 airports located in Major Cities, ‘Regional’ covers sectors where at least one airport is in an Inner Regional or Outer Regional area, but no airports are in Remote or Very remote areas and ‘Remote’ covers sectors where at least one airport is in a Remote or Very Remote location.
Data are provided for Flights, Passenger trips, Seats, Revenue Passenger Kilometres (RPKs), Available Seat Kilometres (ASKs), Distance flown, Load factors (RPKs/ASKs), Distance per flight, Seats per flight, Number of operators and Number of sectors.
Raw data is available in the sheet called “Data”. Use the sheet called “Chart” to select a metric and see it as a chart. More information and definitions are provided in the sheet called “Notes”.