
Background
Introduction
The Bureau of Infrastructure, Transport and Regional Economics (BITRE) monitors the punctuality and reliability of major domestic airlines operating between Australian airports. The purpose of this is to allow for evaluation of overall industry and individual airline performance, so that consumers of air travel can make informed decisions.
Coverage
The following domestic airlines currently report this information monthly to the BITRE: Jetstar, Qantas, QantasLink, Regional Express, Tigerair Australia, Virgin Australia and Virgin Australia Regional Airlines. Data has been gathered since November 2003, although some airlines commenced reporting at a later date, including Jetstar which first reported in May 2004, MacAir in July 2005, Tigerair Australia in April 2008 and Virgin Australia Regional Airlines in May 2013. MacAir ceased operations in February 2009 and data was not received for December 2008 onwards. Virgin Blue was rebranded as Virgin Australia in May 2011 and Tiger Airways was rebranded as Tigerair Australia in July 2013 and time series data in Microsoft Excel spread sheet format on the BITRE website have been revised to reflect these changes. Services operated by Skywest on behalf of Virgin Australia using ATR/F100 aircraft commenced in November 2011 and were shown separately as Virgin Australia - ATR/F100 Operations. Virgin Australia Regional Airlines commenced operations in May 2013. It was formed after the acquisition of Skywest by Virgin Australia and represented a combination of operations previously reported under Skywest and Virgin Australia - ATR/F100 Operations. In January 2016, Virgin Australia transferred their ATR fleet from Virgin Australia Regional Airlines to Virgin Australia.
On time performance is reported for Australian domestic routes for which the passenger load averaged 8 000 or more passengers per month over the previous six months and where two or more airlines operated in competition on those routes. There were 66 routes that met this definition in May 2016. Over time, routes which meet these criteria change as airline networks and traffic levels vary.
Participating airlines also report their overall monthly network performance figures. Total industry figures encompass all services operated by reporting airlines only. These airlines collectively carried over 95 per cent of total domestic passengers (regular public transport only) in 2015.
Definitions
A flight arrival is counted as "on time" if it arrived at the gate before 15 minutes after the scheduled arrival time shown in the carriers' schedule. Neither diverted nor cancelled flights count as on time. Similarly, a flight departure is counted as "on time" if it departs the gate before 15 minutes after the scheduled departure time shown in the carriers' schedule.
A flight is regarded as a cancellation if it is cancelled or rescheduled less than 7 days prior to its scheduled departure time.
On time performance is measured as the number of flights operating on time as a percentage of the number of flights operated on any particular sector. Cancellations are measured as the number of flights cancelled as a percentage of the number of flights scheduled for that particular sector.
The method of capturing on time performance varies between airlines utilising different recording systems. Jetstar and Qantas jet aircraft use Aircraft Communication Addressing and Reporting System (ACARS) to electronically measure on time performance. Regional Express, Tigerair, Virgin Australia, Virgin Australia Regional Airlines and the Qantas non-jet fleet record on time performance manually using records from pilots, gate agents and/or ground crews.
Reports
Reports are published monthly on the BITRE web site. After collection of initial data, aggregate reports are subject to internal audit by participating airlines prior to publication. The target date for publication is 15 working days after of the end of the reporting period.
International airline activity
Summary
Sixty-two international airlines operated scheduled services to/from Australia during the month (includes 3 dedicated freight airlines but excludes airlines operating only via codeshare arrangements).
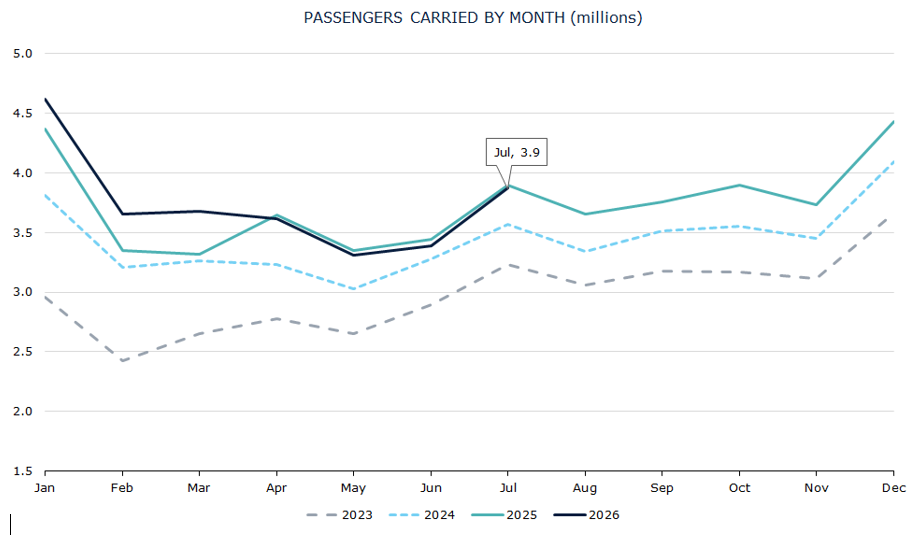
International scheduled passenger traffic in July 2026 was 3.873 million compared with 3.896 million in July 2025, representing a decrease of 0.6%. This is the fourth consecutive monthly year-on-year decline since the first decrease recorded in April 2026. Prior to these recent declines the last monthly year-on-year decrease occurred in October 2021 (COVID).
Passenger traffic for the year ended July 2026 was 45.624 million which is a 5.3% increase over the figure for the year ended July 2025 (43.336 million).
Total seats made available on international scheduled operations to/from Australia during July 2026 were 4.843 million – an increase of 2.0% compared with July 2025. The overall seat utilisation percentage was 82.0% in July 2026. It was 83.7% in July 2025 and 83.3% in July 2024.
In terms of passenger carriage, Qantas Airways had the largest share of the market in July 2026 with 16.4% of the total followed by Jetstar with 14.1%, Singapore Airlines with 8.8%, Air New Zealand with 6.5% and Virgin Australia with 4.6%.
The Qantas Group (Qantas Airways and Jetstar) accounted for 30.5% of total passenger carriage in July 2026. The group’s share was 28.8% in July 2025 and 28.2% in July 2024.
Australian designated airlines (Qantas Airways, Jetstar and Virgin Australia) accounted for 35.1% of total passenger carriage in July 2026. Their share was 33.4% in July 2025 and 31.6% in July 2024.
Low-cost carriers (LCCs) AirAsia Berhad, AirAsia X, Cebu Pacific Air, Indonesia AirAsia, Jetstar, Scoot, T’Way Air and Vietjet Air accounted for 20.9% of total international passenger traffic to/from Australia in July 2026. The LCCs’ share in July 2025 was 20.7% and 20.5% in July 2024.
International scheduled freight traffic in July 2026 increased by 6.8% over July 2025 to 93,318 tonnes. Inbound freight traffic increased by 9.3% and outbound freight traffic increased by 2.1% compared with July 2025.
Freight traffic for the year ended July 2026 was 1.108 million tonnes - a decrease of 0.6% compared with the year ended July 2025 (1.115 million tonnes).
Summary of year-on-year activity
| Year ended July 2025 | Year ended July 2026 | % Change | |
|---|---|---|---|
| Total passenger movements (million) | 43.336 | 45.624 | 5.2 |
Summary of month-on-month activity
| July 2025 | July 2026 | % Change | |
|---|---|---|---|
| Passengers carried (million) | 3.896 | 3.873 | -0.6 |
| Freight (tonnes) | 87 337 | 93 318 | 6.8 |
| Mail (tonnes) | 2 110 | 2 126 | 0.8 |
| Available Seats (million) | 4.746 | 4.843 | 2.0 |
| Flights | 18 664 | 19 208 | 2.9 |
| Aircraft Movements | 19 130 | 19 542 | 2.2 |
Airline On Time Performance, 2025 Calendar Year
Summary – 2025 Calendar Year
For the year ended December 2025, on time performance (OTP) over all routes operated by participating airlines (Hinterland, Jetstar, Qantas, QantasLink, Rex Airlines, Skytrans Australia (formerly Smartlynx Australia), Virgin Australia and Virgin Australia Regional Airlines) averaged 76.9 per cent for on time arrivals and 77.7 per cent for on time departures. The cancellation rate for the year was 2.5 per cent. The equivalent figures for 2024 were 74.6 per cent for on time arrivals, 75.4 per cent for on time departures and 2.6 per cent for cancellations. Airlines’ on time performance varies across the routes they serve. Individual route data by specific airline for 60 routes which operated for at least part of the 2025 calendar year are shown on pages 9-21.
The 2025 on time arrivals figure was lower than the long-term average (average over the period of OTP reporting starting in November 2003) performance for all routes (80.5 per cent) and the on-time departures figure was also lower than the long-term average (81.6 per cent). The rate of cancellations was higher than the long-term average of 2.2 per cent.
On time arrivals
The Qantas network (Qantas and QantasLink combined operations) recorded 77.9 per cent for on time arrivals while the Virgin Australia network (Virgin Australia and Virgin Australia Regional Airlines combined operations) recorded 76.0 per cent. Hinterland achieved the highest on time arrivals at 88.4 per cent, followed by Skytrans Australia at 85.1 per cent, QantasLink at 78.3 per cent, Qantas at 77.2 per cent, Virgin Australia at 76.0 per cent, Jetstar at 75.2 per cent, Rex Airlines at 73.0 per cent and Virgin Australia Regional Airlines at 71.5 per cent.
On time departures
The Qantas network recorded 78.8 per cent for on time departures while the Virgin Australia network recorded 77.0 per cent. Hinterland achieved the highest level of on time departures for 2025 at 92.5 per cent, followed by Skytrans Australia at 86.3 per cent, Qantas at 79.7 per cent, QantasLink at 78.3 per cent, Virgin Australia at 77.2 per cent, Rex Airlines at 76.0 per cent, Jetstar at 73.6 per cent and Virgin Australia Regional Airlines at 67.6 per cent.
Cancellations
Skytrans Australia recorded the highest percentage of cancellations at 8.4 per cent during the year. The second highest cancellation rate was from QantasLink at 3.6 per cent, followed by Qantas at 2.7 per cent, Rex Airlines at 2.5 per cent, Jetstar at 2.2 per cent, Virgin Australia at 1.7 per cent, Virgin Australia Regional Airlines at 1.1 per cent and Hinterland at 0.8 per cent.
Routes
Of the 60 routes which met the criteria for OTP reporting, the Townsville-Cairns route (Jan 2025 only) had the highest percentage of on time arrivals (90.9 per cent) and the highest percentage of on time departures (90.9 per cent). For those routes reporting for the entirety of 2025, Emerald-Brisbane had the highest percentage of on time arrivals (89.8 per cent) and the highest percentage of on time departures (88.4 per cent). The Hamilton Island-Sydney route had the lowest percentage of on time arrivals (60.8 per cent) and the lowest percentage of on time departures (61.6 per cent).
Cancellations were highest on the Canberra-Sydney route at 6.2 per cent, followed by the Sydney-Canberra route at 5.6 per cent, the Port Lincoln-Adelaide and Sydney-Melbourne routes at 4.4 per cent, the Port Macquarie-Sydney and Melbourne-Sydney routes at 4.3 per cent, the Adelaide-Port Lincoln and Gladstone-Brisbane routes at 4.1 per cent, the Sydney-Port Macquarie route at 4.0 per cent and the Devonport-Melbourne route at 3.9 per cent.
Cancellations were lowest on the Melbourne-Ayers Rock at 0.0 per cent, followed by the Sydney-Hamilton Island route at 0.1 per cent, Ayers Rock-Melbourne and Sydney-Cairns routes at 0.3 per cent, and the Perth-Newman and Melbourne-Sunshine Coast routes at 0.4 per cent.
Airports
Of the airports with OTP reporting for 2025, Emerald Airport recorded the highest percentage of on time arrivals (86.2 per cent) and the highest percentage of on time departures (88.4 per cent). Port Macquarie Airport recorded the lowest percentage of on time arrivals (70.0 per cent) and Broome Airport recorded the lowest percentage of on time departures (64.8 per cent). These figures only refer to reported routes and do not cover all flights at these airports.
Table 1: Total Industry On Time Performance for - 2025
| Reporting Airlines | Sectors Scheduled | Arrivals On Time % | Departures On Time % | Cancellations % |
|---|---|---|---|---|
| Hinterland | 18,415 | 88.4 | 92.5 | 0.8 |
| Jetstar | 96,686 | 75.2 | 73.6 | 2.2 |
| Qantas - all QF designated services | 231,962 | 77.9 | 78.8 | 3.2 |
| Rex Airlines | 52,716 | 73.0 | 76.0 | 2.5 |
| Skytrans Australia (formerly SmartLynx Australia) | 6,191 | 85.1 | 86.3 | 8.4 |
| Virgin Australia - all VA designated services | 145,379 | 76.0 | 77.0 | 1.7 |
| All Airlines | 551,349 | 76.9 | 77.7 | 2.5 |
| Individual operating entities | ||||
| Qantas | 88,886 | 77.2 | 79.7 | 2.7 |
| QantasLink | 143,076 | 78.3 | 78.3 | 3.6 |
| Virgin Australia | 143,031 | 76.0 | 77.2 | 1.7 |
| Virgin Australia Regional Airlines | 2,348 | 71.5 | 67.6 | 1.1 |
Figure 1. Total Industry Arrivals and Departures On Time by month from December 2020

Figure 2. Total Industry Cancellations by month from December 2020

Information and data on domestic aviation can be found at the following links.
- Australian domestic aviation activity—monthly publications
- Australian domestic aviation activity—time series
- Australian domestic aviation activity—annual publications
Below are graphs and summary analysis relating to domestic aviation activity.
Summary
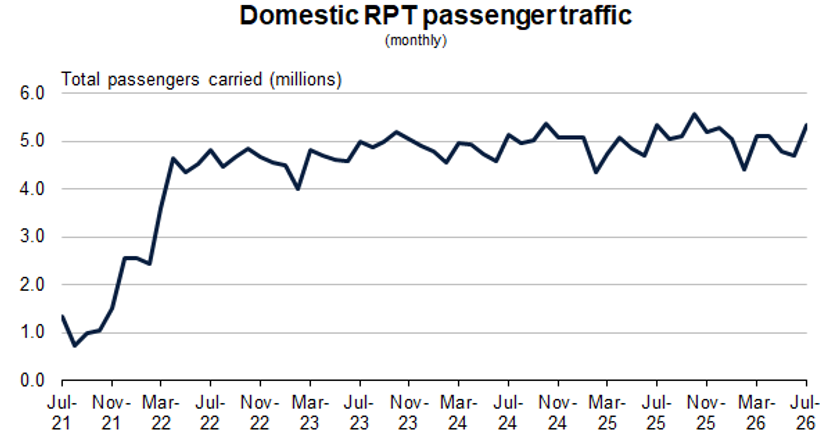
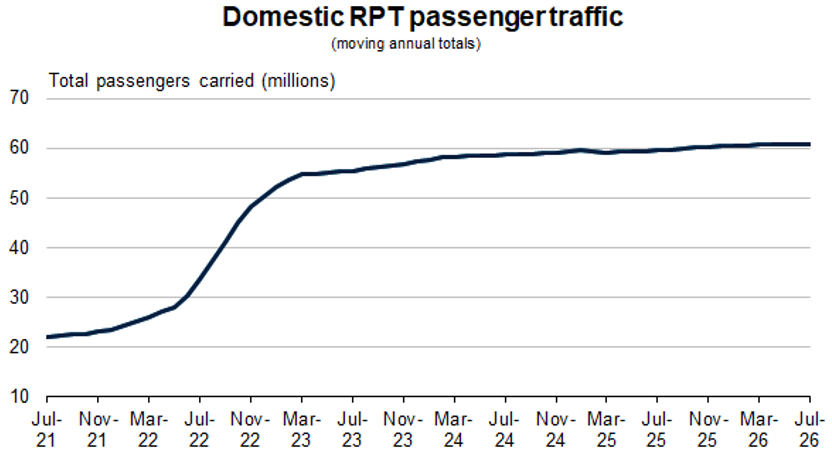
There were 5.76 million passengers carried on Australian domestic commercial aviation (including charter operations) in July 2026. There is virtually no change compared with July 2025. This is also an increase of 1.0% on pre-COVID July 2019 passenger numbers (5.70 million).
5.33 million passengers were carried on Regular Public Transport (RPT) flights in July 2026 (excluding charter operations), a decrease of 0.3% compared to July 2025.
For the month of July 2026, there were 52.1 thousand RPT aircraft trips, a decrease of 1.4% on July 2025.
For the year ending July 2026, there were 60.73 million RPT passengers, an increase of 1.8% on the year ending July 2025.
RPT revenue passenger kilometres (RPKs) performed were 6.58 billion for the month, compared with 6.61 billion in July 2025 (down 0.5%).
Capacity, measured by available seat kilometres (ASKs), decreased to 7.90 billion in July 2026 compared to 7.92 billion in July 2025 (down 0.2%).
The industry wide load factor (RPKs/ASKs) decreased from 83.4% in July 2025 to 83.2% in July 2026.
Total cargo movements at Australian airports on domestic RPT flights were 26.7 thousand tonnes in July 2026, a decrease of 5.9% compared with July 2025.
In July 2026, there were 2.35 million domestic passenger movements through regional airports. There was virtually no change compared to July 2025.
Fixed-wing charter operators carried 432.2 thousand passengers in July 2026, an increase of 4.9% compared with July 2025.
Summary of annual RPT activity
| YE July 2025 | YE July 2026 | % Change | |
|---|---|---|---|
| Total passengers carried (millions) | 59.66 | 60.73 | 1.8 |
| Revenue passenger kilometres (billions) | 71.94 | 73.23 | 1.8 |
| Available seats (millions) | 73.38 | 75.23 | 2.5 |
| Available seat kilometres (billions) | 86.56 | 89.06 | 2.9 |
| Load factor % | 83.1 | 83.2 | 0.1* |
| Aircraft trips (000s) | 599.8 | 602.1 | 0.4 |
* percentage point difference
Domestic airfares

BITRE's domestic airfare index monitors changes in the price of Australian air travel over time. Fares are collected monthly for the top 70 routes in the Australian domestic network.
Domestic discount airfares
Click the expand button at the bottom right of the dashboard to enter full screen mode.
Note: The above Power BI report may not display the most recent data available.
Cheapest available return fares from January 2010 to latest available data.
For Graphs, Summary table and Notes see further down the page.
Airfares collection methodology
Airfares time series from October 1992 to latest available data.
Graphs
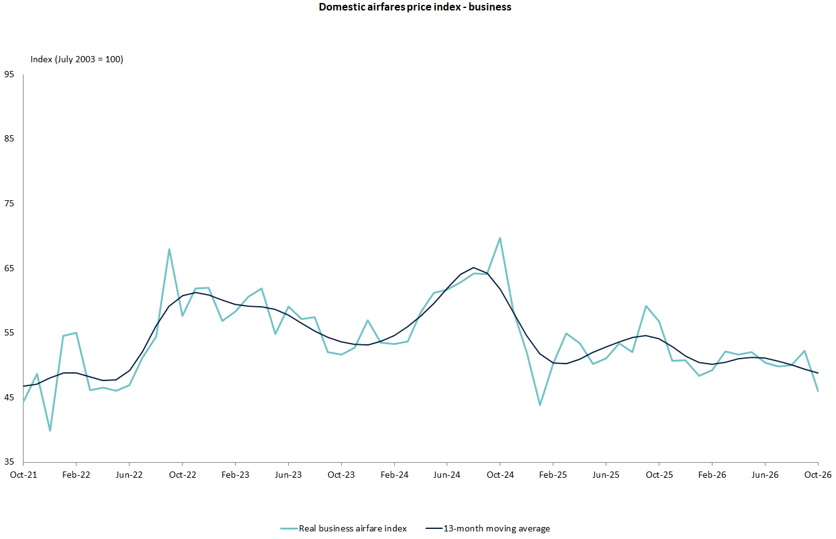
Domestic airfares (Business)
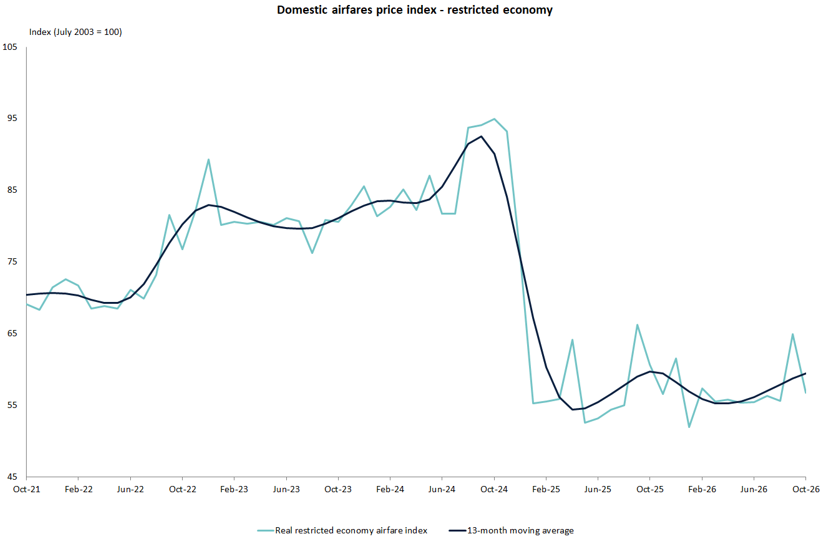
Domestic airfares (Restricted Economy)
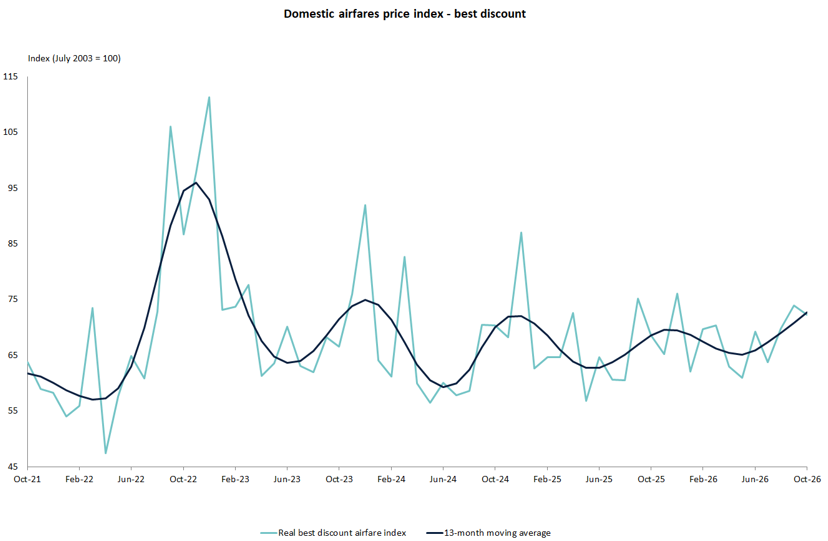
Domestic airfares (Best Discount)
Summary table
Real Domestic Airfare Index (July 2003 = 100)
| Survey Month | Best Discount | Business | Restricted Economy |
|---|---|---|---|
| Oct 2025 | 68.6 | 56.7 | 60.7 |
| Nov 2025 | 65.3 | 50.7 | 56.5 |
| Dec 2025 | 76.0 | 50.8 | 61.5 |
| Jan 2026 | 62.1 | 48.3 | 52.0 |
| Feb 2026 | 69.7 | 49.3 | 57.4 |
| Mar 2026 | 70.4 | 52.1 | 55.5 |
| Apr 2026 | 63.0 | 51.6 | 55.8 |
| May 2026 | 61.0 | 52.1 | 55.4 |
| Jun 2026 | 69.3 | 50.4 | 55.4 |
| Jul 2026 | 63.7 | 49.8 | 56.3 |
| Aug 2026 | 69.8 | 50.0 | 55.6 |
| Sep 2026 | 73.9 | 52.2 | 64.9 |
| Oct 2026 | 72.3 | 46.0 | 56.7 |
Notes
Indexes are constructed from BITRE's monthly survey of airline internet booking sites. Fares are recorded only when they are available on the nominated day of travel (the last Thursday of the month). The series is a price index of the lowest available fare in each fare class, weighted over selected routes. It does not measure real airline yields or average fares paid by passengers. For more information on methodology use the link at the top of this page.
Occasionally the index may record an unusual result when the nominated day of travel falls on, or adjacent to, a public holiday:
- The travel date fell on a public holiday for April 2024, December 2024 and December 2025.
- The travel date fell the day before a public holiday for December 2020, January 2024, March 2024 and December 2025.
- The return travel date fell the day before a public holiday in March 2020 and March 2022.
- The travel date for April 2025 fell between 2 public holidays.
- The travel date for January 2025 fell after a public holiday
April 2021 to current—Best Discount index: During the period of "Half Off" airfares made available through Tourism Aviation Network Support (TANS), the BITRE Airfares Survey has collected the cheapest available fare—using "Half Off" fares where available.
April 2021—Restricted Economy index: Virgin Australia Restricted Economy fares on some routes were noticeably lower this month. The Virgin Australia web site notes that complimentary food would no longer be provided on Economy class fares as of 25 March 2021. It is not clear what part this change has played in the reductions to Virgin Australia's Restricted Economy fares.
Business class fares from April 2020: Fares collected may not include normal entitlements like meals and lounge access during the period impacted by COVID-19.
Index calculation for April 2020 to November 2020: There were significant reductions to airline services in April and May 2020 in particular due to the COVID-19 pandemic and valid fares were not available for many routes covered by the survey. The indexes for April to November 2020 are based on the available routes during those months compared to the same routes in the base period.
November 2017 change to Restricted Economy index: From November 2017, refunds of Jetstar's Restricted Economy products (Starter with Max) for cancellations are only available in the form of vouchers. Vouchers may only be redeemed for other Jetstar products and are therefore considered by BITRE to be closer to a transfer than a full refund. This change in Jetstar's product places it outside BITRE's definition of a restricted economy fare, which has resulted in a sharp increase in the restricted economy index for November 2017.
March 2015—the Full Economy index is discontinued: From the middle of February 2015, Qantas Airways ceased offering Full Economy fares for domestic travel. It is no longer possible to produce an index for this fare category. In the future, if Full Economy fares are offered on sufficient routes, the index for this fare category could be reinstated.
December 2011 and January 2012 changes to Business and Full Economy indexes: Both the Business and Full Economy indexes were substantially affected by changes to fare offered. In December 2011 the Business index fell substantially mainly due to reductions in many of these fares by Qantas. This index again dropped significantly in January 2012 as Virgin Australia introduced Business class fares on many more of their routes. With the expansion of Virgin Australia's Business class fares they removed their Premium Economy class fare completely. The removal of these fares resulted in the Full Economy index rising substantially in January 2012.
June 2011 change to Restricted Economy index: In June 2011 both Virgin Australia and Jetstar introduced simplified fare structures. The new fare types used in constructing the indexes are shown on the Methodology page. The major impact of this change was to the Restricted Economy index. The new Virgin Australia fares used for this category (Flexi) were substantially lower than the previously used Virgin fares (Flexible). In a competitive response Qantas also reduced its Flexi Saver fares on competing routes. These changes produced a sharp drop in the Restricted Economy index.
February 2008 change to Full Economy index: Prior to February 2008 the Full Economy Fare category was based solely on the Qantas Fully Flexible Fare. From February 2008 on the category was expanded to include Virgin Blue's Corporate Plus Fare, leading to a drop in the index at the point of changeover.
Consumer price index source: Australian Bureau of Statistics, Catalogue No 6401.0. We acknowledge that the ABS has rebased CPI to September 2025 and this will be incorporated from the start of the 2026-27 financial year.
Airline on-time performance statistics—monthly summary
- Airline on-time performance—monthly reports and time series data
- Airline on-time performance—annual reports (financial and calendar years)
Summary—September 2026
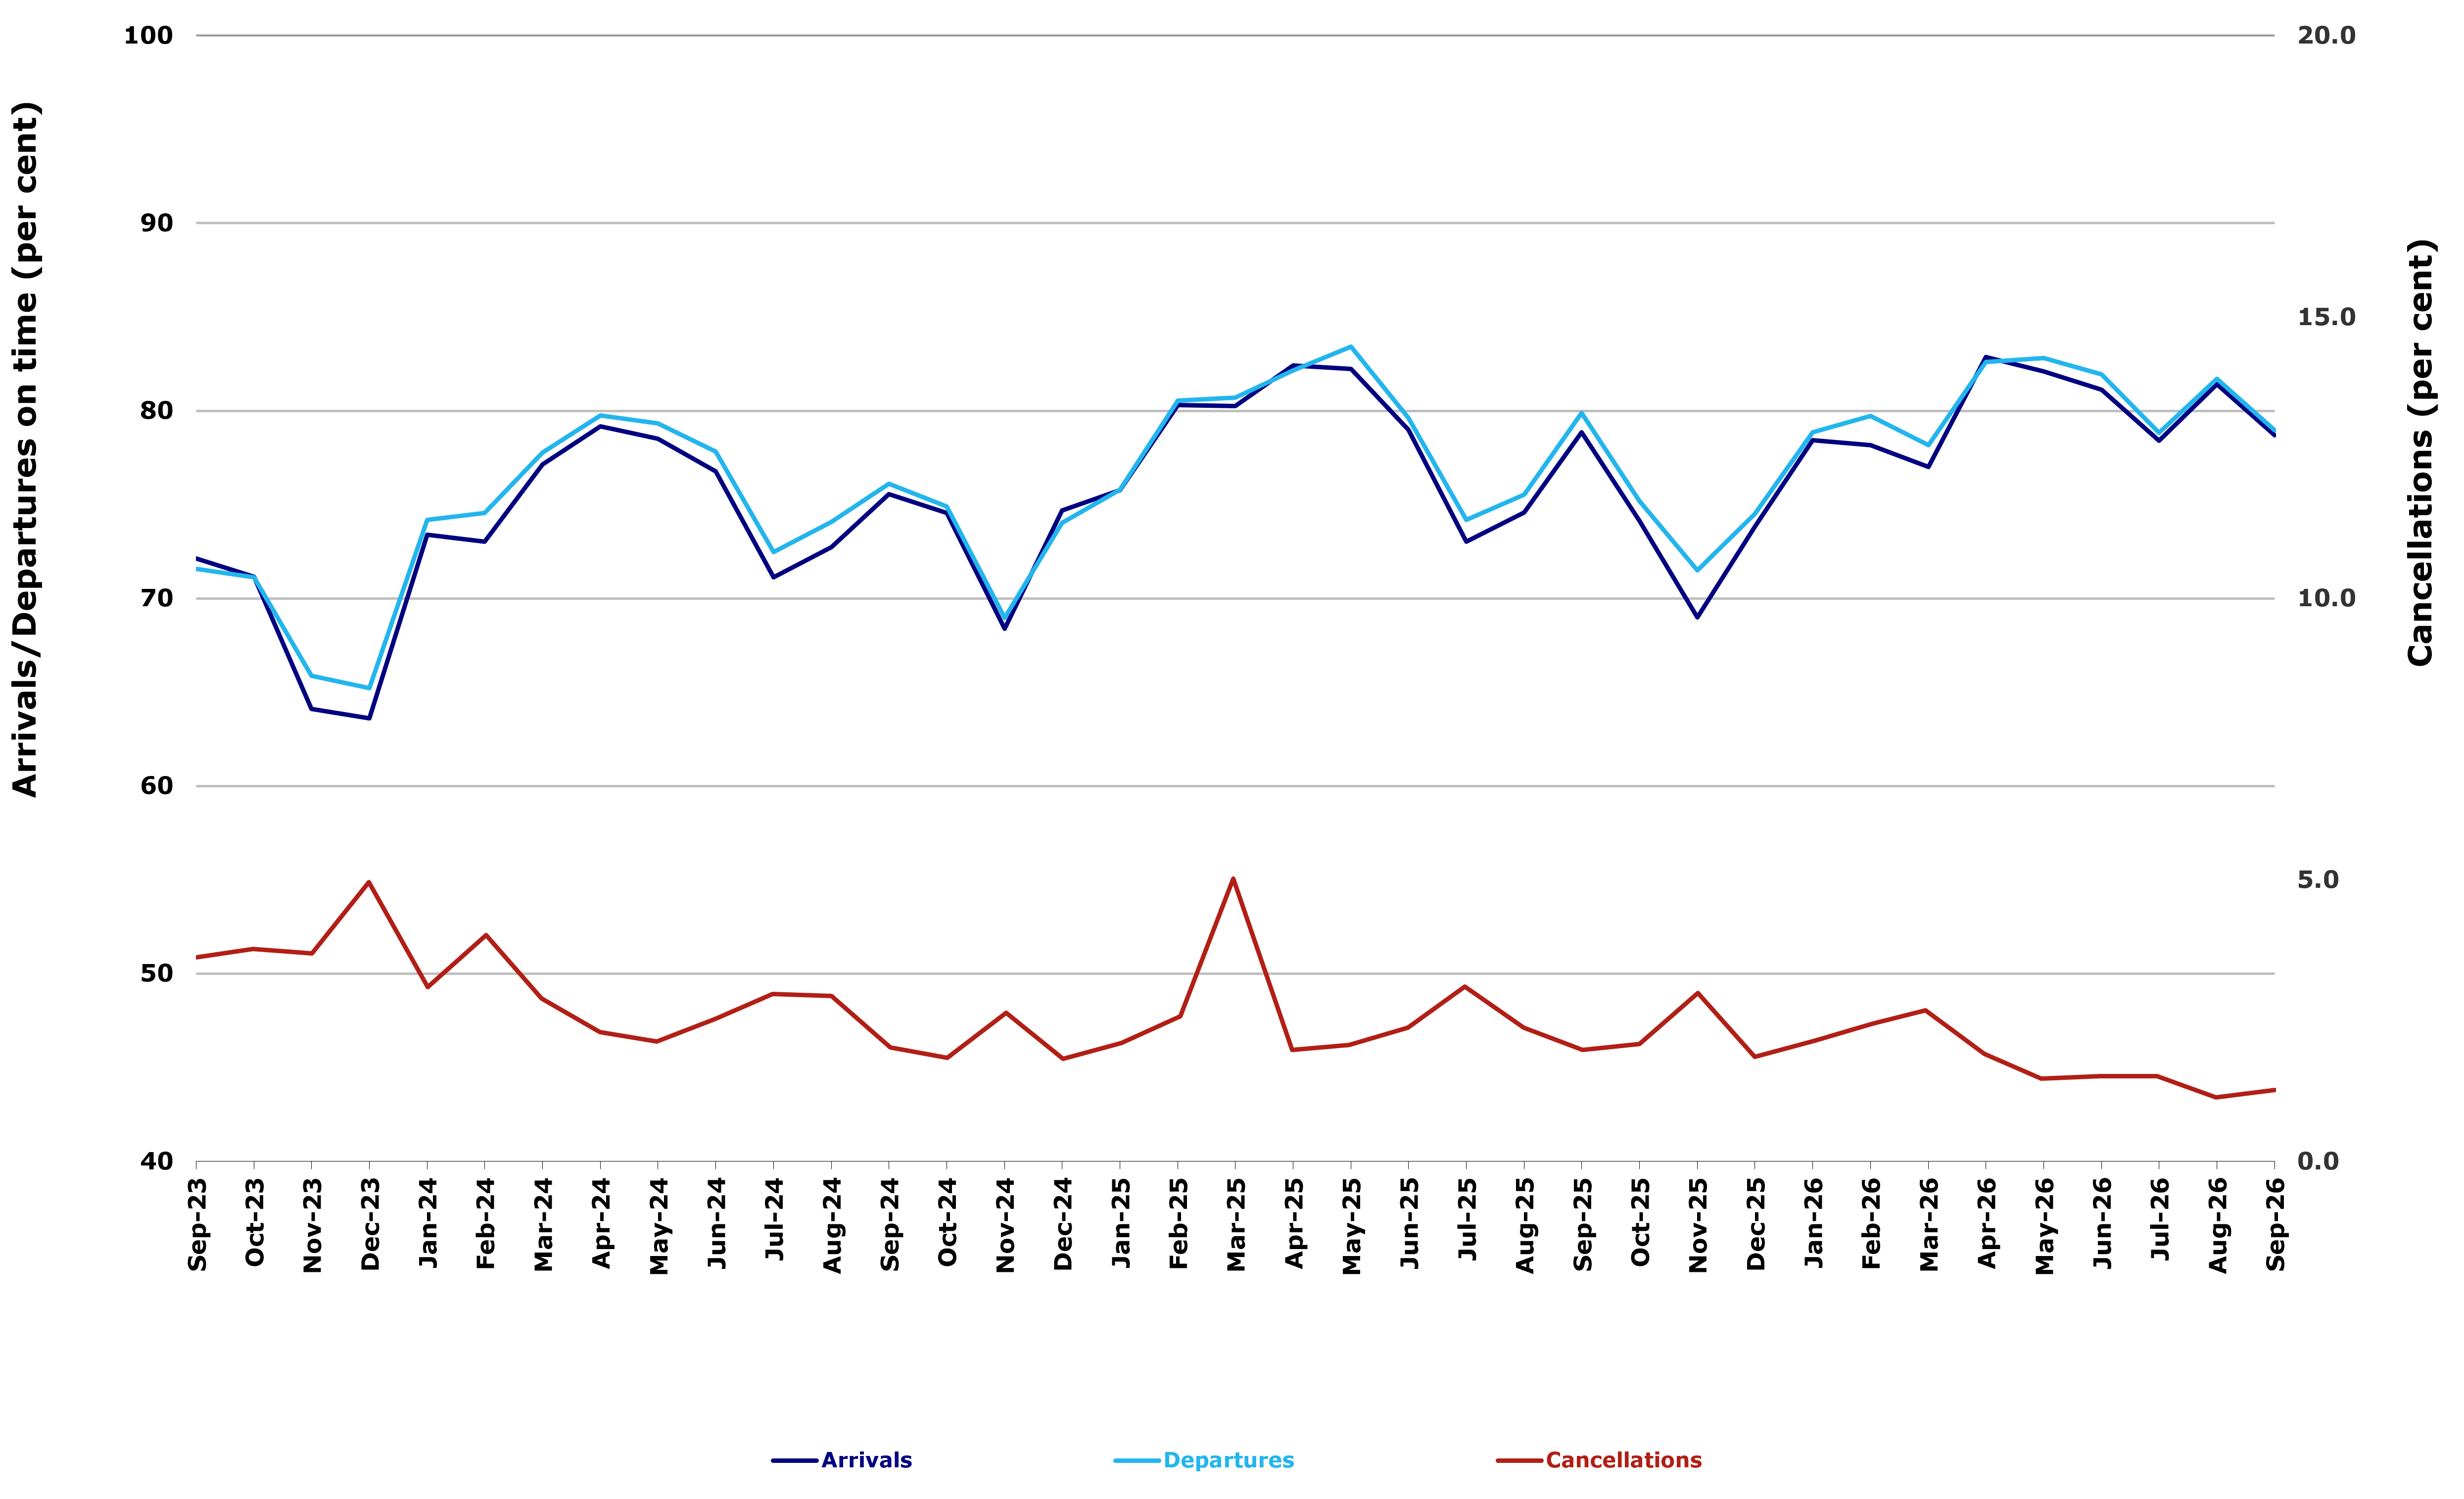
For September 2026, on-time performance over all routes operated by participating airlines (Hinterland, Jetstar, Qantas, QantasLink, Rex Airlines, Skytrans Australia, Virgin Australia and Virgin Australia Regional Airlines) averaged 78.7% for on-time arrivals and 79.0% for on-time departures. The cancellation rate for the month was 1.3%. The equivalent figures for September 2025 were 78.9% for on-time arrivals, 79.9% for on-time departures and 2.0% for cancellations.
This month’s on-time arrivals figure was lower than the long-term average (average over the period of OTP reporting starting in November 2003) performance for all routes (80.5%) and the on-time departures figure was also lower than the long-term average (81.6%). The rate of cancellations was lower than the long-term average of 2.2%.
On-time arrivals
The Qantas network (Qantas and QantasLink combined operations) recorded 82.5% for on-time arrivals while the Virgin Australia network (Virgin Australia and Virgin Australia Regional Airlines combined operations) recorded 74.2%. Hinterland achieved the highest on-time arrivals at 95.2%, followed by QantasLink at 83.5%, Qantas at 80.7%, Rex Airlines at 77.7%, Virgin Australia Regional Airlines at 76.9%, Virgin Australia at 74.2%, Jetstar at 73.8% and Skytrans at 69.6%.
On-time departures
The Qantas network recorded 83.2% for on-time departures while the Virgin Australia network recorded 74.3%. Hinterland achieved the highest level of on-time departures for September 2026 at 97.2%, followed by Qantas at 84.5%, QantasLink at 82.4%, Rex Airlines at 81.0%, Virgin Australia Regional Airlines at 80.2%, Virgin Australia at 74.2%, Jetstar at 71.4% and Skytrans Australia at 70.2%
Cancellations
Skytrans Australia recorded the highest percentage of cancellations at 3.3% during the month. The second highest cancellation rate was from QantasLink at 1.7%, Virgin Australia at 1.6%, Rex Airlines at 1.1%, Jetstar at 0.8%, Qantas at 0.7%, and Hinterland and Virgin Australia Regional Airlines both at 0.0%.
Routes
Airlines’ on-time performance varies across the routes they serve. Individual route data by specific airline for 59 routes (118 sectors when counting both directions of flights) are shown on pages 10-21 of the monthly report.
Of the 59 routes which met the criteria for on-time performance reporting in September 2026, the Brisbane-Mount Isa sector had the highest percentage of on-time arrivals (97.1%) and the highest percentage of on-time departures (95.7%). The Hamilton Island-Sydney sector had the lowest percentage of on-time arrivals (51.7%) and the lowest percentage of on-time departures (50.0%).
Cancellations were highest on the Canberra-Sydney and Port Lincoln-Adelaide sectors at 4.0%, followed by the Sydney-Canberra sector 3.7%, the Adelaide-Port Lincoln sector at 3.6%, the Ayers Rock-Melbourne, Kalgoorlie-Perth and Port Macquarie-Sydney sectors at 3.2%, the Orange-Sydney sector at 3.1%, the Adelaide-Sydney sector at 2.9% and the Melbourne-Sydney sector at 2.7%.
For the month of September 2026 30 out of the 118 route sectors (from the 59 routes) had zero cancellations: Adelaide-Alice Springs, Adelaide-Gold Coast, Adelaide-Perth, Alice Springs-Adelaide, Brisbane-Darwin, Brisbane-Emerald, Brisbane-Gladstone, Brisbane-Hamilton Island, Brisbane-Hobart, Brisbane-Launceston, Brisbane-Mount Isa, Brisbane-Newcastle, Brisbane-Proserpine, Canberra-Gold Coast, Emerald-Brisbane, Gold Coast-Adelaide, Gold Coast-Canberra, Hamilton Island-Sydney, Hobart-Brisbane, Launceston-Brisbane, Mount Isa-Brisbane, Newcastle-Brisbane, Perth-Adelaide, Perth-Darwin, Perth-Newman, Proserpine-Brisbane, Sydney-Ballina, Sydney-Hamilton Island, Sydney-Launceston and Melbourne-Ayers Rock.
Airports
Mount Isa Airport recorded the highest percentage of on-time arrivals (97.1%) while Emerald Airport had the highest percentage of on-time departures (94.2%). Launceston Airport recorded the lowest percentage of on-time arrivals (69.4%) while Hamilton Island Airport had the lowest percentage of on-time departures (55.5%). These figures only refer to reported routes and do not cover all flights at these airports.
Table 1: Total industry on-time performance for September 2026
| Reporting Airlines | Sectors Scheduled | Arrivals on-time % | Departures on-time % | Cancellations % |
|---|---|---|---|---|
| Hinterland | 1,632 | 95.2 | 97.2 | 0.0 |
| Jetstar | 8,188 | 73.8 | 71.4 | 0.8 |
| Qantas - all QF designated services | 19,489 | 82.5 | 83.2 | 1.4 |
| Rex Airlines | 4,378 | 77.7 | 81.0 | 1.1 |
| Skytrans Australia | 337 | 69.6 | 70.2 | 3.3 |
| Virgin Australia - all VA designated services | 11,882 | 74.2 | 74.3 | 1.6 |
| All Airlines | 45,906 | 78.7 | 79.0 | 1.3 |
| Individual operating entities | ||||
| Qantas | 6,993 | 80.7 | 84.5 | 0.7 |
| QantasLink | 12,496 | 83.5 | 82.4 | 1.7 |
| Virgin Australia | 11,700 | 74.2 | 74.2 | 1.6 |
| Virgin Australia Regional Airlines | 182 | 76.9 | 80.2 | 0.0 |
Figure 1: Total industry on-time performance by month from September 2023
Airline on-time performance—2025 calendar year
- Airline on-time performance—annual reports
- Airline on-time performance—monthly reports and time series data
Summary – 2025 Calendar Year
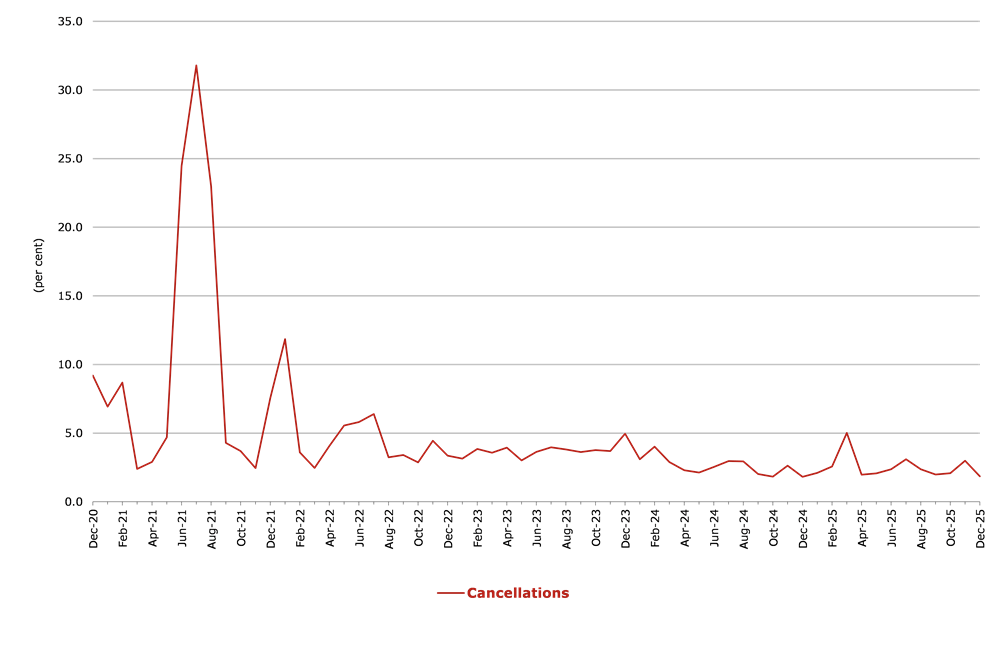
For the year ended December 2025, on time performance (OTP) over all routes operated by participating airlines (Hinterland, Jetstar, Qantas, QantasLink, Rex Airlines, Skytrans Australia (formerly Smartlynx Australia), Virgin Australia and Virgin Australia Regional Airlines) averaged 76.9 per cent for on time arrivals and 77.7 per cent for on time departures. The cancellation rate for the year was 2.5 per cent. The equivalent figures for 2024 were 74.6 per cent for on time arrivals, 75.4 per cent for on time departures and 2.6 per cent for cancellations. Airlines’ on time performance varies across the routes they serve. Individual route data by specific airline for 60 routes which operated for at least part of the 2025 calendar year are shown on pages 9-21.
The 2025 on time arrivals figure was lower than the long-term average (average over the period of OTP reporting starting in November 2003) performance for all routes (80.5 per cent) and the on time departures figure was also lower than the long-term average (81.6 per cent). The rate of cancellations was higher than the long-term average of 2.2 per cent.
On time arrivals
The Qantas network (Qantas and QantasLink combined operations) recorded 77.9 per cent for on time arrivals while the Virgin Australia network (Virgin Australia and Virgin Australia Regional Airlines combined operations) recorded 76.0 per cent. Hinterland achieved the highest on time arrivals at 88.4 per cent, followed by Skytrans Australia at 85.1 per cent, QantasLink at 78.3 per cent, Qantas at 77.2 per cent, Virgin Australia at 76.0 per cent, Jetstar at 75.2 per cent, Rex Airlines at 73.0 per cent and Virgin Australia Regional Airlines at 71.5 per cent.
On time departures
The Qantas network recorded 78.8 per cent for on time departures while the Virgin Australia network recorded 77.0 per cent. Hinterland achieved the highest level of on time departures for 2025 at 92.5 per cent, followed by Skytrans Australia at 86.3 per cent, Qantas at 79.7 per cent, QantasLink at 78.3 per cent, Virgin Australia at 77.2 per cent, Rex Airlines at 76.0 per cent, Jetstar at 73.6 per cent and Virgin Australia Regional Airlines at 67.6 per cent.
Cancellations
Skytrans Australia recorded the highest percentage of cancellations at 8.4 per cent during the year. The second highest cancellation rate was from QantasLink at 3.6 per cent, followed by Qantas at 2.7 per cent, Rex Airlines at 2.5 per cent, Jetstar at 2.2 per cent, Virgin Australia at 1.7 per cent, Virgin Australia Regional Airlines at 1.1 per cent and Hinterland at 0.8 per cent.
Routes
Of the 60 routes which met the criteria for OTP reporting, the Townsville-Cairns route (Jan 2025 only) had the highest percentage of on time arrivals (90.9 per cent) and the highest percentage of on time departures (90.9 per cent). For those routes reporting for the entirety of 2025, Emerald-Brisbane had the highest percentage of on time arrivals (89.8 per cent) and the highest percentage of on time departures (88.4 per cent). The Hamilton Island-Sydney route had the lowest percentage of on time arrivals (60.8 per cent) and the lowest percentage of on time departures (61.6 per cent).
Cancellations were highest on the Canberra-Sydney route at 6.2 per cent, followed by the Sydney-Canberra route at 5.6 per cent, the Port Lincoln-Adelaide and Sydney-Melbourne routes at 4.4 per cent, the Port Macquarie-Sydney and Melbourne-Sydney routes at 4.3 per cent, the Adelaide-Port Lincoln and Gladstone-Brisbane routes at 4.1 per cent, the Sydney-Port Macquarie route at 4.0 per cent and the Devonport-Melbourne route at 3.9 per cent.
Cancellations were lowest on the Melbourne-Ayers Rock at 0.0 per cent, followed by the Sydney-Hamilton Island route at 0.1 per cent, Ayers Rock-Melbourne and Sydney-Cairns routes at 0.3 per cent, and the Perth-Newman and Melbourne-Sunshine Coast routes at 0.4 per cent.
Airports
Of the airports with OTP reporting for 2025, Emerald Airport recorded the highest percentage of on time arrivals (86.2 per cent) and the highest percentage of on time departures (88.4 per cent). Port Macquarie Airport recorded the lowest percentage of on time arrivals (70.0 per cent) and Broome Airport recorded the lowest percentage of on time departures (64.8 per cent). These figures only refer to reported routes and do not cover all flights at these airports.
Table 1: Total industry on-time performance for 2025
| Reporting Airlines | Sectors Scheduled | Arrivals On Time % | Departures On Time % | Cancellations % |
|---|---|---|---|---|
| Hinterland | 18,415 | 88.4 | 92.5 | 0.8 |
| Jetstar | 96,686 | 75.2 | 73.6 | 2.2 |
| Qantas - all QF designated services | 231,962 | 77.9 | 78.8 | 3.2 |
| Rex Airlines | 52,716 | 73.0 | 76.0 | 2.5 |
| Skytrans Australia (formerly SmartLynx Australia) | 6,191 | 85.1 | 86.3 | 8.4 |
| Virgin Australia - all VA designated services | 145,379 | 76.0 | 77.0 | 1.7 |
| All Airlines | 551,349 | 76.9 | 77.7 | 2.5 |
| Individual operating entities | ||||
| Qantas | 88,886 | 77.2 | 79.7 | 2.7 |
| QantasLink | 143,076 | 78.3 | 78.3 | 3.6 |
| Virgin Australia | 143,031 | 76.0 | 77.2 | 1.7 |
| Virgin Australia Regional Airlines | 2,348 | 71.5 | 67.6 | 1.1 |
Figure 1. Total Industry Arrivals and Departures On Time by month from December 2020
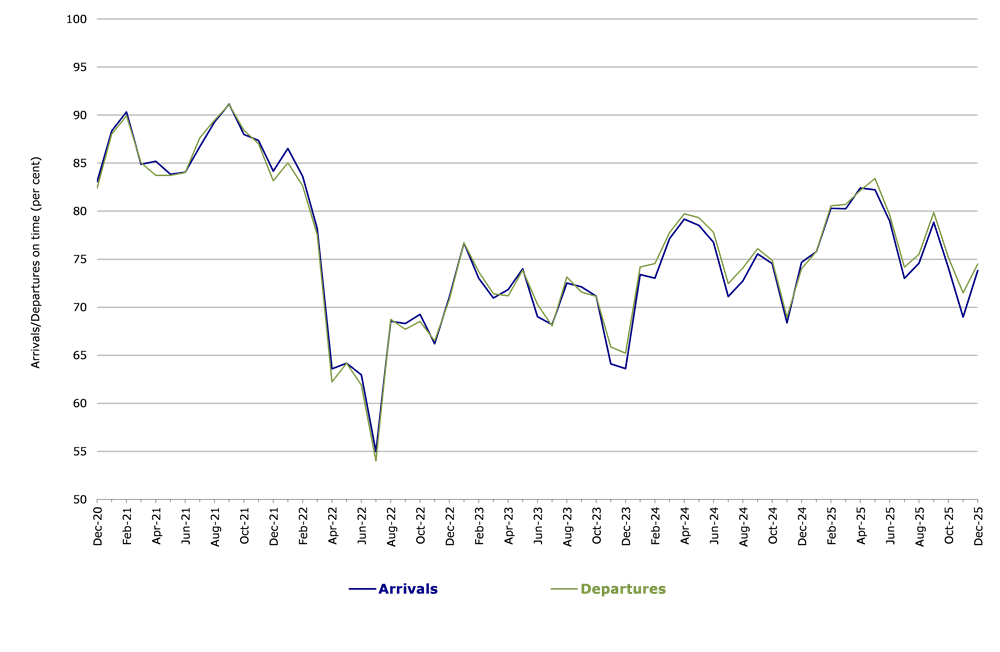
Figure 2. Total Industry Cancellations by month from December 2020
Economic measures of general aviation in Australia
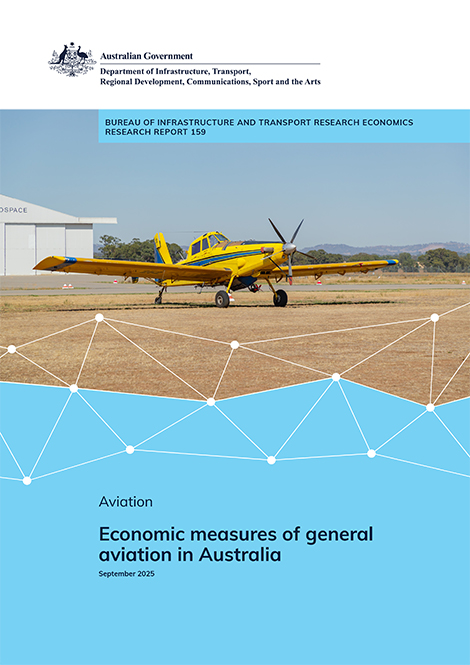
General aviation (GA) plays a range of essential roles in Australia including servicing regional communities, delivering education and health services, regional freight and transport, tourism, recreation, agricultural mustering and spraying, instructional flying, sport and pleasure flying, and emergency services. However, GA is not a stand-alone category in Australia’s System of National Accounts. Instead, it makes up a small subset of a very wide range of economic activities, making it difficult to estimate its actual economic impact. This study considers a range of sources, including innovative methods of matching aircraft registrations to business activity, to estimate the contribution of GA to Australia’s economy.
Australian Infrastructure and Transport Statistics—Yearbook 2024
The aim of the Australian Infrastructure Statistics and Transport Yearbook is to provide a single, comprehensive annual source of infrastructure statistics for use by policymakers, industry, transport analysts and the wider Australian community. You can download the PDF or data files:
- Australian Infrastructure and Transport Statistics—Yearbook 2024 (PDF 9.2 MB)
- Australian Infrastructure and Transport Statistics—Yearbook 2024 data (ZIP: 2 MB)
For a summary of each chapter select from the list below:








Australian aviation forecasts—2024 to 2050
Aviation plays a key role in Australia’s transport system, providing regular scheduled services between Australia's highly dispersed major population centres and vital connectivity for rural and remote communities. As a large island nation, located significant distances from our nearest neighbours, aviation is also the primary means of access for international visitors and for domestic residents travelling overseas.
This report presents long-term forecasts of Australian commercial air passenger and freight activity and forecasts of air passenger numbers through Australia’s 14 busiest airports / air catchments – i.e. Australia’s 8 capital cities and 6 busiest non-capital city airports – and air freight volumes through Australia’s mainland state capital city airports. The forecasts are based on econometric models of Australian domestic and international air passenger and air freight demand and the most recent long-term economic outlooks for Australia and developed and major developing countries. The forecasts are intended to help inform long-term Australian aviation policy development and planning.