
Domestic aviation activity—cities and regions

Below is a summary analysis of data from Regular Public Transport Domestic Aviation Activity in Australia by route type. The data file is available further down this page.
Summary—2025-26
Flights by route type
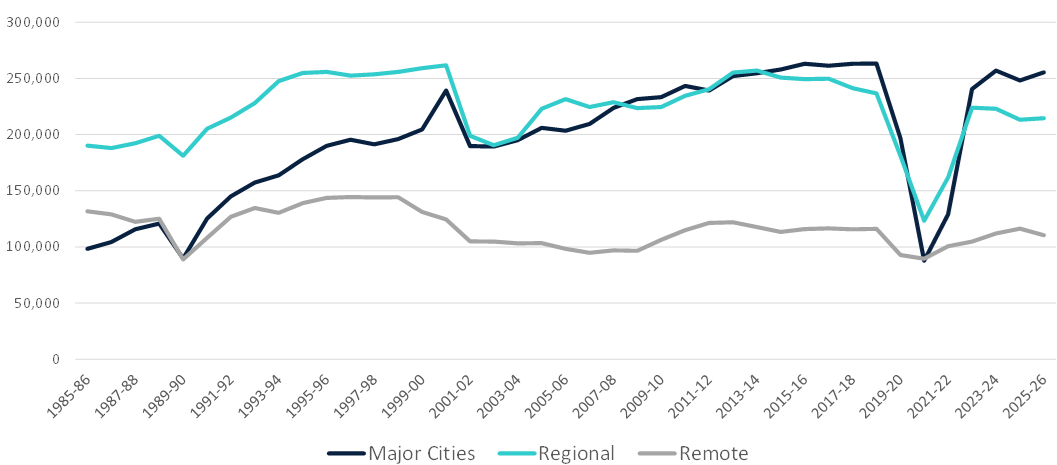
Flights on Regional and Remote routes combined dropped from 329,593 in 2024-25 to 325,063 in 2025-26 – a decrease of 1.4 per cent. Over the same period, flights between airports located in Major Cities increased from 248,206 to 255,570 - an increase of 3.0 per cent.
Passengers (millions) by route type
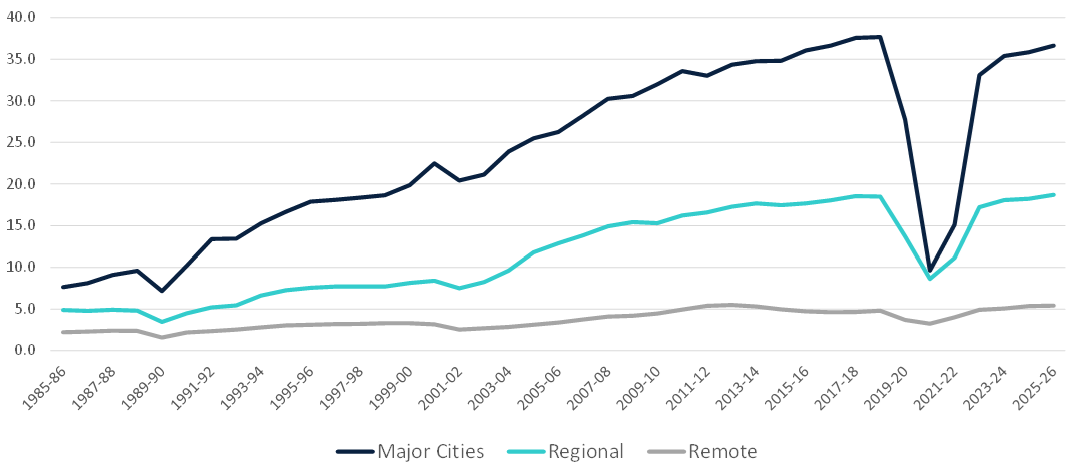
Passengers on Regional and Remote routes combined increased from 23.6 million in 2024-25 to 24.1 million in 2025-26 - an increase of 2.2 per cent. Over the same period, passengers carried between airports located in Major Cities increased from 35.8 million to 36.6 million - an increase of 2.2 per cent.
Load factors (RPKs/ASKs as a percentage) by route type
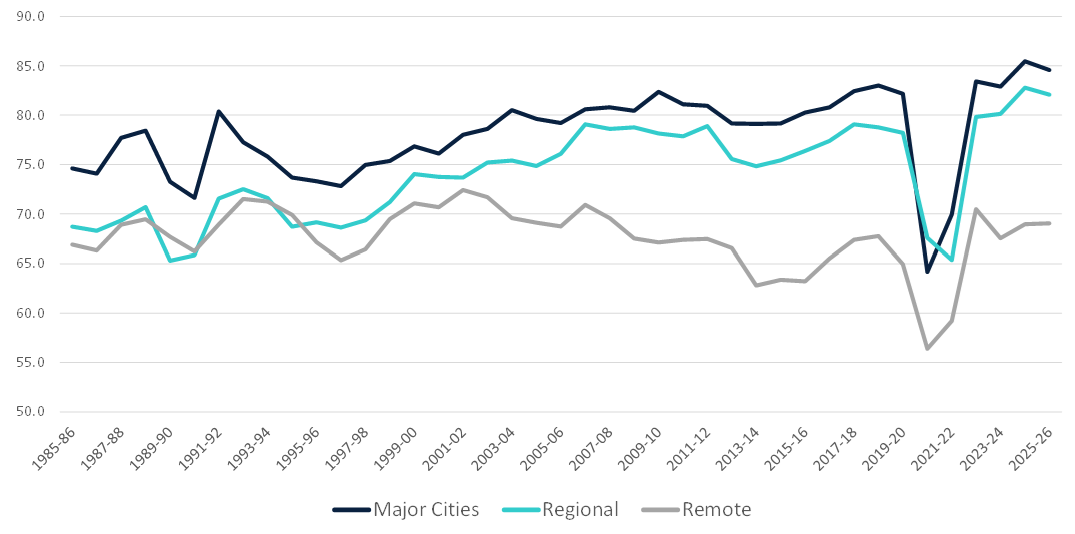
Load factor on Regional and Remote routes combined decrease from 79.1 per cent in 2024-25 to 78.7 per cent in 2025-26. Over the same period, the load factor on flights between Major cities decreased from 85.5 per cent to 84.6 per cent.
BITRE summary—Economic Contribution of Transport in Australia
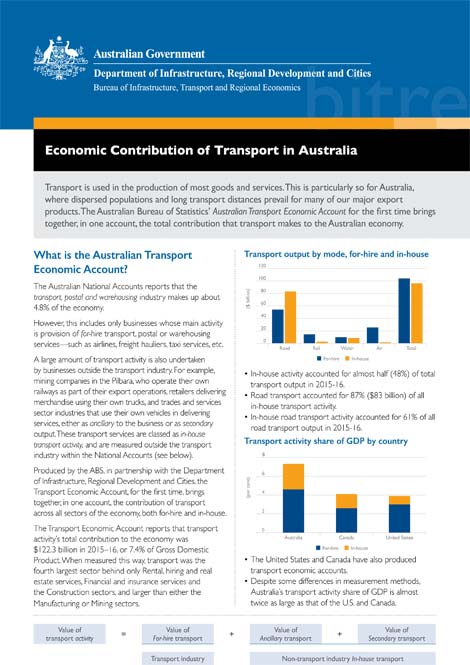
Experimental estimates of the economic contribution of all transport activity to the Australian economy.
- BITRE summary–Economic Contribution of Transport in Australia
Archived Road Deaths In Crashes Involving Heavy Vehicles—Quarterly Bulletins
Older issues of Road Deaths In Crashes Involving Heavy Vehicles – Quarterly Bulletins are available below.
Formerly entitled ‘Fatal heavy vehicle crashes Australia—Quarterly Bulletins’.
- Apr-Jun 2024
- Jan-Mar 2024
- Oct-Dec 2023
- Jul-Sep 2023
- Apr-Jun 2023
- Jan-Mar 2023
- Oct-Dec 2022
- Jul-Sep 2022
- Apr-Jun 2022
- Jan-Mar 2022
- Oct-Dec 2021
- Jul-Sep 2021
- Apr-Jun 2021
- Jan-Mar 2021
- Oct-Dec 2020
- Jul-Sep 2020
- Apr-Jun 2020
- Jan-Mar 2020
- Oct-Dec 2019
- Jul-Sep 2019
- Apr-Jun 2019
- Jan-Mar 2019
- Oct-Dec 2018
- Jul-Sep 2018
- Apr-Jun 2018
- Jan-Mar 2018
- Oct-Dec 2017
- Jul-Sep 2017
- Apr-Jun 2017
- Jan-Mar 2017
- Oct-Dec 2016
- Jul-Sep 2016
- Apr-Jun 2016
- Jan-Mar 2016
- Oct-Dec 2015
- Jul-Sep 2015
- Apr-Jun 2015
- Jan-Mar 2015
- Oct–Dec 2014
- Jul–Sep 2014
- Apr–Jun 2014
- Jan–Mar 2014
- Oct–Dec 2013
- Jul–Sep 2013
- Apr–Jun 2013
- Jan–Mar 2013
- Oct–Dec 2012
- Jul–Sep 2012
- Apr–Jun 2012
- Jan–Mar 2012
- Oct–Dec 2011
- Jul–Sep 2011
- Apr–Jun 2011
- Jan–Mar 2011
- Oct–Dec 2010
- Jul–Sep 2010
- Apr–Jun 2010
- Jan–Mar 2010
- Oct–Dec 2009
- Jul–Sep 2009
- Apr–Jun 2009
Australian transport statistics—June 2005
Australian Transport Statistics provides an easy introduction to a diverse range of transport statistics. Topics include employment, GDP, passenger and freight movements, trade, funding, motor vehicles, fatalities and estimated greenhouse gas emissions attributed to the transport industry. Various international comparisons are included and details provided for the road,rail, marine and aviation sectors. Data are gathered from various sources both within the Bureau of Transport and Regional Economics and external organisations.
About Australia's Regions 2003–06
Back issues of About Australia's Regions from 2003–06
- About Australia's Regions 2006
- About Australia's Regions 2005
- About Australia's Regions 2004
- About Australia's Regions 2003
FUELtrac has been commissioned by AAA to collect petrol price data in each capital city and major regional centres around Australia.
Sales of New Motor Vehicles
This publication presents monthly information on sales of new motor vehicles in each state/territory in original, seasonally adjusted and trend estimated terms. The original data are sourced from the Federal Chamber of Automotive Industries. Sales data are available for passenger vehicles, sports utility vehicles (SUVs), other vehicles and total vehicles at the state/territory and national levels.
International Freight to/from Australia
The Excel file below contains tables showing the value and weight of Australian international imports and exports each quarter, by sea freight (liner and non-liner) and by air. The time series covers the period from 3rd quarter 1984 to the 1st quarter 2007.
The Bureau of Transport and Regional Economics has taken due care in preparing the analyses contained in these tables. However, noting that data used for the analyses have been provided by third parties, the Commonwealth gives no warranty to the accuracy, reliability, fitness for purpose, or otherwise of the information.
- International Freight to/from Australia

Australian transport statistics Yearbook 2009
Australian Transport Statistics provides a short summary of a diverse range of transport statistics. Topics include employment, GDP, infrastructure expenditure, passenger and freight movements, trade, motor vehicles, fatalities and estimated greenhouse gas emissions attributed to the transport industry. Information is provided for the road, rail, maritime and aviation sectors. Data are gathered from various sources both within BITRE and external organisations.
- Australian transport statistics Yearbook 2009
- Australian transport statistics Yearbook 2009–Spreadsheets
