Greenhouse Gas Emissions to 2020: Projected Trends for Australian Transport
BTRE has completed projected greenhouse gas emissions and energy use by the Australian transport sector using two different methods.
- Greenhouse Gas Emissions to 2020: Projected Trends for Australian Transport
Freight Between Australian Cities 1972 to 2001
This paper provides estimates of non-bulk freight flows over seven intercity corridors for three decades from 1972 to 2001. Earlier estimates to 1995 were published in Information Sheet 17.
- Freight Between Australian Cities 1972 to 2001
Passenger Movements between Australian Cities, 1970–71 to 2030–31
BTRE has recently completed estimates of passenger movements by various modes (i.e. air, car, coach and rail) between major Australian cities (covering ten main routes) from 1970–71 to 2003–04 and predicted passenger flows up to 2030–31.
- Passenger Movements between Australian Cities, 1970–71 to 2030–31
Freight Rates in Australia 1964–65 to 2007–08
This Information Sheet provides indexed trends in average interstate non-bulk freight rates, from 1964–65 to 2007–08, updating the freight rate indexes previously published in Freight Rates in Australia, Information Sheet 19 (BTRE 2002). The estimates show that, following generally declining real freight rates over the previous two decades, real freight rates for road, rail and long-distance coastal shipping have risen since 2000–01 (Table 1 provides nominal and real indexed freight rate series and Figures 1 to 4 illustrate indexed trends in real freight rates). Recent increases in crude oil prices, and flow through to diesel fuel prices, have been an important contributing factor in recent freight rate increases for road, rail and coastal shipping.
- Freight Rates in Australia 1964–65 to 2007–08
Urban Passenger Transport: How People Move About in Australian Cities
Information Sheet 31 analyses the trends in passenger transport in Australia's eight capital cities over the period 1977 to 2008. Although car travel continues to dominate travel in our cities, urban public transport has accounted for much of the growth in travel from 2004 to 2008.
- Urban Passenger Transport: How People Move About in Australian Cities
Changes in Australia's Industry Structure: Main Cities 2001–06
BITRE's Industry Structure Database and information sheet 32 present the latest regional industry trends. The study analyses the shifting geography of employment and highlights the dynamics of industry structure in Australia's main cities between 2001 and 2006. This is an update of the first Industry Structure study (and the database) which was published in 2003.
- Changes in Australia's Industry Structure: Main Cities 2001–06
- Industry Structure Database 2009

Air transport Service Trends in Regional Australia (2009 Update)
This information sheet provides key trends in air transport services in regional Australia from 1984 to 2008, updating figures previously published in Air Transport Services in Regional Australia: Trends and Access, Report 115 (BITRE 2008) with new data from 2006 to 2008.
- Air transport Service Trends in Regional Australia (2009 Update)
Road and Rail Freight: Competitors or Complements?
Up until the early 1960s, railways dominated all but the shortest land-based freight task. Since then, vast improvements in road vehicle productivity and road infrastructure quality, the gradual removal of regulations restricting road freight carriage and the exponential growth in interstate trade has broadened the range of freight tasks for which road is better suited than rail.
- Road and rail freight: competitors or complements?
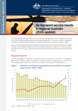
Fuel Consumption by New Passenger Vehicles in Australia 1979–2008

BITRE has examined trends in the fuel consumption of new passenger vehicles sold in Australia. Up to 2001, technological advances in engine technology, which improved fuel efficiency, were offset by increases in power, weight and the popularity of 4WD vehicles. Since 2001 the overall trend in fuel consumption has continued to decrease with average new light vehicle fuel consumption down 8.4 per cent to 8.14 litres per 100 kilometres (L/100 km).
- Fuel Consumption by New Passenger Vehicles in Australia 1979-2008
Urban Public Transport: Recent Bus Transport Statistics
This information sheet compiles data on urban public bus services by government and outsourced private sector providers in Australia's capital cities. Statistics examined include: total passenger boardings; passenger kilometres; in-service bus kilometres; boardings per service kilometre; bus services by capital city; and an overview of Australia's current bus systems.
- Urban Public Transport: Recent Bus Transport Statistics