Trainline 2 is a collaborative report between the Australasian Railway Association (ARA) and BITRE. It is a further development of the previous rail freight performance publications series and Trainline 1.
The report provides an overview of freight, urban and non-urban passenger rail. Traffic levels; infrastructure and rolling stock provision; and railway performance are considered.
- Trainline 2
Australian Sea Freight 2012-13
This is the latest in a series of BITRE reports that presents statistics on maritime freight in Australia and shows the trend of Australian sea freight over the most recent ten years. The information presented comprises international and coastal freight statistics, the use of coastal voyage permits, vessel activity at Australian ports, and the size and composition of the Australian trading fleet from 2003-04 to 2012-13.
Waterline 54—August 2014
Waterline reports on trends in (a) throughput, (b) container handling productivity on the waterfront and the land side of ports in Australia, and (c) the cost of importing and exporting containers. It covers both the unloading of container ships and the transport of containers from container terminals. In Waterline 54, rail throughput data provided by port authorities is incorporated in calculating the throughput and productivity indicators. This issue covers port terminal activity up to the December quarter 2013.
- Waterline No 54
Road Trauma Involving Heavy Vehicles—Annual Summaries
This report presents detailed information on fatal crashes involving heavy vehicles and forms an important part of the evidence base. See also the Quarterly bulletins.
Latest Year: 2021
- Road Trauma Involving Heavy Vehicles 2021 - Dashboard
2021 : At a glance
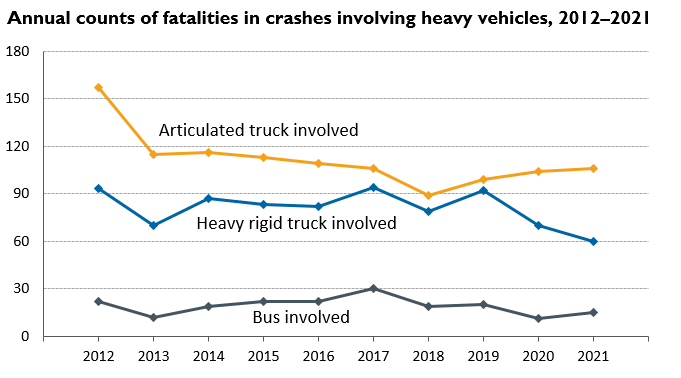
Annual counts of fatalities in crashes involving heavy trucks, 2012–2021
- In 2021, a total of 163 people were killed in crashes involving heavy trucks. This represents 15.4 per cent of total road deaths.
- Of the people killed in these fatal crashes, approximately 50 per cent are occupants in a light vehicle, 25 per cent are occupants in the heavy truck and 25 per cent are other road users (pedestrian, motorcyclist or pedal cyclist).
- The latest hospitalisation data (2019) shows that approximately 510 heavy truck occupants are hospitalised from road crashes each year.
Annual counts of fatalities in crashes involving a bus, 2012–2021
- There was a total of 15 people killed in crashes involving a bus. The trend over the last three years shows a reduction of 13.4 per cent per year.
- Of the people killed in these bus-involved fatal crashes, approximately 11 per cent are occupants of the bus, 33 per cent are occupants of a light vehicle and 57 per cent are other road users.
- Approximately 254 bus occupants are hospitalised from crashes each year.
Data presented in this publication was correct as at January 2023. Due to normal ongoing revisions in road deaths data, comparisons between this publication and later reports will result in minor discrepancies.
Archives
Freightline 1—Australia freight transport overview
The Freightline series is intended to provide information on interregional freight movements across Australia, filling a major gap in Australian transport-related data and information, to help better inform and support policy development and infrastructure planning. The Freightline series begins with a broad overview of the freight task, followed by separate commodity-specific issues that provide more detailed information about the size and location of major freight movements, supply chain composition and key infrastructure components. Freightline 1 (this issue) provides a broad overview of freight movements in Australia, highlighting some of the major commodity flows.
- Freightline 1–Australia freight transport overview
Freightline 2—Australia iron ore freight transport
The Freightline series is intended to provide information on interregional freight movements across Australia, filling a major gap in Australian transport-related data and information, to help better inform and support policy development and infrastructure planning. The Freightline series begins with a broad overview of the freight task, followed by separate commodity-specific issues that provide more detailed information about the size and location of major freight movements, supply chain composition and key infrastructure components. Freightline 2 (this issue) focusses on Australian iron ore transport supply chains and freight movements in 2011–12.
- Freightline 2–Australia iron ore freight transport
Waterline 53—January 2014
Waterline reports on trends in (a) throughput, (b) container handling productivity on the waterfront and the land side of ports in Australia, and (c) the cost of importing and exporting containers. It covers both the unloading of container ships and the transport of containers from container terminals. In Waterline 53, the format of the report has been revised and several new productivity measures have been introduced following consultation with industry. This issue covers port terminal activity up to the June quarter 2013.
- Waterline No 53
Bass Strait Passenger Vehicle Equalisation Scheme Monitoring Report No. 14
The Ministerial Directions governing the Bass Strait Passenger Vehicle Equalisation Scheme require us to produce a monitoring report every 2 years. The monitoring report pays specific regard to the movement of fare prices and the movement of the number of eligible passengers and the number of eligible passenger vehicles.
Tasmanian Freight Schemes—Parameter Review 2013
The Tasmanian Freight Equalisation Scheme operates according to Ministerial Directions (2012) using parameters recommended by the TFES Review Authority (1998). The Tasmanian Wheat Freight Scheme operates under separate Ministerial Directions approved on 25 January 2006.
Australian infrastructure statistics—Yearbook 2013 and Key Australian infrastructure statistics booklet
The Yearbook is an important piece of work for the Department and provides a comprehensive evidence base to examine long-term and emerging trends as well as inform policy development and regulatory reform in the transport, energy, water and communications sectors. It is the only comprehensive source of time series statistics for Australia's major areas of economic infrastructure. The Yearbook is accompanied by the first Key Australian Infrastructure Statistics booklet which is a summary of statistics from the Yearbook.
- Yearbook 2013–Australian Infrastructure Statistics
- Key Australian Infrastructure Statistics
- Australian Infrastructure Statistics
Yearbook 2013
Part 1–Infrastructure and the Economy
- Australian Infrastructure Statistics
Yearbook 2013
Part T–Transport
- Australian Infrastructure Statistics
Yearbook 2013
Part E–Energy
- Australian Infrastructure Statistics
Yearbook 2013
Part C–Communication
- Australian Infrastructure Statistics
Yearbook 2013
Part W–Water