Australian interstate, intrastate and capital city road freight forecasts – 2022 update
In Australia, road transport is the predominant mode for moving freight between and within states. It is a vital link in various logistics chains, providing access for freight to ports and terminals and urban freight distribution between warehouses and retail outlets. It is also the dominant mode for moving freight over relatively short distances and where other alternatives are not readily available.
This report presents estimates and forecasts of interstate, intrastate and capital cities freight volumes for each state and territory in Australia. Estimates cover the period 1970 to 2020 and forecasts from 2020 to 2040. The forecasts are based on a combination of statistical models relating historical trends in road freight volumes and economic activity, informed by assumptions about likely future long-term economic and demographic trends.
Road Vehicles, Australia, January 2022 (re-issue)
This release provides statistics relating to the number of vehicles registered for road use in Australia on 31st January 2022. The statistics encompass all vehicles that were registered with an Australian state or territory motor vehicle registry for unrestricted use on public roads, and reported by jurisdictions to the National Exchange of Vehicle and Driver Information System (NEVDIS). This is the first annual release of Road Vehicles Australia, which replaces the ABS Motor Vehicle Census, discontinued in 2021. More statistics are available on the BITRE website and data.gov.au.
Social Cost of Road Crashes
Updated content: this report replaces the version uploaded on Friday 14 October. Text and chart changes have been made to the report’s section on age.
The Australian National University (ANU) was engaged by the Bureau of Infrastructure and Transport Research Economics (BITRE) to develop a model to estimate the social cost of road crashes in Australia. The current study replicates and extends the previous BITRE costing study (BITRE, 2009) by using current data, improved methods and broader scope of analysis, including analysis of who bears the burden of road crashes. The current study also set out to aid in addressing three policy questions posed by BITRE by drawing on results of the costing study as well as a rapid review of relevant literature.
The ANU research team members include Emily Lancsar, Ralf Steinhauser, Siobhan Bourke, Robert Breunig, Russell Gruen, Leo Dobes, Liza Munira, Liliana Bulfone, Kathryn Glass, Cameron Gordon, and Jolene Cox.
The BITRE team was Tim Risbey and Dr Gary Dolman, with key contributions from Dr Mark Harvey, Leo Soames and Simon O'Mahony, and Neil Thompson from the Office of Road Safety.
BITRE greatly appreciated the assistance of stakeholders who provided data, participated in the two project workshops, and provided comments on the draft report.
Run-off road crashes in Australia, 2016-2020
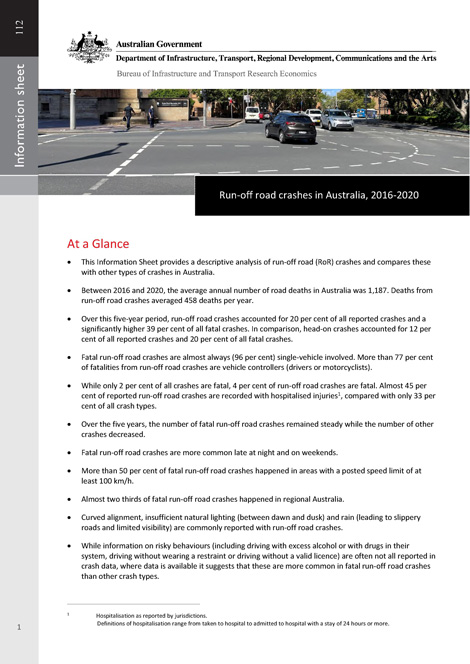
This Information Sheet provides descriptive analysis of run-off road (RoR) crashes and compares these with other types of crashes in Australia. Between 2016 to 2020, the average annual number of road deaths in Australia was 1,187. Deaths from run-off road crashes averaged 458 deaths per year. Run-off road crashes accounted for 20 per cent of all crashes and a significantly higher 39 per cent of all fatal crashes in Australia during the five-year period 2016 to 2020. Run-off road crashes form an important focus area in not only reducing total numbers of crashes but also the severity level of crashes.
Freight vehicle congestion in Australia’s five major cities – 2021
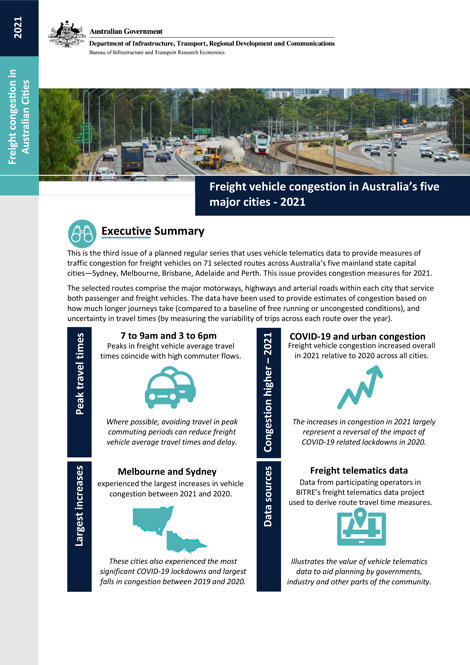
This publication is the third in the series that uses vehicle telematics data to provide measures of traffic congestion for freight vehicles for selected routes across Australia’s five mainland state capital cities—Sydney, Melbourne, Brisbane, Adelaide and Perth. The selected routes comprise the major motorways, highways and arterial roads within each city that service both passenger and freight vehicles. This release includes measures for 71 routes. The estimates presented in this report cover calendar year 2021, and include comparisons with 2020 traffic congestion levels.
The results show that freight vehicle congestion returned to pre-pandemic levels across all five mainland Australian capital cities in 2021, largely due to the return of commuter traffic in our cities, particularly during peak periods, following the impact of COVID-19 lockdowns in 2020. In particular, freight vehicle traffic congestion increases in 2021 were larger in Melbourne, and to a lesser extent Sydney, where lockdown-related reductions in congestion observed in 2020 were most significant. Relative to pre-COVID-19 congestion levels in 2019, freight vehicle congestion increases have been most significant in proportionate terms across Brisbane routes, even higher than experienced across Sydney and Melbourne routes. Brisbane routes also experienced the largest increases in average excess travel time variability (uncertainty) since 2019, greater than in Sydney and Melbourne. Copies of the data displayed in the report are available here and on data.gov.au.
Freight vehicle congestion in Australia’s five major cities – 2020
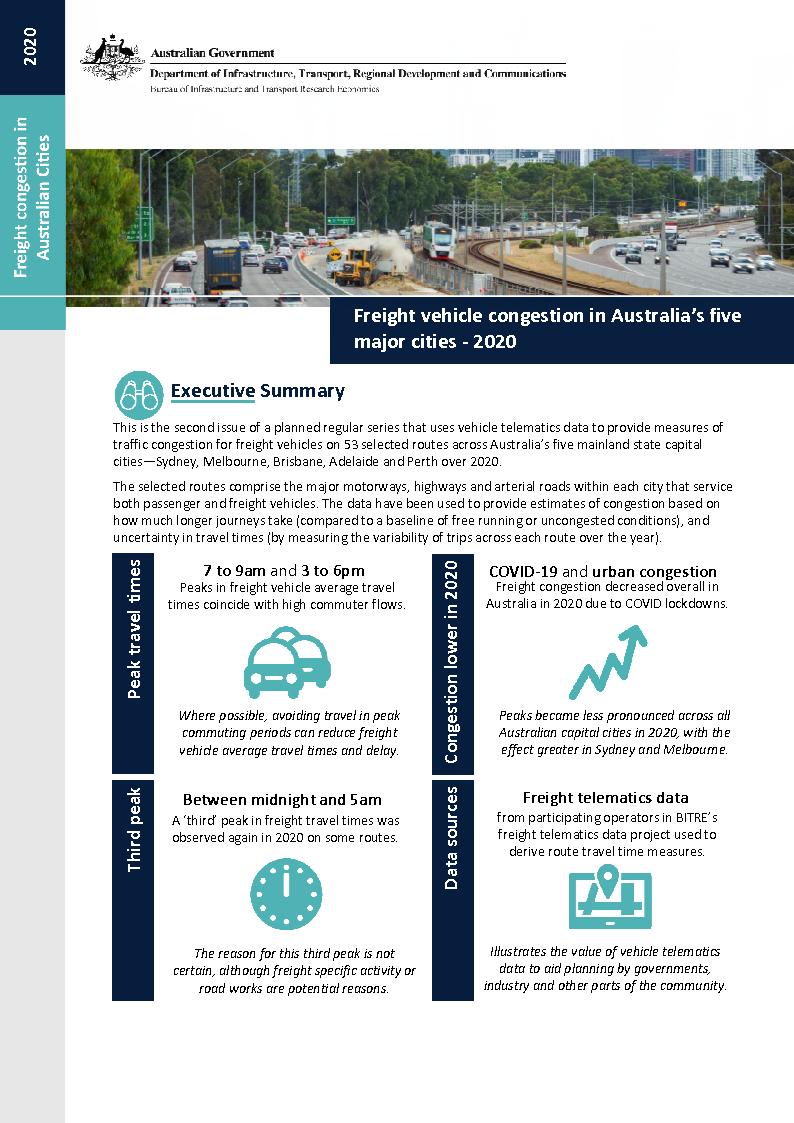
This publication is the second in a planned regular series that uses vehicle telematics data to provide measures of traffic congestion for freight vehicles on 53 selected routes across Australia’s five mainland state capital cities—Sydney, Melbourne, Brisbane, Adelaide and Perth. The selected routes comprise the major motorways, highways and arterial roads within each city that service both passenger and freight vehicles. The estimates presented in this report cover calendar year 2020, and includes a comparison with 2019 traffic congestion measures.
The results show that freight vehicle congestion decreased across all five mainland Australian capital cities in 2020, largely due to lower commuter activity on roads, particularly in peak periods, as a result of COVID-19 lockdowns. Whilst peak period travel times were less pronounced in 2020 across all cities, this effect was more significant in Sydney and Melbourne, because those cities had larger pre-COVID-19 traffic peaks and experienced longer lockdowns (particularly Melbourne), and less significant in other state capital cities. Copies of the data displayed in the report are available here and on data.gov.au.
Forecasting uptake of driver assistance technologies in Australia
This report uses an established modelling framework for forecasting the uptake of technologies that assist drivers and full vehicle automation in Australian light vehicles. Taking uncertainties into consideration, the report provides sensitivity analysis, based on several assumptions, to estimate the possible uptake of sales and fleet penetration till 2070. BITRE will maintain a watch on automated vehicles (AVs) as they are deployed and use the modelling framework to update its estimates when new information to inform forecasts becomes available.
- Forecasting uptake of driver assistance technologies in Australia [PDF: 7029 KB]
Archived Road Trauma Involving Heavy Vehicles—Annual Summaries
-
2020
-
2019
- 2018
- 2017
- 2016
- 2015
- 2014
- 2013
Archived International Road Safety Comparisons—Annual
- 2022
- 2020
- 2019
- 2018
- 2017
- 2016
- 2015
- 2014
- 2013
- 2012
- 2011
- 2010
- 2009
- 2007
- 2006
- 2005
- 2004
- 2003
- 2002
- 2001
- Monograph 6: Australia's International Road Safety Performance 1998
- Monograph 2: Australia's International Road Safety Performance 1997
- Pre-ATSB (FORS) Monograph 28: Australia's International Road Safety Performance 1996
- Pre-ATSB (FORS) Monograph 16: Australia's International Road Safety Performance
- CR 114: Trends in Road Crash Fatality Rates: International Comparisons with Australia 1970–1990 (1992)
Freight vehicle congestion in Australia’s five major cities - 2019

This publication is the first of a planned annual series that uses vehicle telematics data to provide measures of traffic congestion for freight vehicles on 53 selected routes across Australia’s five mainland state capital cities—Sydney, Melbourne, Brisbane, Adelaide and Perth. The selected routes comprise the major motorways, highways and arterial roads within each city that service both passenger and freight vehicles. The estimates presented in this report cover calendar year 2019.
The results show peaks in freight vehicle average travel times coincide with morning and evening peak commuter flows—for instance motorways tend to show morning peaks moving towards city CBDs and afternoon peaks moving away from it. Urban motorways exhibit more distinct travel time peak periods than non-motorway routes.