
Australian Infrastructure Statistics—Yearbook 2020
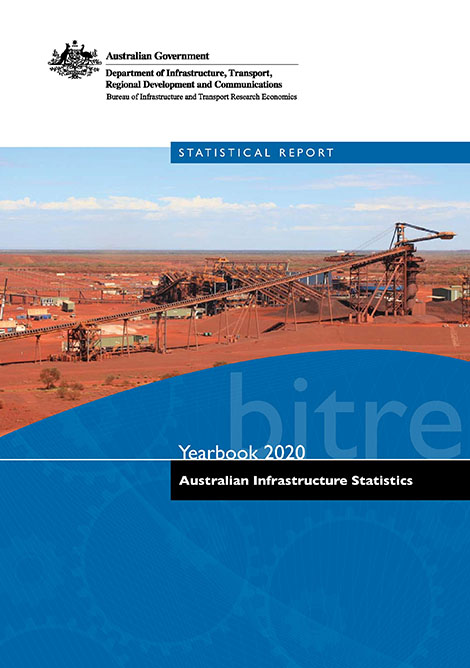
The aim of the Australian Infrastructure Statistics Yearbook is to provide a single, comprehensive annual source of infrastructure statistics for use by policymakers, industry leaders, transport analysts and the wider Australian community.
The publication is primarily a source of long-term, aggregate time series infrastructure statistics. Most statistics included in the publication are currently collected by BITRE or other Australian, state or territory government agencies.
The Yearbook is presented in 5 parts:
The yearbook is accompanied by the Key Australian Infrastructure Statistics Booklet which is a summary of statistics from the yearbook.
Bass Strait Passenger Vehicle Equalisation Scheme Monitoring Report No. 17
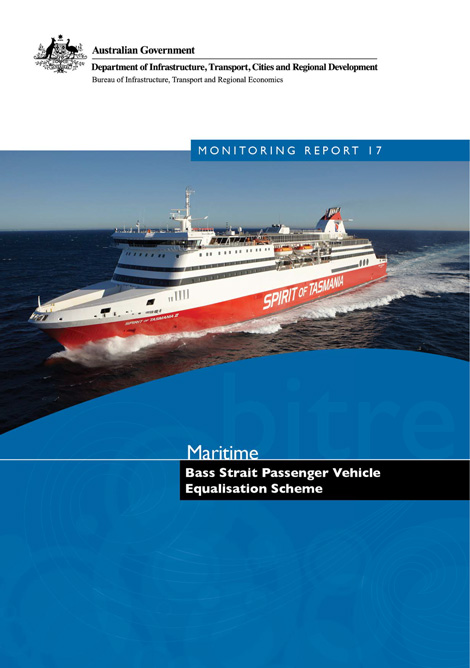
The Australian Government spent $104.1 million in the 2 years to 2018–19 ($51.3 million in 2018–19, and $52.8 million in 2017–18) on the Bass Strait Passenger Vehicle Equalisation Scheme (the Scheme).
Under the Scheme passengers travelling with a vehicle across Bass Strait can receive a rebate applied against the vehicle fare charged by a ferry operator.
Over the two-year monitoring period BITRE estimates that:
- The number of sea passengers with a motor vehicle may have been 29.2% higher than without the Scheme.
- Just under 26 000 additional visitors to Tasmania travelled by sea due to the Scheme in 2018–19 (28 600 new visitors in 2017–18).
These additional visitors to Tasmania spent an estimated $80.6 million in 2018–19 ($88.7 million in 2017–18).
Australian Infrastructure Statistics—Yearbook 2019
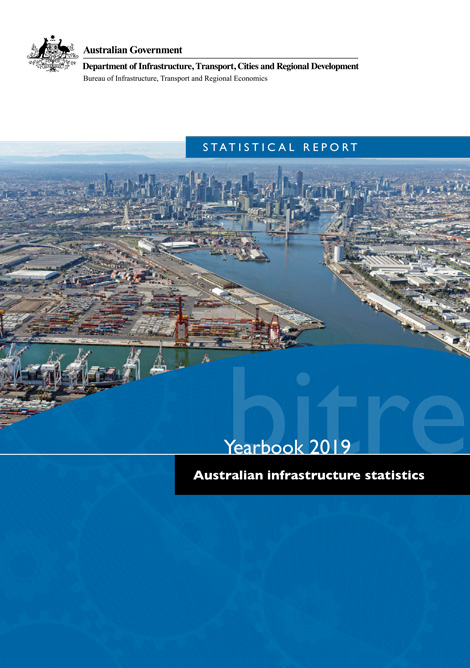
The Australian infrastructure statistics yearbook provides a comprehensive evidence base to examine long-term and emerging trends as well as inform policy development and regulatory reform in the transport, energy, water and communications sectors. It is the only comprehensive source of time series statistics for Australia's major areas of economic infrastructure. The yearbook is accompanied by the Key Australian Infrastructure Statistics Booklet which is a summary of statistics from the yearbook.
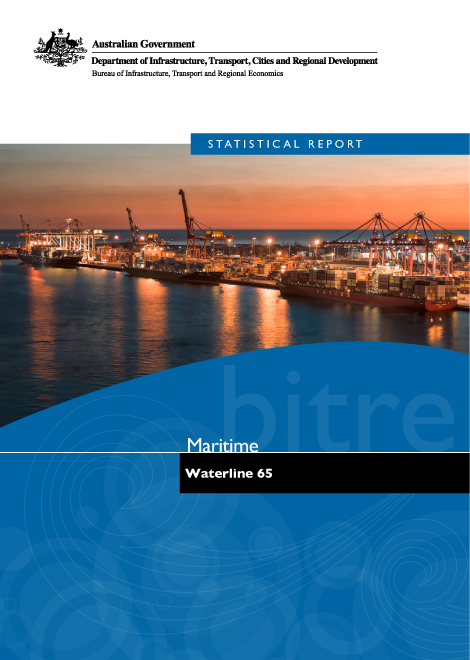
Waterline reports on trends in throughput, container handling productivity on the waterfront and landside of ports in Australia and the cost of importing and exporting containers via 5 container ports. It covers the loading and unloading of container ships and the transport of containers from container terminals.
This issue covers port terminal activity up to the June quarter 2019.
Australian aggregate freight forecasts—2019 update
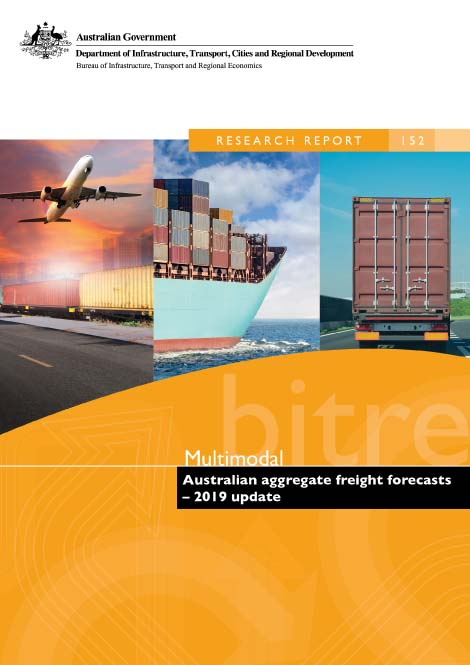
This report presents long-term forecasts of total Australian freight volumes for road, rail, coastal shipping and aviation between 2018 and 2040. The forecasts are based on a combination of statistical models relating historical trends in freight volumes and economic activity, informed assumptions about likely future long-term economic and demographic trends, and international assumptions about likely future world demand for key Australian export commodities. This report represents the first issue in BITRE's revamped forecasting series, which aims to provide regularly updated long-term forecasts of Australian freight activity by major transport mode at national, state, territory and regional scales.
Australian sea freight 2016-17
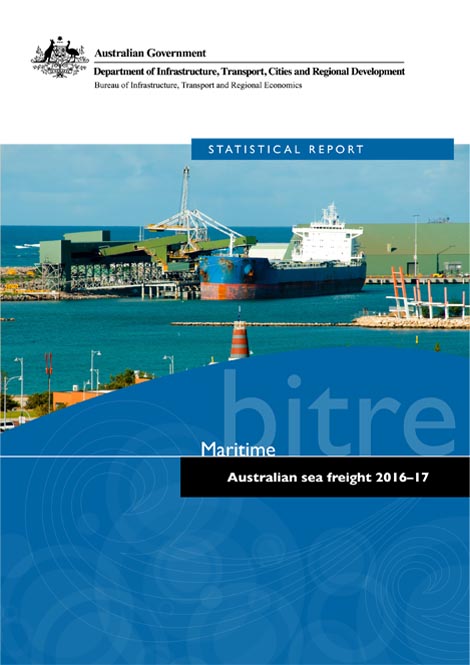
This is the latest in a series of Bureau of Infrastructure, Transport and Regional Economics (BITRE) reports that provide information on Australian sea freight movements, vessel activity, the use of coastal trading licences, and the size and composition of the Australian trading fleet. This report contains statistics on maritime freight and shipping activities in Australia from 2007–08 to 2016–17.
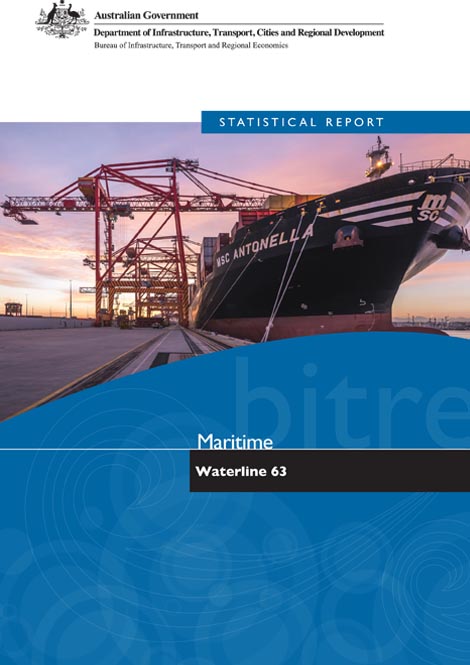
Waterline reports on trends in throughput, container handling productivity on the waterfront and the landside of ports in Australia, and the cost of importing and exporting containers via 5 container ports. It covers the loading and unloading of container ships and the transport of containers from container terminals.
This issue covers port terminal activity up to the June quarter 2018.
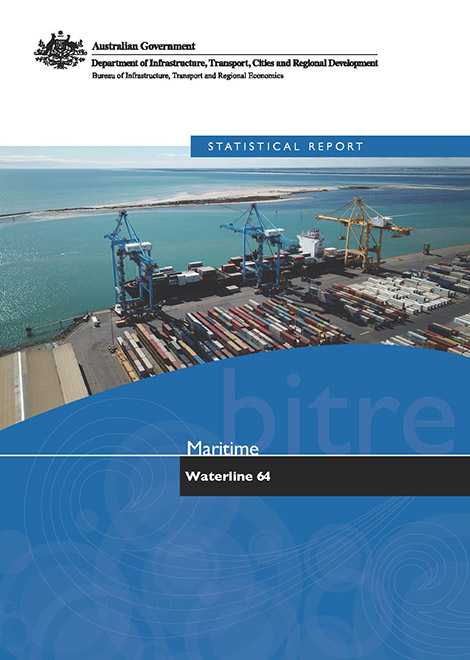
Waterline reports on trends in throughput, container handling productivity on the waterfront and landside of ports in Australia, and the cost of importing and exporting containers via 5 container ports. It covers the loading and unloading of container ships and the transport of containers from container terminals.
This issue covers port terminal activity up to the December quarter 2018.
BITRE summary—Economic Contribution of Transport in Australia
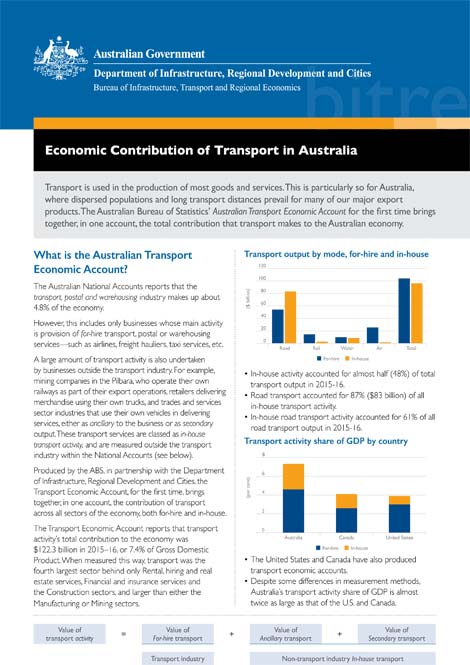
Experimental estimates of the economic contribution of all transport activity to the Australian economy.
- BITRE summary–Economic Contribution of Transport in Australia
Australian Infrastructure Statistics—Yearbook 2018
The Australian infrastructure statistics yearbook provides a comprehensive evidence base to examine long-term and emerging trends as well as inform policy development and regulatory reform in the transport, energy, water and communications sectors. It is the only comprehensive source of time series statistics for Australia's major areas of economic infrastructure. The yearbook is accompanied by the Key Australian Infrastructure Statistics Booklet which is a summary of statistics from the yearbook.
To complement the Australian Infrastructure Statistics Yearbook, BITRE has developed an Infrastructure Construction Dashboard. The Infrastructure Construction Dashboard presents quarterly updates on transport, communications, energy and water infrastructure construction, based on the ABS Engineering Construction Activity series.
- Yearbook 2018–Australian Infrastructure Statistics
- Key Australian Infrastructure Statistics 2018
- Australian Infrastructure Statistics Yearbook 2018 Part I–Infrastructure and the Economy

- Australian Infrastructure Statistics Yearbook 2018 Part T–Transport
- Australian Infrastructure Statistics Yearbook 2018 Part E–Energy
- Australian Infrastructure Statistics Yearbook 2018 Part C–Communication
- Australian Infrastructure Statistics Yearbook 2018 Part W–Water