
Waterline 62—October 2018
Waterline reports on trends in throughput, container handling productivity on the waterfront and landside of ports in Australia, and the cost of importing and exporting containers via 5 container ports. It covers the loading and unloading of container ships and the transport of containers from container terminals.
This issue covers port terminal activity up to the December quarter 2017.
Forecasting Australian Transport: A Review of Past Bureau Forecasts
A common rational for the making of transport-related forecasts is the need to anticipate the growth of transport activity and the demand it will place on transport infrastructure. Anticipation of this demand allows for forward planning of needed improvements/additions to key parts of the networks.
As such, it is useful to examine how close past Bureau forecasts were to predicting this growth, and to learn from any obvious errors.
This is the aim of the current report.
- Forecasting Australian Transport: A Review of Past Bureau Forecasts
Australian sea freight 2015–16
This is the latest in a series of Bureau of Infrastructure, Transport and Regional Economics (BITRE) reports that provide information on Australian sea freight movements, vessel activity, the use of coastal trading licences, and the size and composition of the Australian trading fleet. This report contains statistics on maritime freight and shipping activities in Australia from 2006–07 to 2015–16.
Bass Strait Passenger Vehicle Equalisation Scheme Monitoring Report No. 16
The Australian Government spent $44.7 million in 2016–17 on the Bass Strait Passenger Vehicle Equalisation Scheme (the Scheme), and $44.1 million in 2015–16.
Under the Scheme passengers travelling with a vehicle across Bass Strait can receive a rebate applied against the vehicle fare charged by a ferry operator.
Over the two-year monitoring period we estimate that:
- The number of sea passengers with a motor vehicle may have been 29.0% higher than without the Scheme.
- Just under 26 450 additional visitors to Tasmania travelled by sea due to the Scheme in 2016–17 (27 650 new visitors in 2015–16).
These additional visitors to Tasmania spent an estimated $71.4 million in 2016–17 ($74.6 million in 2015–16).
Tasmanian Freight Equalisation Scheme - review of the expanded component: Final Report
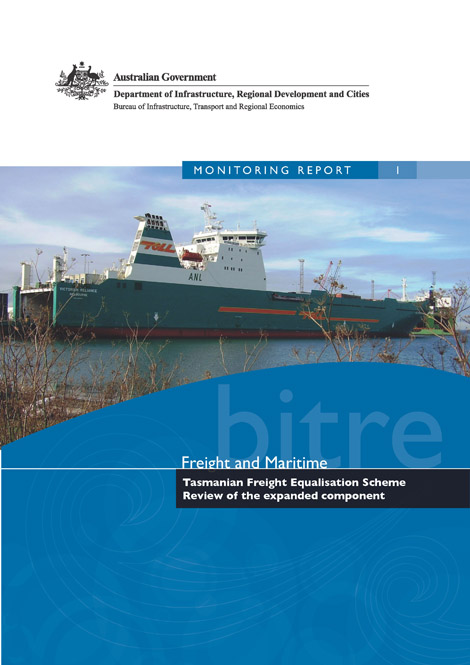
In March 2015 the Australian Government responded to the Productivity Commission's (2014) Tasmanian Shipping and Freight Report by announcing the Tasmanian Freight Equalisation Scheme (TFES) would be expanded from 1 January 2016 to provide assistance to goods going to markets not previously covered by the Scheme.
The announcement included a new monitoring process, with the Bureau of Infrastructure, Transport and Regional Economics (BITRE) to conduct an initial review of the expanded component in 2017 (this review). Thereafter, monitoring of the expanded component will become part of the BITRE's general TFES monitoring reviews commencing in 2019.
In terms of the level and appropriateness of the flat rate for the expanded component, BITRE's finding in this 2017 review are that:
- There is little relevant information on overall rate trends for freight shipped due to a limited claims history and many destinations.
- The appropriate benchmark for freight costs is the shipping cost across Bass Strait as, to be eligible, freight must be transhipped via an Australian mainland port.
BITRE sought public comment on a draft of this review in December 2017. Two submissions were received (including one after the finalisation of the report).
The Australian Government's response is available here.
Greenhouse gas abatement potential of the Australian transport sector—Summary report
In recognition of both the progress of climate science and the need to manage the risks faced by future generations, the majority of the world's governments are implementing programs for the long term reduction of greenhouse gas emissions. Accordingly, the Australian government has committed to an 80 per cent reduction on the 2000 levels of emissions for the Australian economy by 2050.
As the second largest greenhouse gas emission contributing sector in the economy at 16% of national emissions, transport will need to make a significant contribution to the abatement target. The question then arises as to the potential greenhouse gas abatement options available to the sector.
The Australian transport industry, researchers and government have in many cases deep knowledge about the issues of environmental sustainability, and individual transport sector greenhouse gas abatement options. However, that knowledge is fragmented due to the diversity and complexity of transport.
There are existing studies of transport abatement options but they are limited to a narrow subset of the available options. As a consequence no single document is available to provide an overview of the options and potential for abatement in the transport sector. With this background the ARRB Group, BITRE and CSIRO formed the Australian Low Carbon Transport Forum (ALCTF) in July 2011 to bring together knowledge on the options for greenhouse gas abatement in transport and explore how deeply emissions could be cut in the sector.
- Greenhouse gas abatement potential of the Australian transport sector–Summary report
Greenhouse gas abatement potential of the Australian transport sector—Technical report
The Australian Low Carbon Transport Forum (ALCTF) was initiated by a project secretariat comprising ARRB Group, BITRE and CSIRO. It was organised to bring together knowledge on the options for greenhouse gas abatement in transport and explore how deeply emissions could be cut in the sector.
A report describing the main findings of the study has been published under the title Greenhouse gas abatement potential of the Australian transport sector: Summary report.
This current Technical Report is a companion document to the Summary Report, and aims to detail the methodology and results of the ALCTF process. That is, it describes how the estimated levels of abatement were calculated for each of the abatement options considered in the ALCFT workshops, and how the various abatement potentials were aggregated into an estimate for the maximal potential reduction.
- Greenhouse gas abatement potential of the Australian transport sector–Technical report
Waterline 61—December 2017
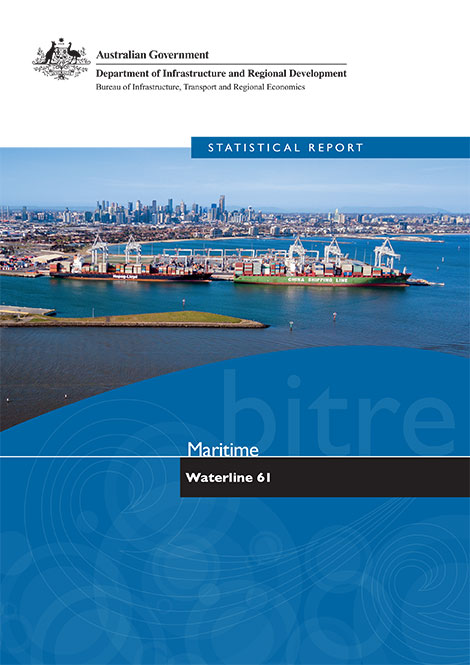
Waterline reports on trends in throughput, container handling productivity on the waterfront and landside of ports in Australia, and the cost of importing and exporting containers via 5 container ports. It covers the loading and unloading of container ships and the transport of containers from container terminals.
This issue covers port terminal activity up to the June quarter 2017.
Australian Infrastructure Statistics—Yearbook 2017
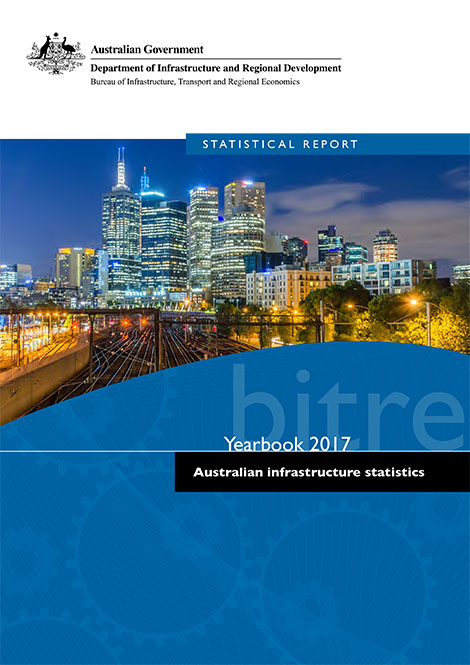
The Australian infrastructure statistics yearbook provides a comprehensive evidence base to examine long-term and emerging trends as well as inform policy development and regulatory reform in the transport, energy, water and communications sectors. It is the only comprehensive source of time series statistics for Australia's major areas of economic infrastructure. The yearbook is accompanied by the Key Australian Infrastructure Statistics Booklet which is a summary of statistics from the yearbook.
- Yearbook 2017–Australian Infrastructure Statistics
- Key Australian Infrastructure Statistics 2017
- Australian Infrastructure Statistics Yearbook 2017 Part I–Infrastructure and the Economy

- Australian Infrastructure Statistics Yearbook 2017 Part T–Transport
- Australian Infrastructure Statistics Yearbook 2017 Part E–Energy
- Australian Infrastructure Statistics Yearbook 2017 Part C–Communication
- Australian Infrastructure Statistics Yearbook 2017 Part W–Water
Waterline 60—August 2017
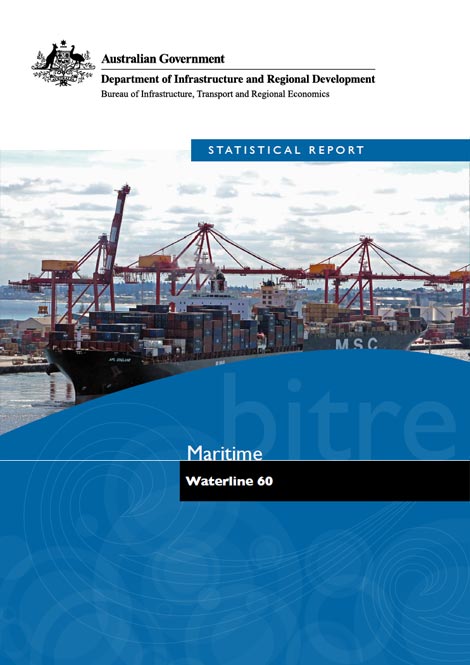
Waterline reports on trends in throughput, container handling productivity on the waterfront and landside of ports in Australia, and the cost of importing and exporting containers via 5 container ports. It covers the loading and unloading of container ships and the transport of containers from container terminals.
This issue covers port terminal activity up to the December quarter 2016. Indicators for Empty Container Parks are reported for the first time.