
Freight Rates in Australia
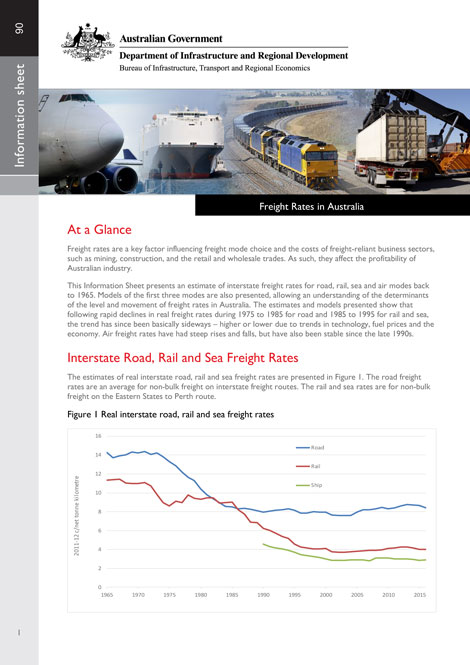
This Information Sheet presents an estimate of interstate freight rates for road, rail, sea and air modes back to 1965. Models of the first three modes are also presented, allowing an understanding of the determinants of the level and movement of freight rates in Australia.
The estimates and models presented show that following rapid declines in real freight rates during 1975 to 1985 for road and 1985 to 1995 for rail and sea, the trend has since been basically sideways–higher or lower due to trends in technology, fuel prices and the economy.
- Freight Rates in Australia
Waterline 59—May 2017
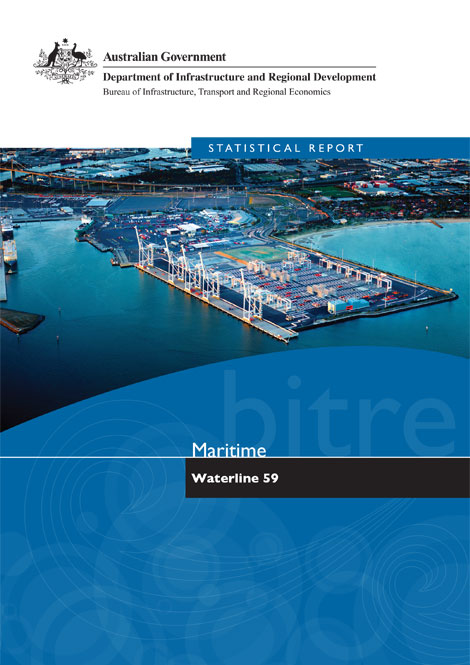
Waterline reports on trends in throughput, container handling productivity on the waterfront and landside of ports in Australia, and the cost of importing and exporting containers via 5 container ports. It covers the loading and unloading of container ships and the transport of containers from container terminals. This issue covers port terminal activity up to the June quarter 2016.
Australian sea freight 2014–15
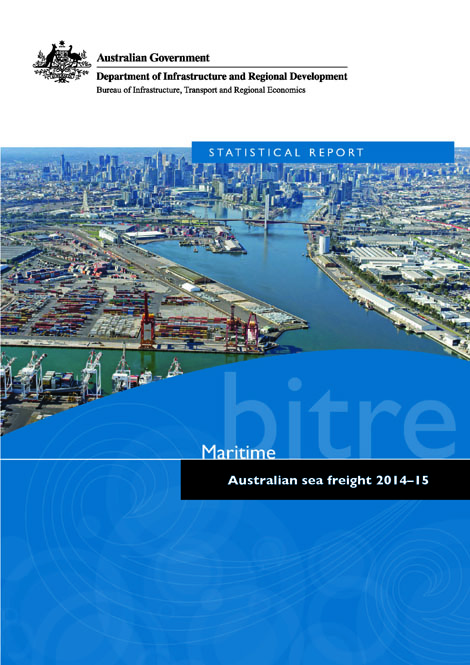
This is the latest in a series of BITRE reports that provide information on Australian sea freight movements, vessel activity, the use of coastal trading licences and the size and composition of the Australian trading fleet. This report contains statistics on maritime freight and shipping activities in Australia from 2005–06 to 2014–15.
Australian Infrastructure Statistics—Yearbook 2016
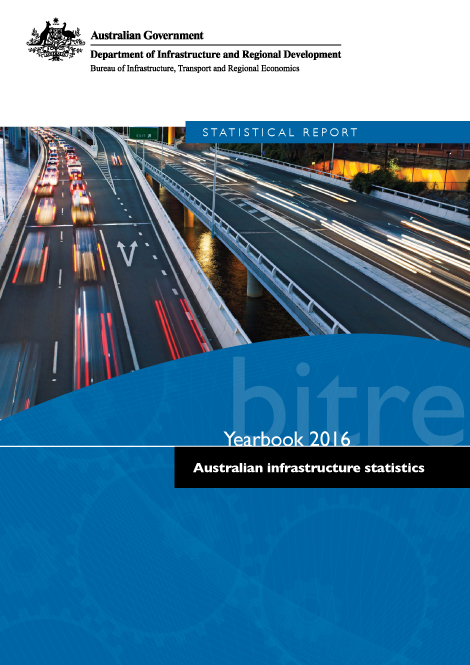
The Australian infrastructure statistics yearbook provides a comprehensive evidence base to examine long-term and emerging trends as well as inform policy development and regulatory reform in the transport, energy, water and communications sectors. It is the only comprehensive source of time series statistics for Australia's major areas of economic infrastructure. The yearbook is accompanied by the Key Australian Infrastructure Statistics Booklet which is a summary of statistics from the yearbook.
- Yearbook 2016–Australian Infrastructure Statistics
- Key Australian Infrastructure Statistics 2016
- Australian Infrastructure Statistics
Yearbook 2016
Part I–Infrastructure and the Economy
- Australian Infrastructure Statistics
Yearbook 2016
Part T–Transport
- Australian Infrastructure Statistics
Yearbook 2016
Part E–Energy
- Australian Infrastructure Statistics
Yearbook 2016
Part C–Communication
- Australian Infrastructure Statistics
Yearbook 2016
Part W–Water
Waterline 58—November 2016
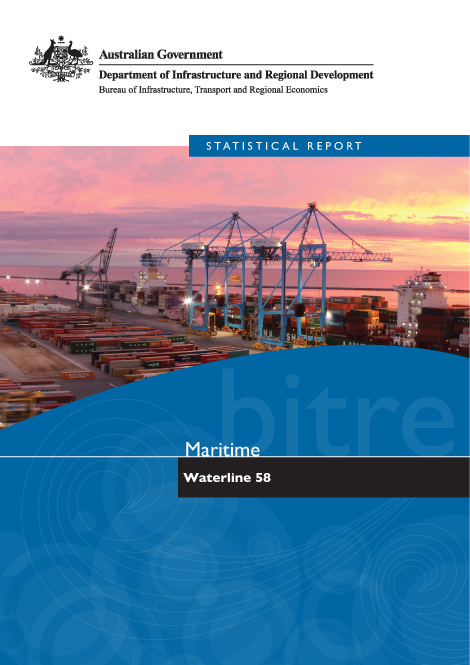
Waterline reports on trends in throughput, container handling productivity and the cost of importing and exporting containers through Australia's 5 major container ports. It covers container exchange with specialised container ships and transport of containers on the landside of the ports.
This issue covers port terminal activity up to the December quarter 2015.
Freightline 4—Australian coal freight transport
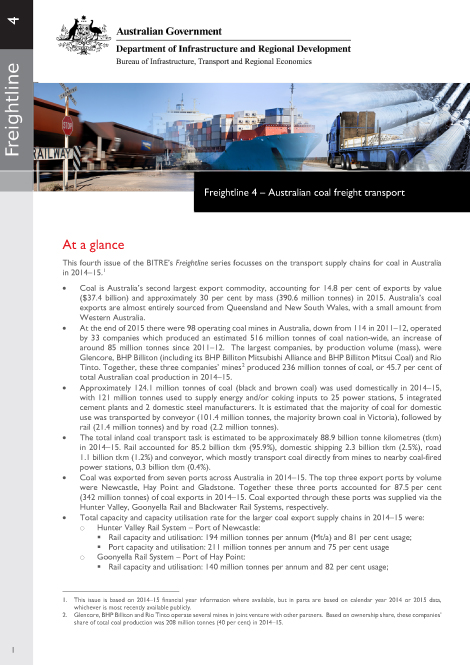
The Freightline series is intended to provide information on interregional freight movements across Australia, filling a major gap in Australian transport-related data and information, to help better inform and support policy development and infrastructure planning. The Freightline series begins with a broad overview of the freight task, followed by separate commodity-specific issues that provide more detailed information about the size and location of major freight movements, supply chain composition and key infrastructure components. Freightline 4 (this issue) focusses on Australian coal transport supply chains and freight movements in 2014–15.
- Freightline 4–Australian coal freight transport
Bass Strait Passenger Vehicle Equalisation Scheme Monitoring Report No. 15
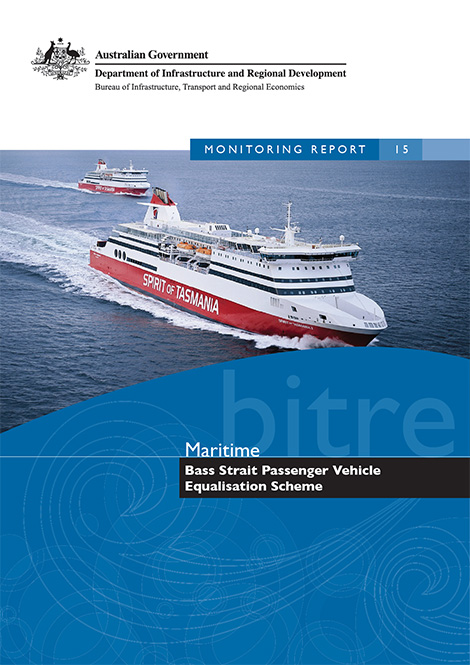
The Ministerial Directions governing the Bass Strait Passenger Vehicle Equalisation Scheme require us to produce a monitoring report every 2 years. Over the monitoring period (2013–14 to 2014–15):
- The Australian Government spent $40.9 million in 2014–15 on the Scheme, up 9.1% from 2013–14, and $37.5 million in 2013–14 (up 14.3% on 2012–13).
- The number of sea passengers with a motor vehicle may have been 23.6% higher than without the Scheme.
- Just under 18 000 new visitors to Tasmania travelled by sea due to the Scheme in 2014–15 (up from 14 500 new visitors in 2013–14).
- New visitors to Tasmania spent an estimated $50.2 million in Tasmania in 2014–15 (up from an estimated $39.0 million in 2013–14).
Freightline 3—Australia sugar freight transport
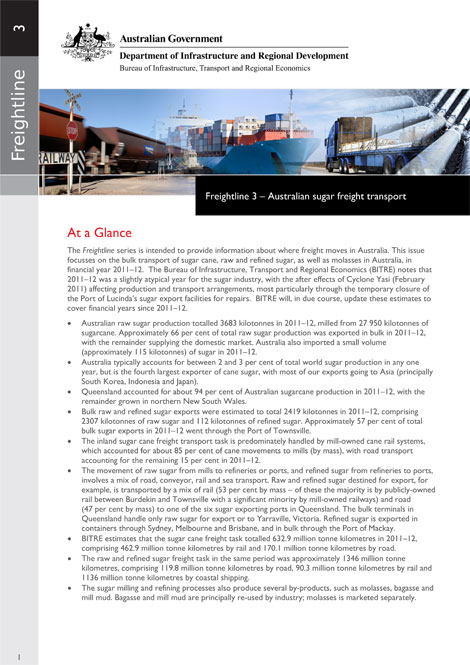
The Freightline series is intended to provide information on interregional freight movements across Australia, filling a major gap in Australian transport-related data and information, to help better inform and support policy development and infrastructure planning. The Freightline series begins with a broad overview of the freight task, followed by separate commodity-specific issues that provide more detailed information about the size and location of major freight movements, supply chain composition and key infrastructure components. Freightline 3 (this issue) focusses on Australian sugar-related transport supply chains and freight movements in 2011–12.
- Freightline 3–Australia sugar freight transport
Australian infrastructure statistics—Yearbook 2015 and key Australian infrastructure statistics booklet 2015
The Yearbook provides a comprehensive evidence base to examine long-term and emerging trends as well as inform policy development and regulatory reform in the transport, energy, water and communications sectors. It is the only comprehensive source of time series statistics for Australia's major areas of economic infrastructure. The Yearbook is accompanied by the key Australian infrastructure statistics booklet which is a summary of statistics from the Yearbook.
- Yearbook 2015–Australian Infrastructure Statistics
- Key Australian Infrastructure Statistics 2015
- Australian Infrastructure Statistics
Yearbook 2015
Part I–Infrastructure and the Economy
- Australian Infrastructure Statistics
Yearbook 2015
Part T–Transport
- Australian Infrastructure Statistics
Yearbook 2015
Part E–Energy
- Australian Infrastructure Statistics
Yearbook 2015
Part C–Communication
- Australian Infrastructure Statistics
Yearbook 2015
Part W–Water
Waterline 57—December 2015
Waterline reports on trends in throughput, container handling productivity and the cost of importing and exporting containers through Australia's 5 major container ports. It covers container exchange with specialised container ships and transport of containers on the landside of the ports.
This issue covers port terminal activity up to the June quarter 2015. It introduces 3 new indicators–2 examine truck movements outside formal booking systems for containers and TEUs; the third quantifies backloaded operations, whereby trucks carry containers on both inbound and outbound legs of their trip.