
Australian sea freight 2013–14
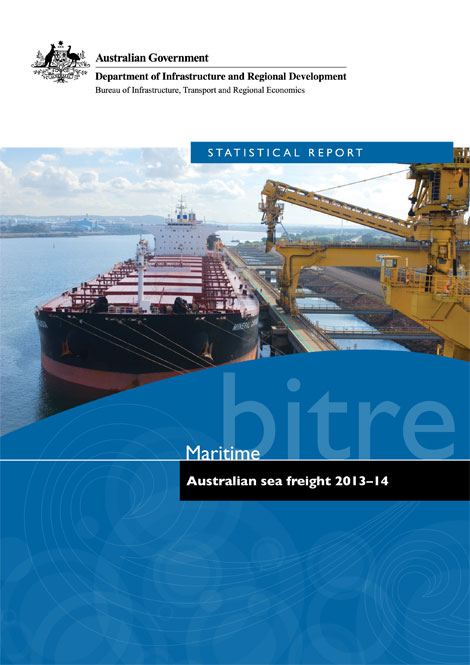
This is the latest in a series of BITRE reports that provide information on Australian sea freight movements, vessel activity, the use of coastal trading licences and the size and composition of the Australian trading fleet. This report contains statistics on maritime freight and shipping activities in Australia from 2004–05 to 2013–14.
Waterline 56—May 2015
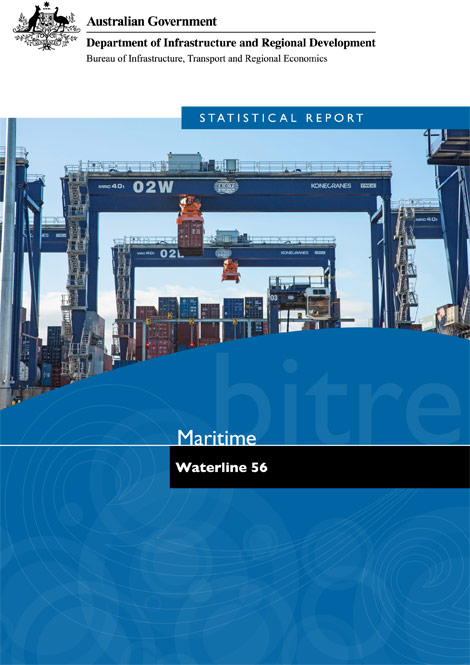
Waterline provides the latest data on throughput, container handling productivity (both wharf-side and landside), and the cost of importing and exporting containers. It covers the unloading of container ships and the transport of containers from terminals. Highlights from this edition include:
- Throughput at Australian ports increased 3% over the period July-December 2014 relative to the previous year, with a total throughput of 3.7 million TEUs. This compares to non-farm GDP growth over the same period of 2.7%: port throughput continues to increase faster than non-farm GDP. Fremantle experienced the strongest increase of 11.3%; the other ports showed more modest growth, except Adelaide, which recorded a 2.6% decline.
- Wharf-side productivity showed a modest improvement in average labour productivity (up 0.9%); however reduced crane rates (down 3.3%) showed lower capital productivity and translated to longer median ship turnaround rates at Brisbane, Sydney and Melbourne. Fremantle exhibited the strongest performance (with elapsed labour rate, crane rate and ship rate improvements of 39.4, 32.8 and 10.9% respectively), with the sharpest declines in Brisbane (elapsed labour rate and ship rate down by 12.3 and 14.5% respectively).
- Land-side efficiency continued its decline in all ports except Adelaide: average truck and container turnaround times increased by 5.7 and 4.7%, respectively.
- The Port Interface Cost Index (PICI) increased by $10-$14/TEU over the reporting period, with the larger increases for smaller vessel sizes. Port Interface Cost for medium- and large-size vessels is now approaching parity. While historically, port handling costs have been declining as the general price level across the economy (the GDP deflator) has been increasing, this trend has reversed since 2010, and port interface costs are now rising.
Waterline 55—January 2015
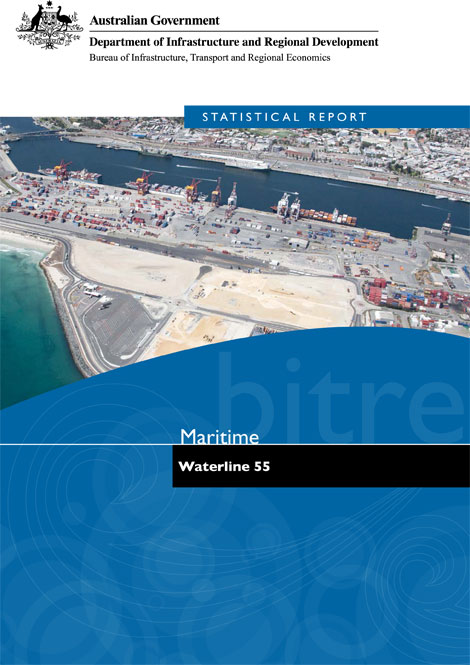
Waterline reports on trends in throughput, container handling productivity on the waterfront and landside of ports in Australia, and the cost of importing and exporting containers via 5 container ports. It covers the loading and unloading of container ships and the transport of containers from container terminals. In Waterline 55, rail throughput data provided by port authorities is incorporated in calculating the throughput and productivity indicators. This issue covers port terminal activity up to the June quarter 2014.
Containerised and non-containerised trade through Australian ports to 2032–33
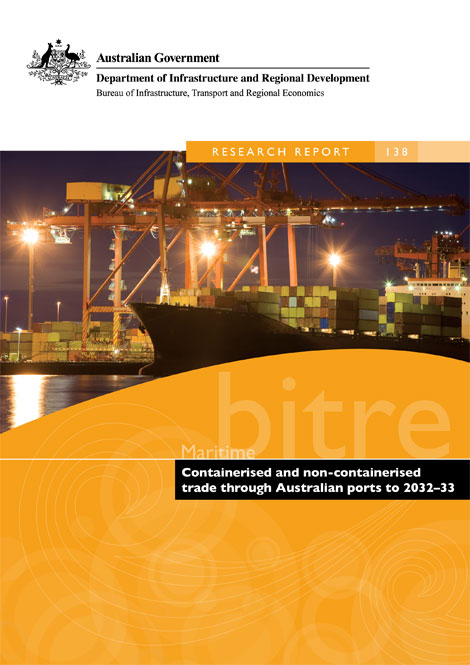
This report presents 20-year forecasts of exports and imports of containerised and non-containerised freight and sea passenger movements through Australia's 5 largest capital city ports and, in aggregation, all other ports. The forecasts, which update those previously published by BITRE in 2002, 2006 and 2010, are driven by population, real income, exchange rates, import prices and export prices. The most recent economic outlook and population growth forecasts for Australia and its major trading partners have been used to derive the forecasts. The forecasts imply that Australia's sea trade will double over the next 20 years, largely due to the continuing positive economic outlook for Australia and its major trading partners. The long-term outlook for the cruise shipping industry is also positive, largely due to the projected economic growth in source countries of cruise passengers, particularly the USA.
Australian infrastructure statistics—Yearbook 2014 and key Australian infrastructure statistics booklet
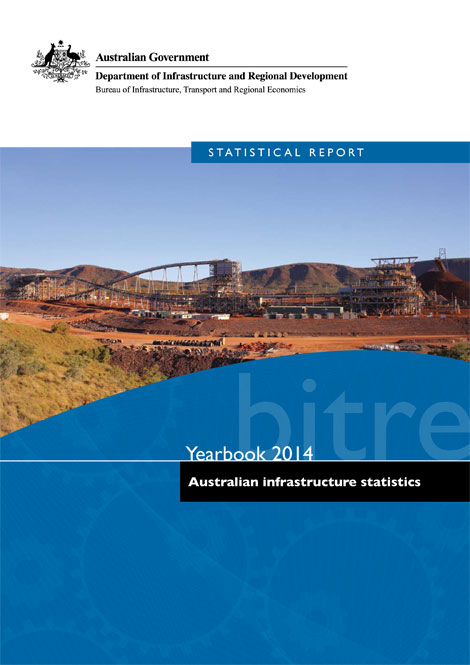
The Yearbook provides a comprehensive evidence base to examine long-term and emerging trends as well as inform policy development and regulatory reform in the transport, energy, water and communications sectors. It is the only comprehensive source of time series statistics for Australia's major areas of economic infrastructure. The Yearbook is accompanied by the Key Australian Infrastructure Statistics booklet which is a summary of statistics from the Yearbook.
- Yearbook 2014–Australian Infrastructure Statistics
- Key Australian Infrastructure Statistics
- Australian Infrastructure Statistics
Yearbook 2014
Part I–Infrastructure and the Economy
- Australian Infrastructure Statistics
Yearbook 2014
Part T–Transport
- Australian Infrastructure Statistics
Yearbook 2014
Part E–Energy
- Australian Infrastructure Statistics
Yearbook 2014
Part C–Communication
- Australian Infrastructure Statistics
Yearbook 2014
Part W–Water
Ports: job generation in the context of regional development
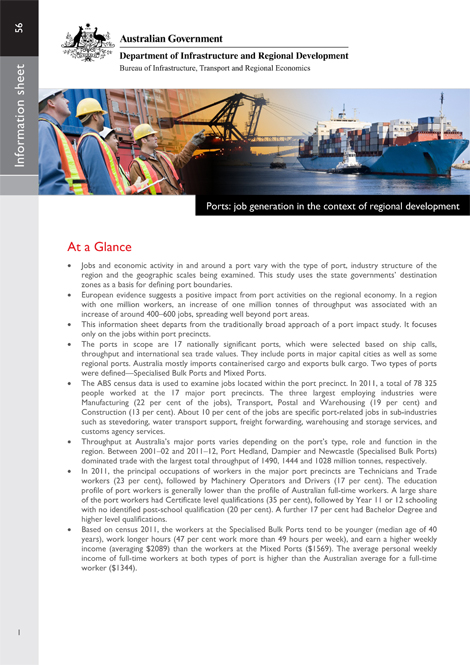
This paper presents recent evidence on jobs at Australian ports, based on ABS Census of Population and Housing data. It examines 17 major ports that are of national economic significance, based on the level of activity as measured by ship visits, throughput and the value of trade. It presents the number of jobs located at port precinct, the industry structure, median age, educational qualifications and skill mix of that employment.
- Ports: job generation in the context of regional development
Australian sea freight 2012-13
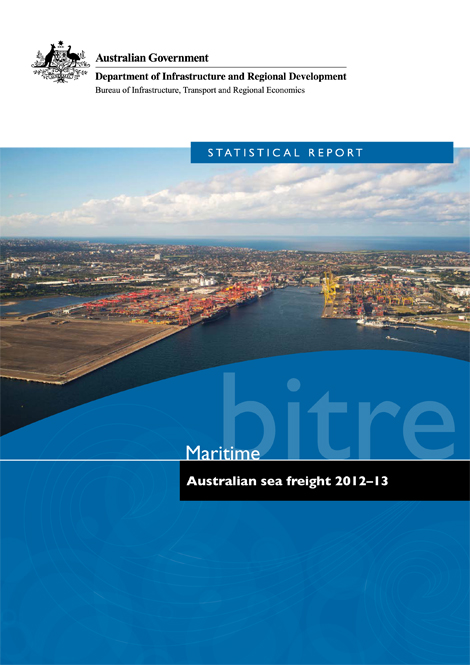
This is the latest in a series of BITRE reports that presents statistics on maritime freight in Australia and shows the trend of Australian sea freight over the most recent 10 years. The information presented comprises international and coastal freight statistics, the use of coastal voyage permits, vessel activity at Australian ports and the size and composition of the Australian trading fleet from 2003-04 to 2012-13.
Waterline 54—August 2014
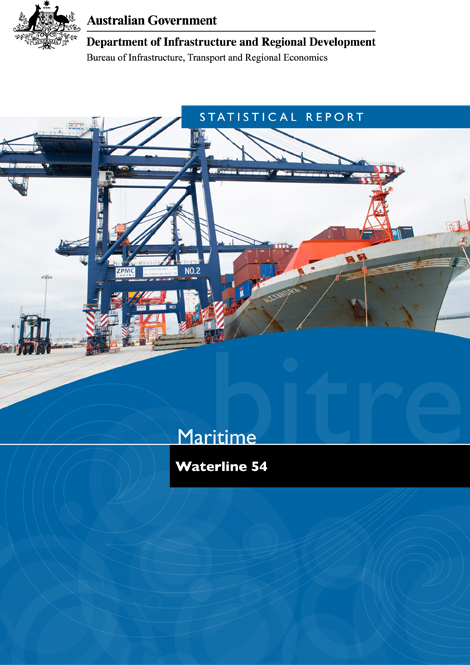
Waterline reports on trends in throughput, container handling productivity on the waterfront and landside of ports in Australia, and the cost of importing and exporting containers. It covers the unloading of container ships and the transport of containers from container terminals. In Waterline 54, rail throughput data provided by port authorities is incorporated in calculating the throughput and productivity indicators. This issue covers port terminal activity up to the December quarter 2013.
Infrastructure, transport and productivity
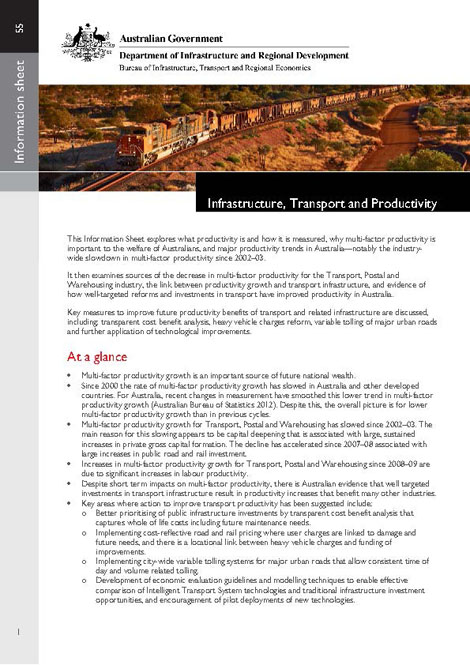
This information sheet reviews trends in Australian productivity with a focus on the transport sector.
Well targeted investments in transport infrastructure result in productivity increases that benefit many other industries. The paper provides for specific examples that cover trucks, freight, waterfront and rail productivity enhancements.
- Infrastructure, transport and productivity
Freightline 1—Australia freight transport overview
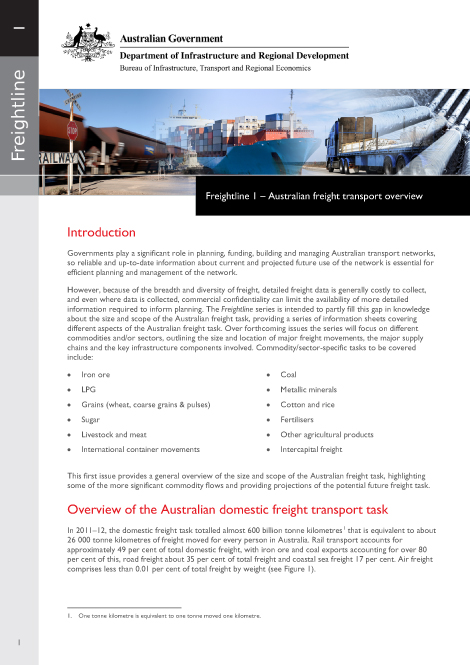
The Freightline series is intended to provide information on interregional freight movements across Australia, filling a major gap in Australian transport-related data and information, to help better inform and support policy development and infrastructure planning. The Freightline series begins with a broad overview of the freight task, followed by separate commodity-specific issues that provide more detailed information about the size and location of major freight movements, supply chain composition and key infrastructure components. Freightline 1 (this issue) provides a broad overview of freight movements in Australia, highlighting some of the major commodity flows.
- Freightline 1–Australia freight transport overview