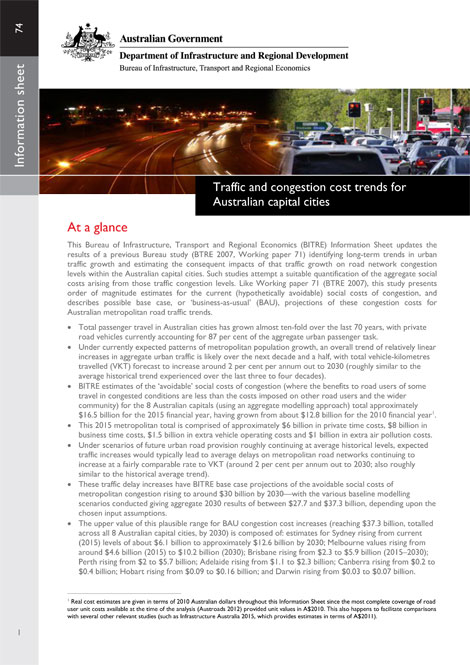
Traffic and congestion cost trends for Australian capital cities
The avoidable cost of congestion for the Australian capital cities is estimated to be around $16.5 billion for the 2015 financial year, having grown from about $12.8 billion for 2010. BITRE 'business-as-usual' projections of these costs of metropolitan congestion rise to around $30 billion by 2030–with the various modelling scenarios conducted giving aggregate 2030 results of between $27.7 and $37.3 billion, depending upon the chosen assumptions.
- Traffic and congestion cost trends for Australian capital cities
- VKT and Summary Cost Data
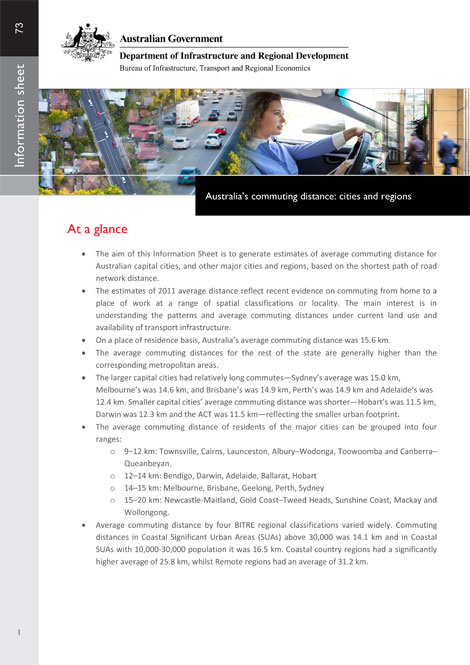
Australia's commuting distance: cities and regions
The 2011 average commuting distances reflect recent evidence on commuting from home to a place of work at a range of spatial classifications or localities. The main interest is in understanding the patterns and average commuting distances under current land use and availability of transport infrastructure.
- Australia's commuting distance: cities and regions
Changes in Australia's industry structure: cities and regions, 2006–2011
This Information Sheet identifies recent trends (2006 to 2011) in employment by various industries for regional areas, capital cities and non-capital cities. It updates BITRE's previous Information Sheet 32, which focused on employment changes between 2001 and 2006. The information presented in this publication will assist regional communities (including local government and RDAs) to understand how their regions are changing, and help regions map out where their opportunities and challenges might lie.
- Changes in Australia's industry structure: cities and regions, 2006–2011
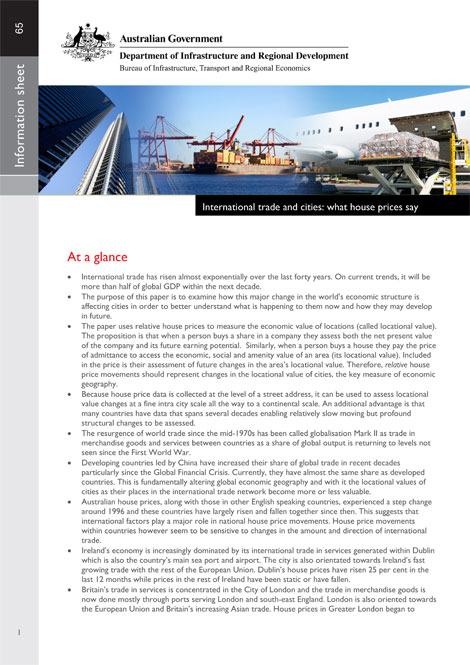
International trade and cities: what house prices say
The relationship between changes in the value and direction of trade and house prices are examined for Ireland, Britain, Canada, the United States and New Zealand. It finds a strong relationship between trade patterns and locational value. Australia is examined at a continental scale. As Australias trade is steadily more focused on Asia, the values of those cities located in the north and west have risen faster than the rest.
- International trade and cities: what house prices say
International trade and Australian cities: what house prices say
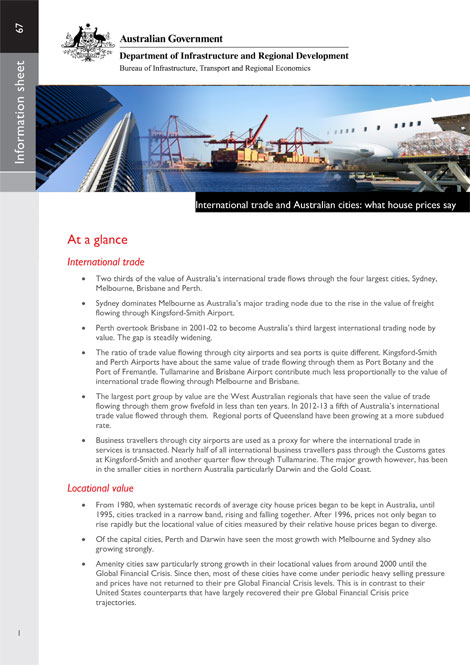
Information Sheet 67 opens with a brief discussion on recent insights into Australian international trade, particularly ways to better measure its real value. It then looks at the changes in the value of international trade flowing through individual sea and airports. Changes in locational value from 1992–2014 are then presented for each city. The relationship between trade patterns and locational values are then tested mathematically.
- International trade and Australian cities: what house prices say
The evolution of Australian towns
This is a historical, economic analysis of change in Australian settlement patterns over a century. Towns have been subject to significant economic, social and technological changes since 1911. This report examines how Australia's town settlement patterns reacted to that change and examines the underlying factors and processes involved. It examines the interacting effects of geography, history, goods and services markets, industry, amenity and investment. The analysis reveals the important roles of competition, existing infrastructure, improved technology, longer life expectancy and increased wealth. It concludes that a stronger focus on amenity and services are likely potential success factors for modern towns.
- The evolution of Australian towns–full report
- Preliminaries
- Executive Summary
- Chapter 1
- Chapter 2
- Chapter 3
- Chapter 4
- Chapter 5
- Chapter 6
- Chapter 7
- Chapter 8
- Chapter 9
- Chapter 10
- Chapter 11
- Chapter 12
- Appendix A
- Appendix B
- Appendix C
- Appendix D
- Appendix E
- Abbreviations and references
Population growth, jobs growth and commuting flows—a comparison of Australia's four largest cities
This is the first comparative study of spatial changes in population, jobs and commuting patterns within Australia's largest cities. It focuses on recent patterns of change in Sydney, Melbourne, Brisbane and Perth, while also presenting an overview of change in other capital cities and regional cities between 2001 and 2011. The report identifies some common trends and differences across the cities, and investigates the extent to which these recent spatial changes match up to the stated strategic planning goals for the four largest cities.
- Population growth, jobs growth and commuting flows–a comparison of Australia's four largest cities
Population growth, jobs growth and commuting flows in South East Queensland
The South East Queensland report discusses changes in the geography of population and employment and the impacts on commuting, with a view to providing a solid evidence base about the trends that have been shaping the region in recent years. The analysis focuses on changes between 2001 and 2011 (wherever data is available). Further, it explores changes at a range of geographical scales to convey an understanding of the overarching patterns as well as some of the finer details. It also investigates the trends in relation to the relevant strategic planning goals.
- Population growth, jobs growth and commuting flows in South East Queensland
Air transport service trends in regional Australia (2013 update)
This information sheet provides a summary of key trends in regional aviation Australia from 1984 to 2012. It is a brief update to Report 130 on Air transport services in regional Australia (2011 update).
- Air transport service trends in regional Australia (2013 update)
Public transport use in Australia's capital cities, Modelling and forecasting
This report allows understanding on forecasting of city passenger travel by motor vehicles and urban public transport. It will aid planning and policy development regarding urban public transport and motor vehicle traffic in cities.
- Public transport use in Australia's capital cities, Modelling and forecasting