Infrastructure and the Economy
Chapter 1

This chapter provides data on the Australian economy including the value added by Australian infrastructure industries in addition to:
- employment in the transport, energy, communication and water industries
- average weekly earnings for road, rail, water and air and space industries
- price indices
- population
- 9.2 per cent of Australia’s GDP was accounted for by Australia’s major infrastructure industries in 2022-23.
- 1 million people were employed in Australia’s major infrastructure industries in August 2023.
- $1,441 is the average weekly earnings for the road transport industry in 2021.
- 84 per cent of people employed by the road transport industry identify as male.
The gross value added of major infrastructure industries as a percentage of GDP has remained relatively stable since 1974-75, generally ranging between 9-10% of GDP, with the transport postal and warehousing industry specifically ranging between 4-5% over the same timeframe. In terms of employment, although employment in the transport, postal and warehousing industry have grown in overall terms, as a percentage of total Australian employment, it has stayed at around 5% for the last 30 years.
Figure 1 Australian employment numbers in selected major infrastructure industries
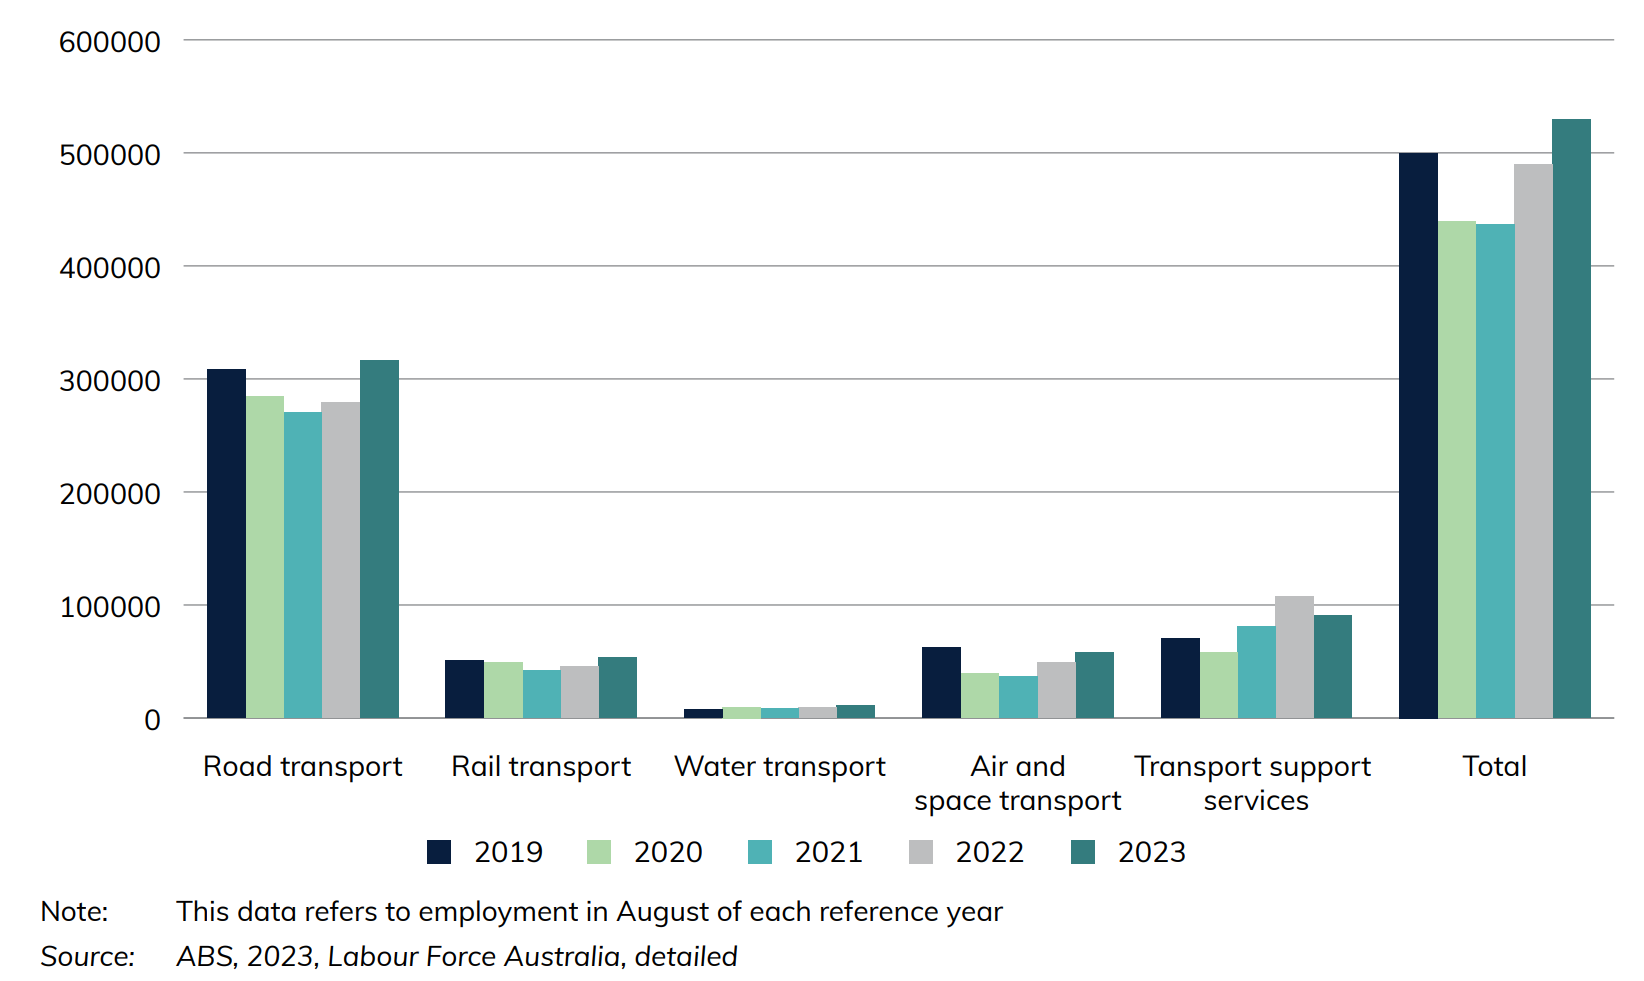
Figure 1 shows employment statistics for various transport industries as at August of each year. Although in 2021 COVID-19 had reduced Australian employment numbers in road, rail, and air and space transport industries, this year has shown signs of recovery, closing in on 2019 pre-pandemic levels.
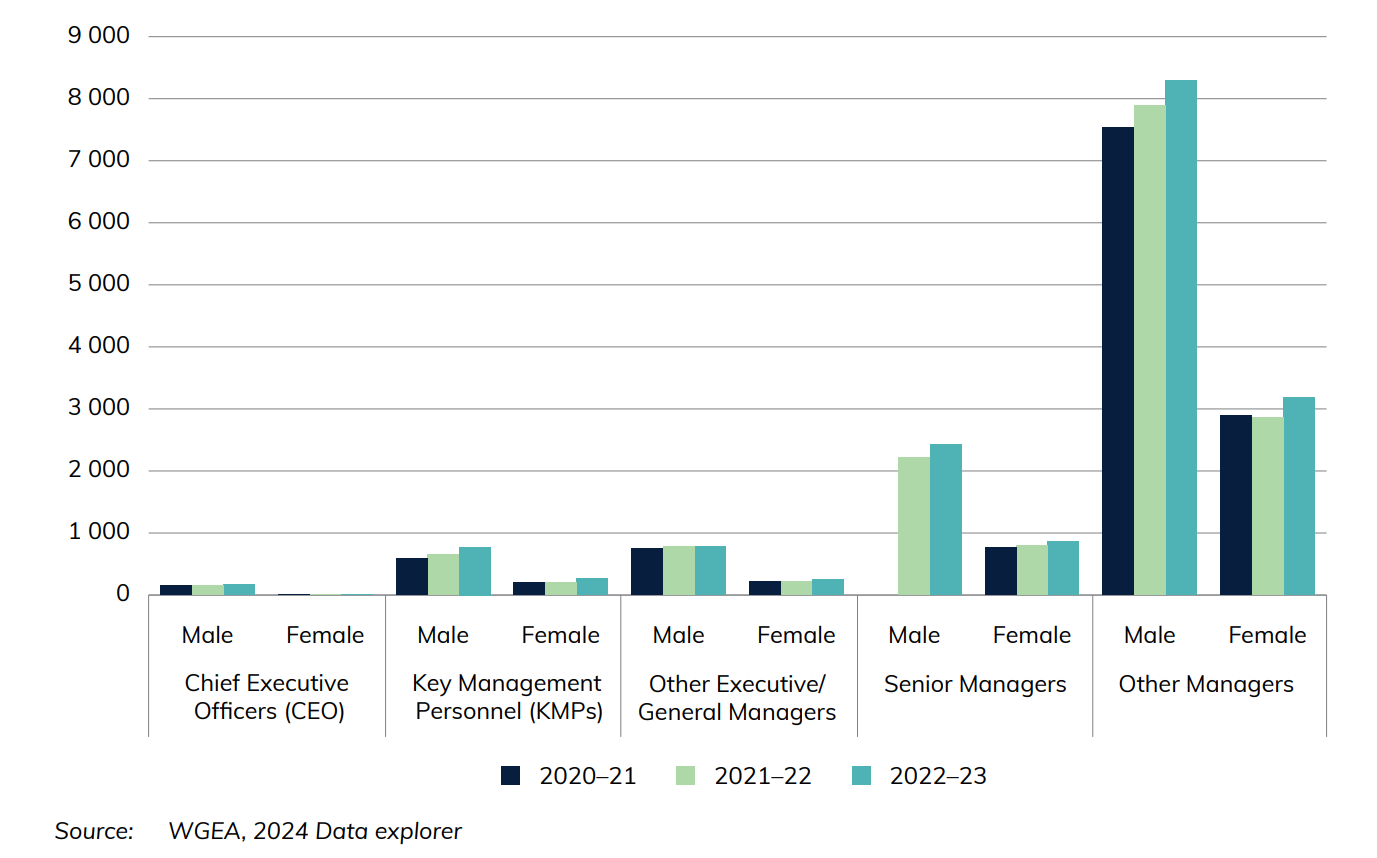
Figure 2 Leadership positions held in transport industries, by gender
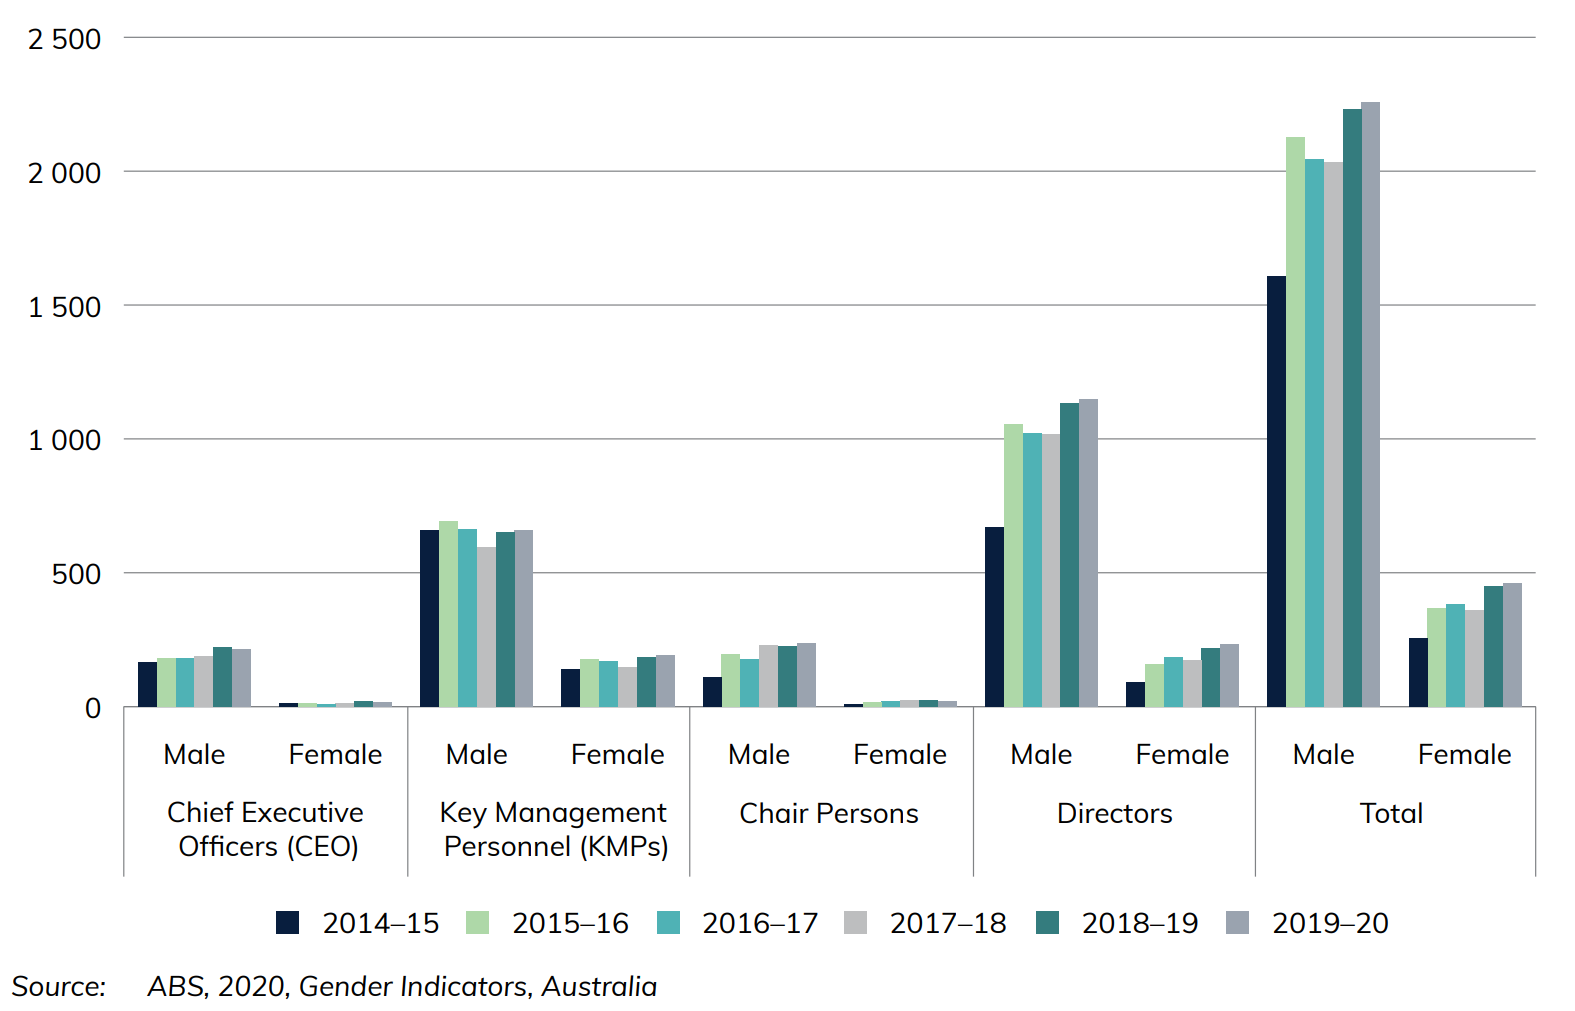
Figure 2 provides an insight into gender statistics by comparing the number of leadership positions held by men and women within the transport industry. In 2019, leadership positions in the transport industry were predominantly occupied by males, with 2258 males in Chief Executive Officer, Key Management Personnel, Chair Person and Director roles compared to 460 females.
Download data
Also see
Infrastructure Construction
Chapter 2
This chapter provides information on Australian measures of infrastructure engineering construction. These are classified as: transport (roads, rail, ports, etc), energy (electricity and gas transmission networks, etc), telecommunications networks, and water supply and distribution networks. Data is sourced from the Australian Bureau of Statistics Engineering Construction Activity, Australia publication with some adjustments, as well as the Electric Vehicle Council.
- 559 DC fast and Ultrafast public charging sites were available for Australians to charge their electric vehicles in 2023.
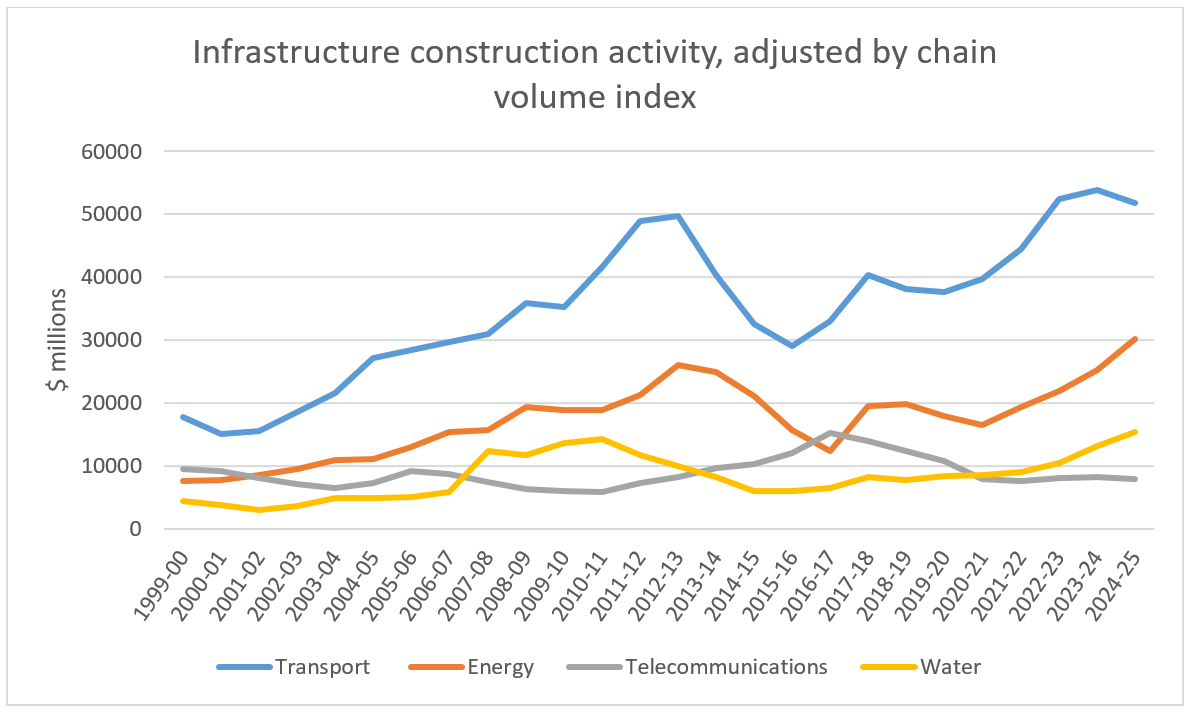
- Transport infrastructure engineering construction work done recorded a new all-time high of $48 billion (adjusted by chain volume index) in 2022-23. This accounted for 56 per cent of all infrastructure engineering construction work done in Australia.
Figure 1 Infrastructure construction activity adjusted by chain volume index
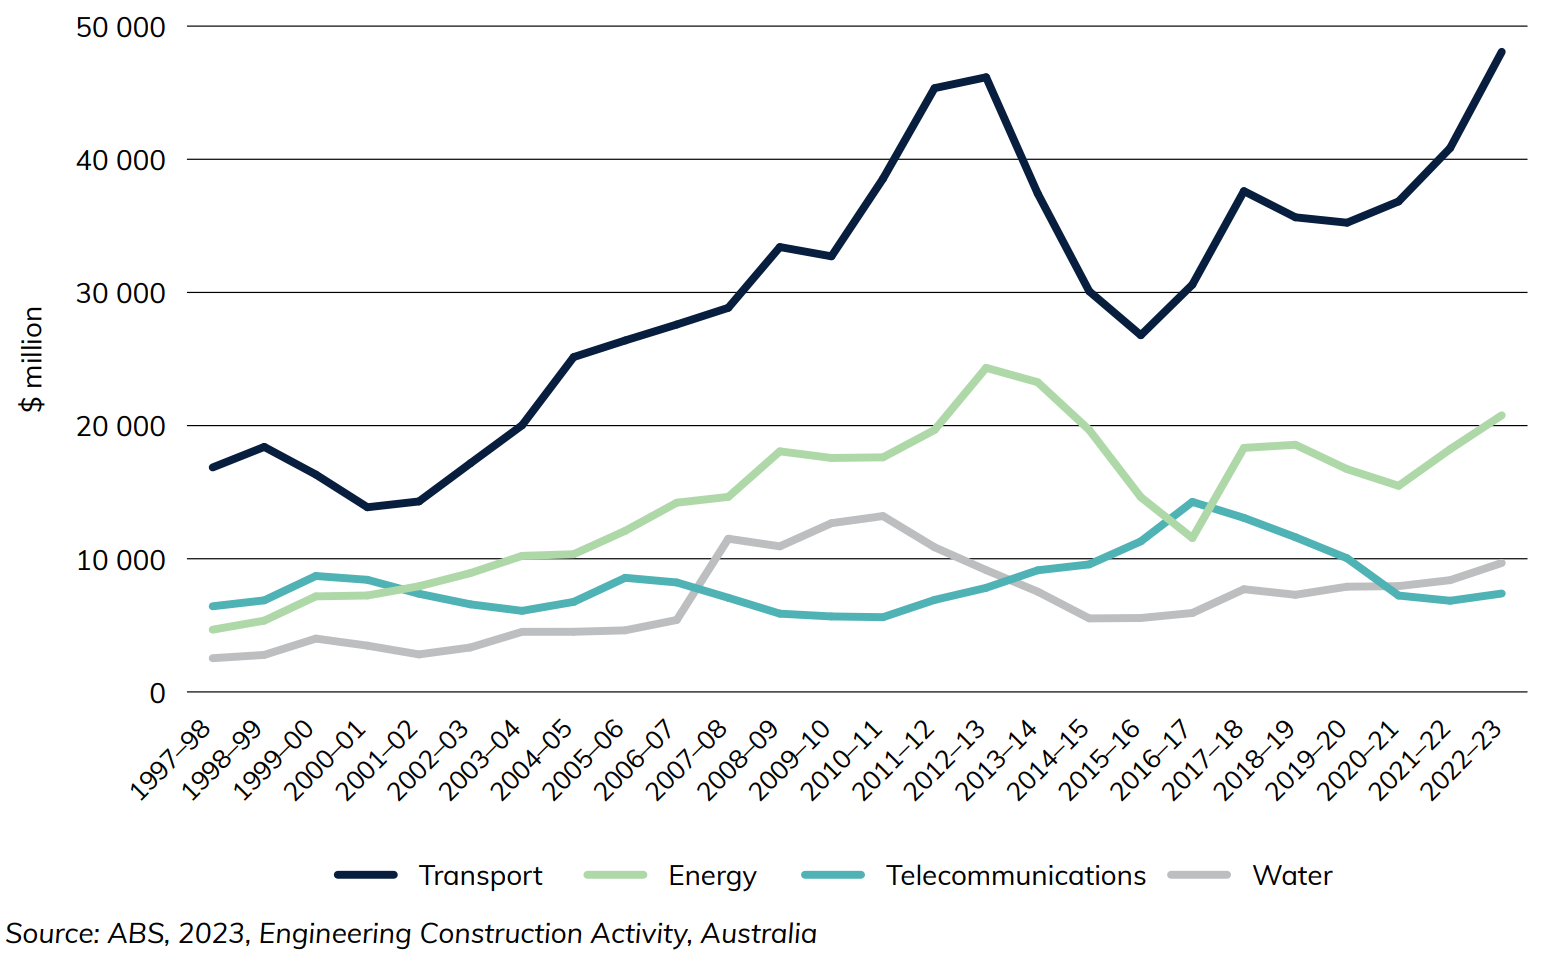
Figure 1 and Figure 2 show the change in infrastructure investment activity in Australia over time. Transport, water and energy investment increased relatively consistently until roughly 2012-13, when they each experienced a notable fall. They have recovered in recent years, however, with the Transport sector reaching its new highest point of roughly $48 billion in 2022-23 (Figure 1).
Figure 2 Infrastructure construction activity, by sector, adjusted by chain volume index
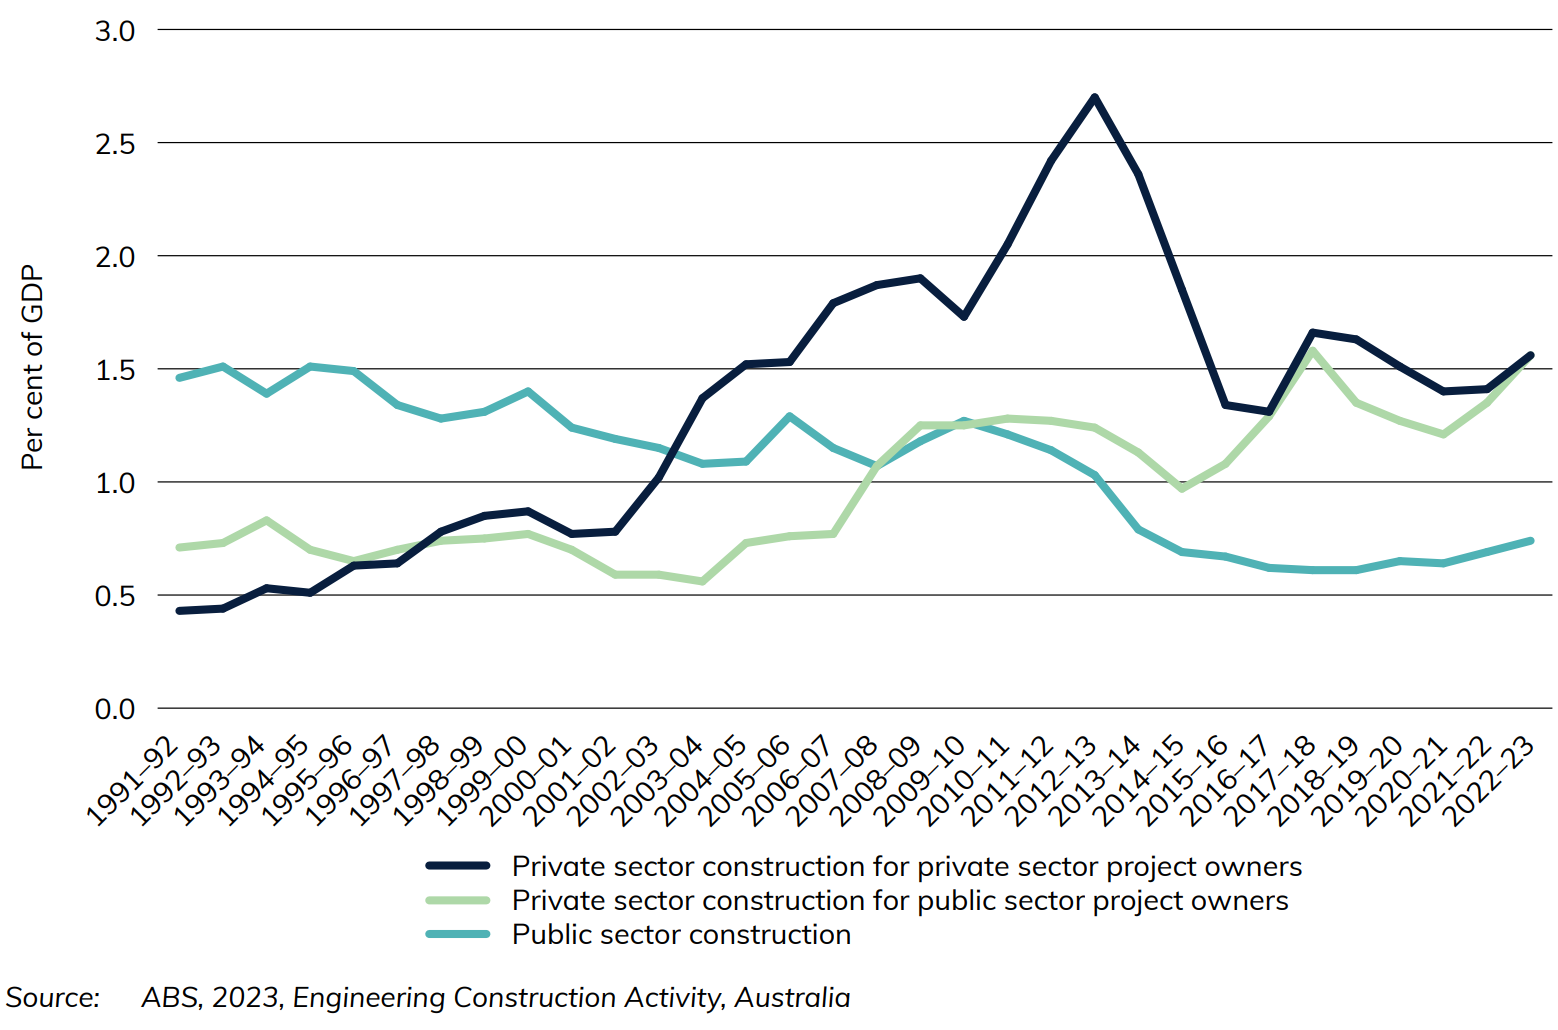
Figure 2 illustrates the private and public sector changes in Australian infrastructure expenditure as a percentage of national GDP. Both public and private sector construction activities are derived from the activity by major forms of infrastructure: transport, energy, telecommunications and water supply.
Figure 3 Value of transport infrastructure spending, adjusted by chain volume index
Download data
Also see
Infrastructure and the Economy
Chapter 1
This chapter provides data on the Australian economy including the value added by Australian infrastructure industries in addition to:
- employment in the transport and storage industry
- average weekly earnings for road, rail, water and air and space industries
- price indices
- 4.6 per cent of Australia's GDP was accounted for by Australia's transport, postal and warehousing industry in 2023-24.
- 297 thousand people were employed in the road transport industry compared to 46 thousand in the rail industry.
- $1 639 is the average weekly earnings for the road transport industry in 2023
- 83 per cent of people employed within the road transport industry identify as male.
The gross value added of transport, postal and warehousing as a percentage of GDP has remained relatively stable since 1974-75, generally ranging between 4-5% of GDP. In terms of employment, although employment in the transport, postal and warehousing industry has grown in overall terms, as a percentage of total Australian employment, it has stayed at around 5% for the last 30 years. Figure 1 shows employment statistics for various transport industries as at August of each year.
Figure 1 Australian employment numbers in selected major infrastructure industries
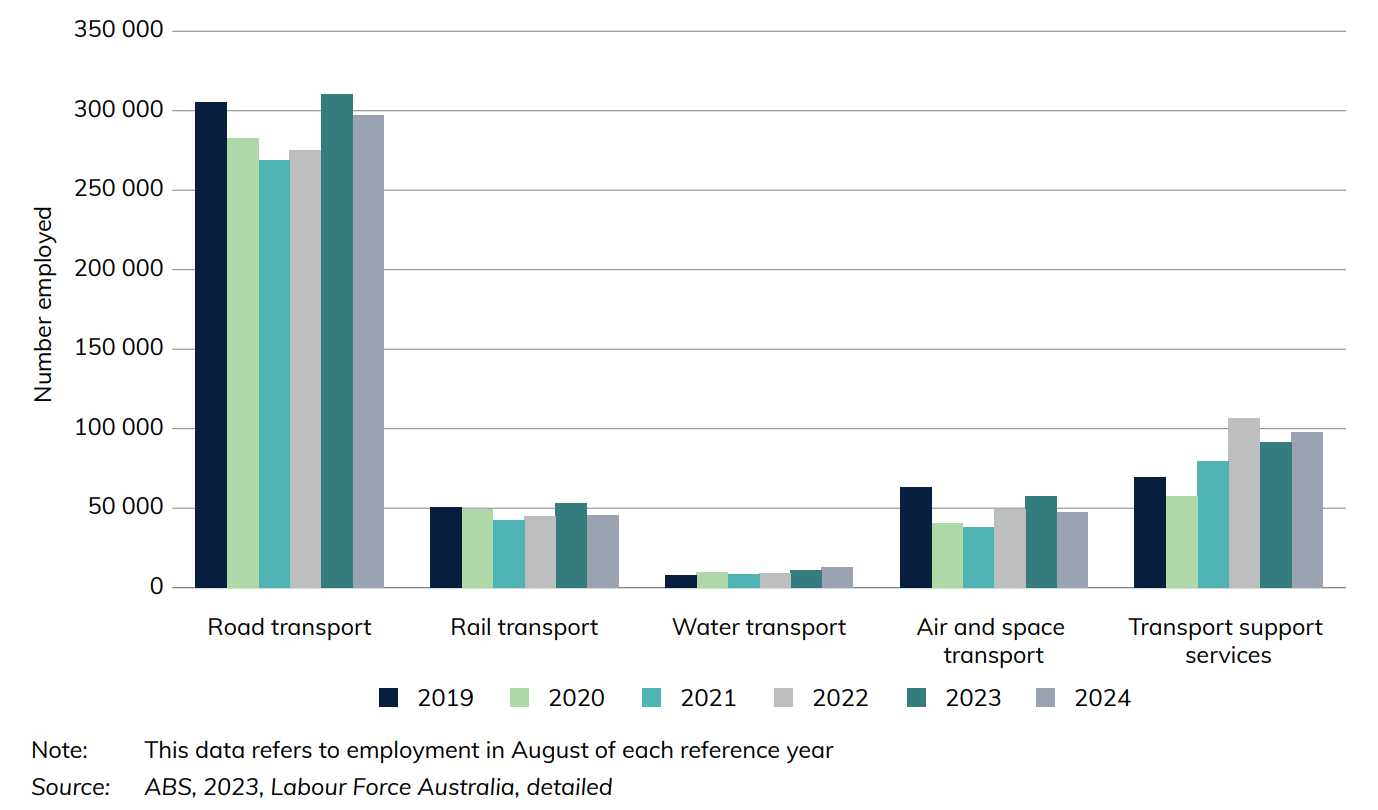
Figure 2 compares the number of leadership positions held by men and women within the transport industry for non-public sector organisations over 100 employees. In 2022-23, leadership positions in the transport industry were predominantly occupied by males, with 12,453 males in Chief Executive Officer, Key Management Personnel/Heads of Business and other managerial positions compared to 4,584 females.
Figure 2 Leadership positions held in transport industries, by gender
Download data
- Infrastructure and the Economy—Yearbook 2024 (140 KB) - Download Excel file
- Australian Infrastructure and Transport Statistics Yearbook 2024 - Download PDF
Also see
Infrastructure Construction
Chapter 2
This chapter provides information on Australian measures of infrastructure engineering construction. These are classified as: transport (roads, rail, harbours, etc), energy (electricity and gas transmission networks, etcetera), telecommunications networks, and water supply and distribution networks. Data is sourced from the Australian Bureau of Statistics, Engineering Construction Activity, Australia publication.
- Transport infrastructure engineering construction work done recorded a new all-time high of $51 billion (adjusted by chain volume index) in 2023–24. This accounted for 53 per cent of the value of infrastructure construction work done in Australia (including transport, energy, telecommunications and water).
- In 2023–24, the value of road engineering construction work done was:
- $33 billion on roads and bridges
- $16 billion on railways
- $1.5 billion on harbours.
Figure 3 and Figure 4 show the change in infrastructure investment activity in Australia over time. Transport, water and energy investment increased relatively consistently until roughly 2012–13, when they each experienced a notable fall. They have recovered in recent years, however, with the Transport sector reaching its new highest point of roughly $51 billion in 2023–24 (Figure 3).
Figure 3 Infrastructure construction activity, adjusted by chain volume index
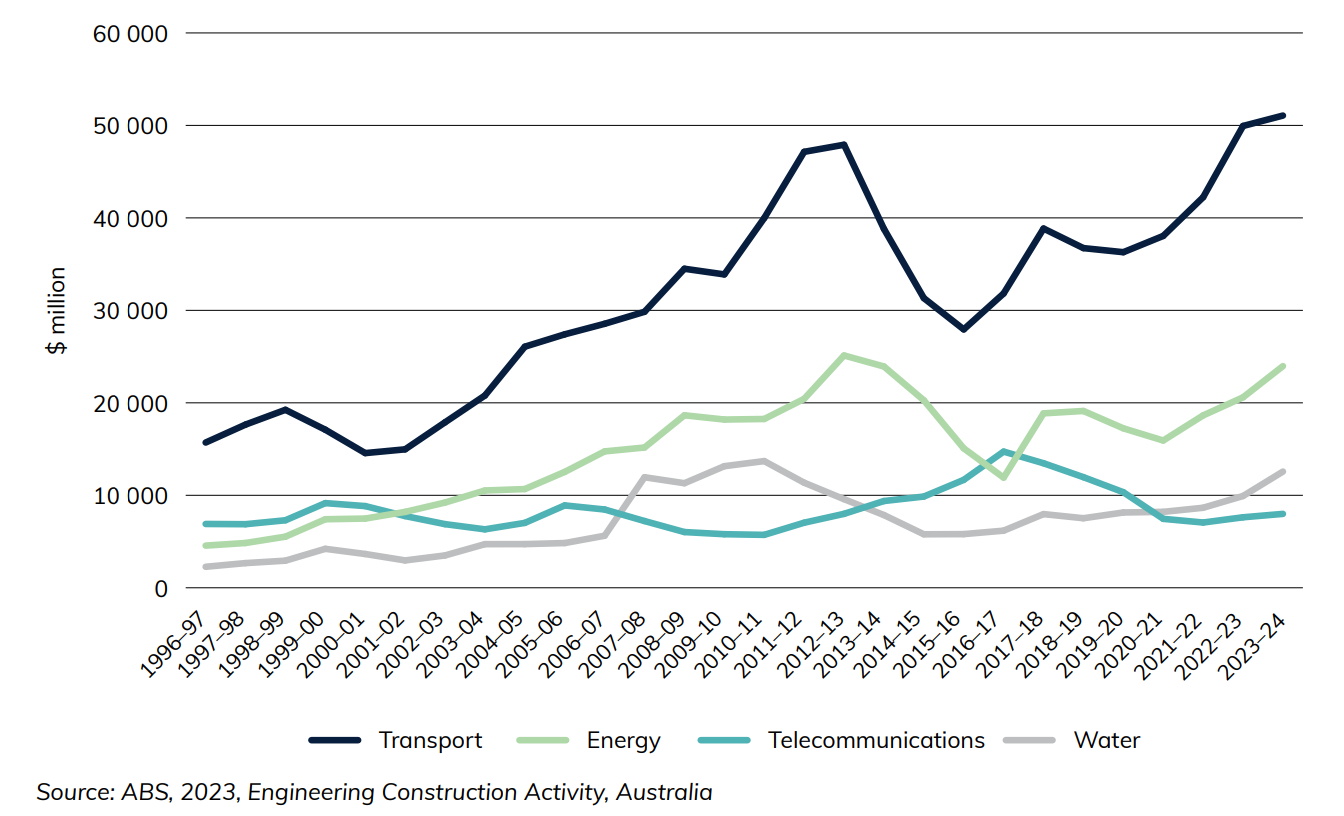
Figure 4 shows the value of engineering Construction activity on different modes of transport. Both road (including bridges) ($33 billion) and railways ($16 billion) have recorded record highs two years in a row.
Figure 4 Infrastructure construction activity, by sector, adjusted by chain volume index
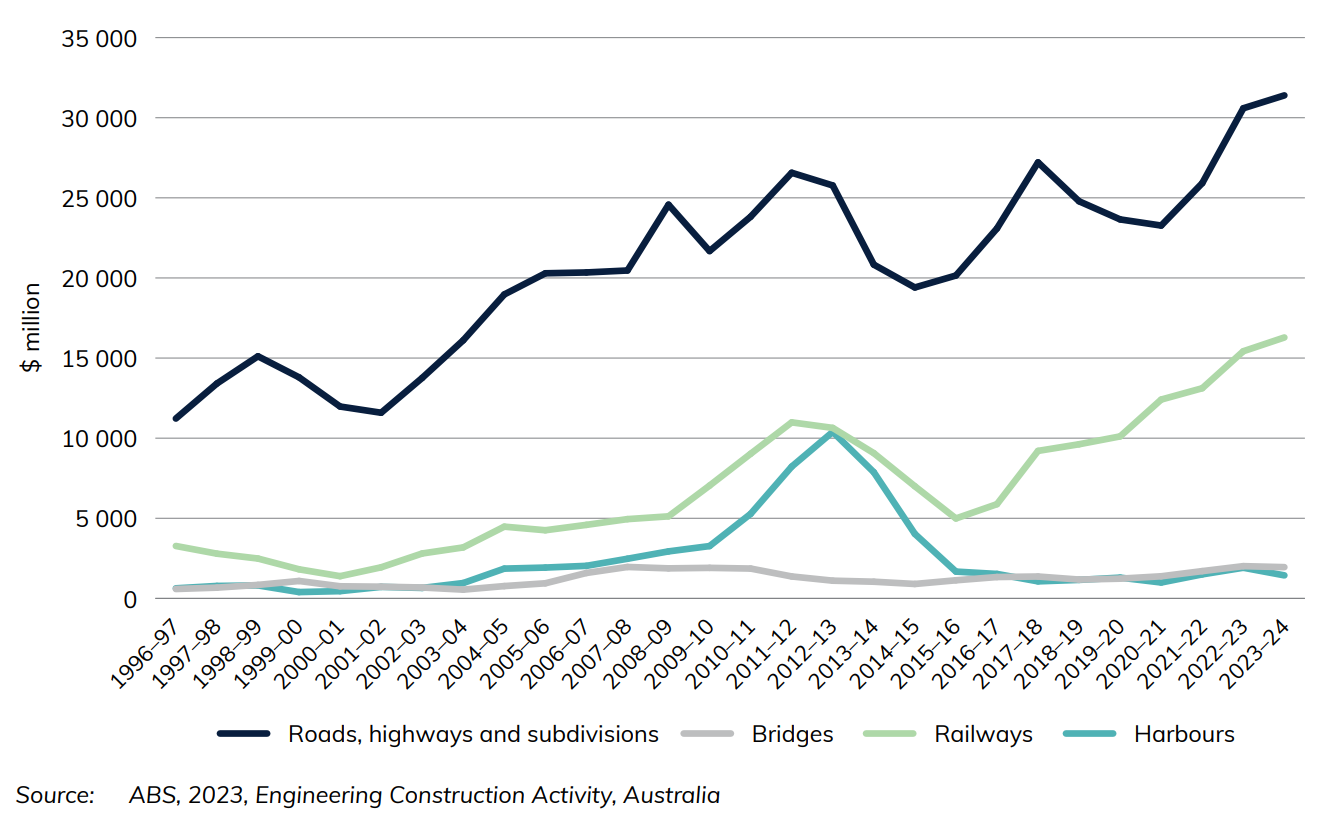
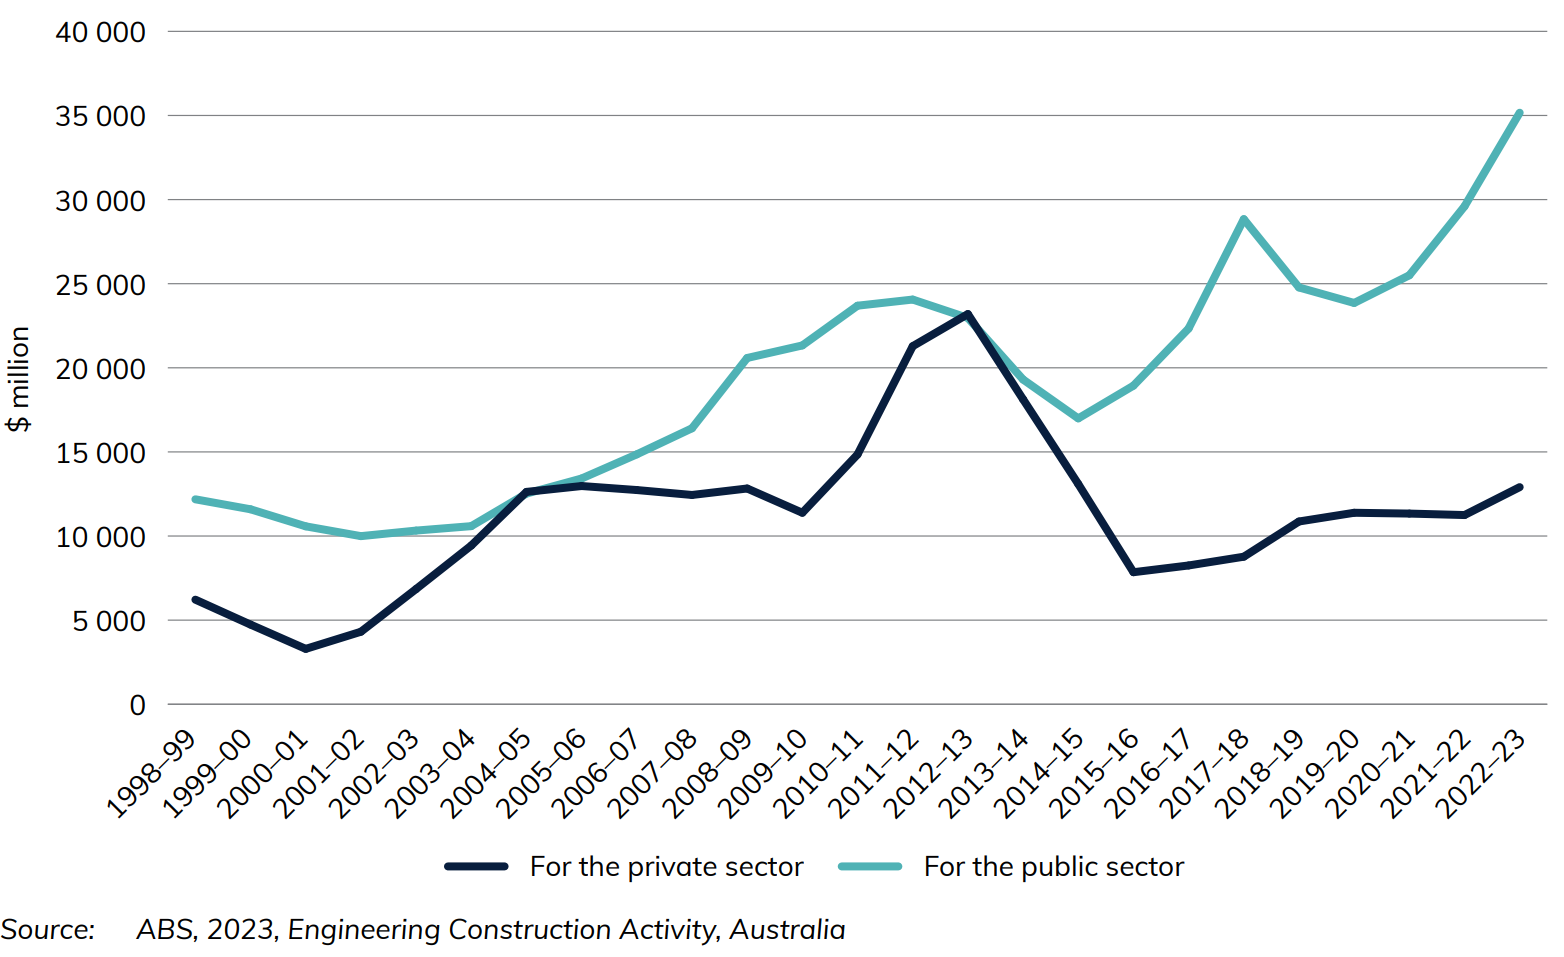
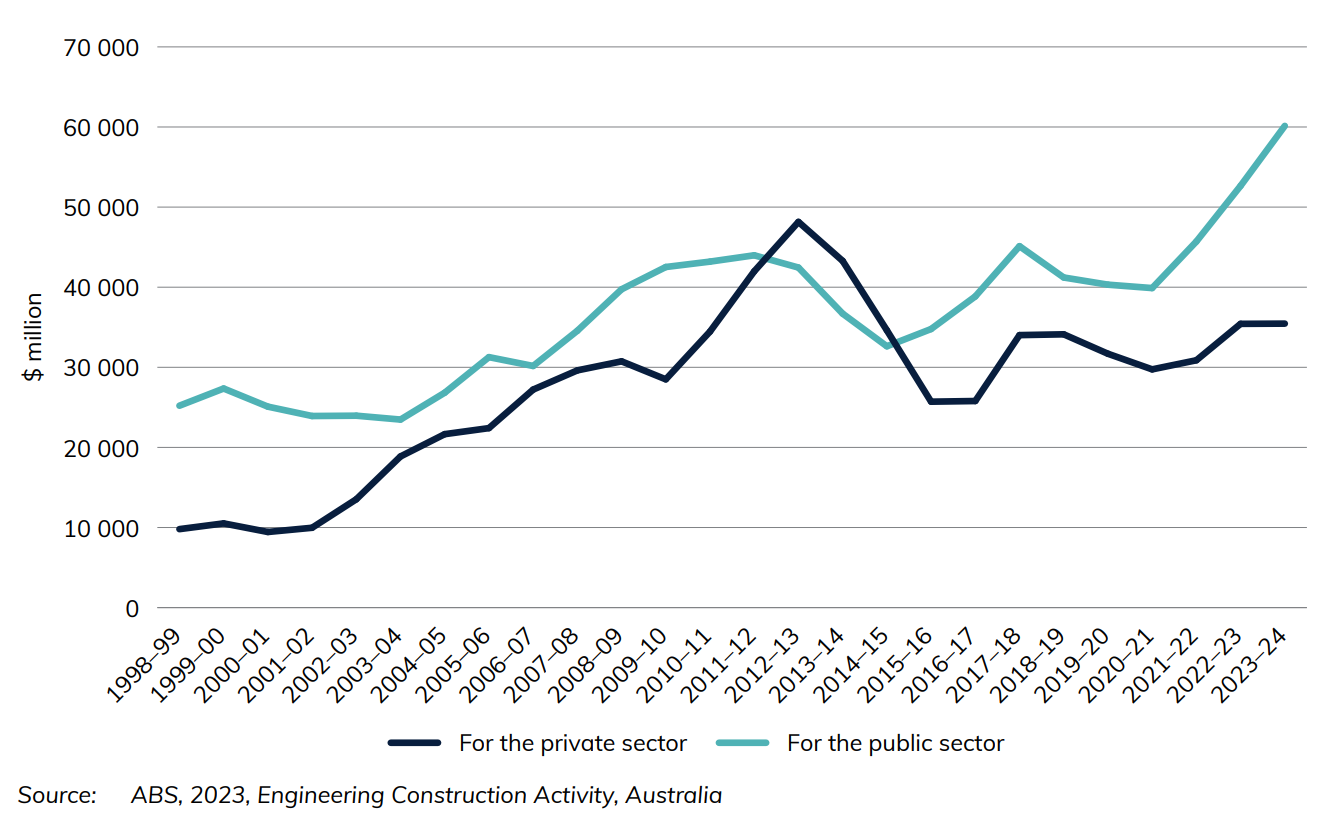
Figure 5 illustrates the private and public sector changes in Australian infrastructure expenditure.
Figure 5 Infrastructure construction activity, by sector, adjusted by chain volume index
Download data
- Infrastructure Construction—Yearbook 2024 (109 KB) - Download Excel file
- Australian Infrastructure and Transport Statistics—Yearbook 2024 - Download PDF
Also see
Infrastructure Construction
Chapter 11
This chapter provides information on Australian measures of infrastructure engineering construction work done for public and private sectors. These are classified as: transport (roads, rail, harbours, etc), energy (electricity and gas transmission networks, etc), telecommunications networks, and water supply and distribution networks. Data is sourced from the Australian Bureau of Statistics, Engineering Construction Activity, Australia publication.
- Transport infrastructure engineering construction work was $52 billion (adjusted by chain volume index) in 2024-25. This accounted for 49 per cent of the value of infrastructure construction work done in Australia (including transport, energy, telecommunications and water).
- In 2024-25, the value of transport engineering construction work done was:
- $34 billion on roads and bridges
- $16 billion on railways
- $1.9 billion on harbours.
Figure 20 and Figure 21 show the change in infrastructure investment activity in Australia over time. Transport, water and energy investment increased relatively consistently until roughly 2012-13, when they each experienced a notable fall. They have recovered in recent years, however, with the Transport sector reaching its highest point of $54 billion in 2023-24 (Figure 20).
Figure 20 Infrastructure construction activity, adjusted by chain volume index
Source: ABS (2025), Engineering Construction Activity, Australia
Figure 21 shows the value of engineering Construction activity on different modes of transport. In 2024-25, both road and rail values dropped slightly after record highs in 2023-24 (at $33 billion for road and $17 billion for rail).
Figure 21 Transport construction activity, adjusted by chain volume index
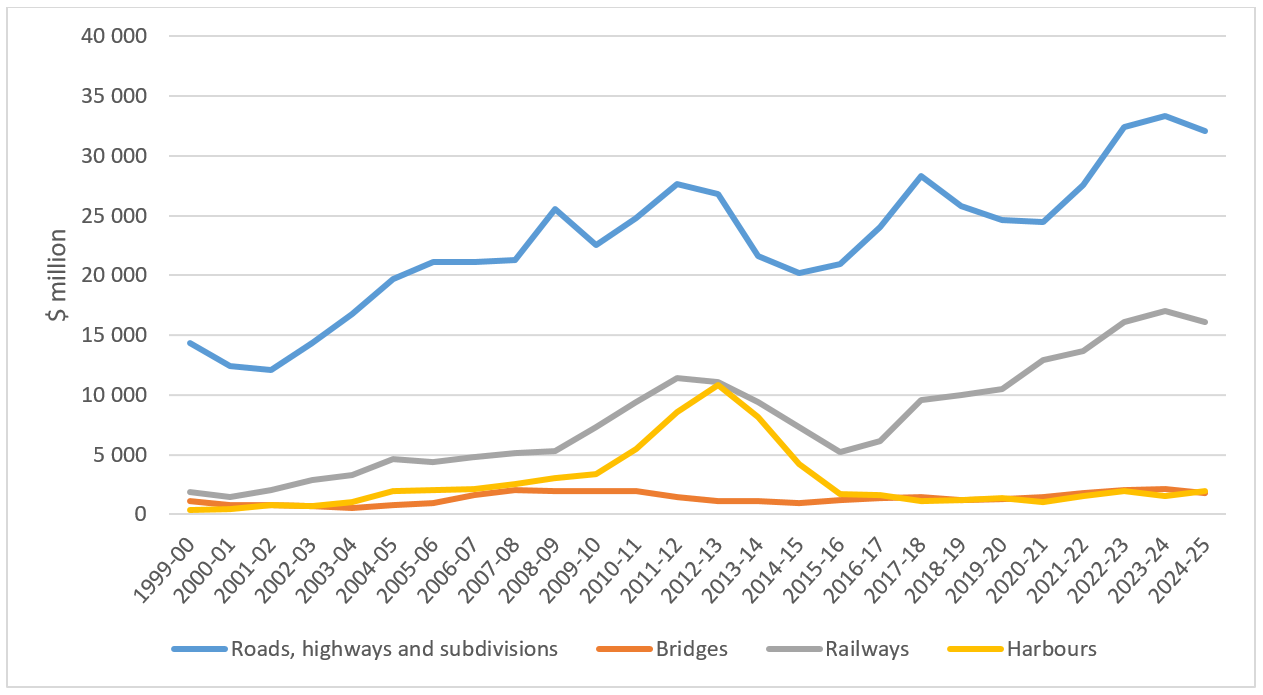
Source: ABS (2025), Engineering Construction Activity, Australia
Figure 22 illustrates the private and public sector changes in Australian infrastructure expenditure.
Figure 22 Value of infrastructure engineering construction work done, by sector, adjusted by chain volume index
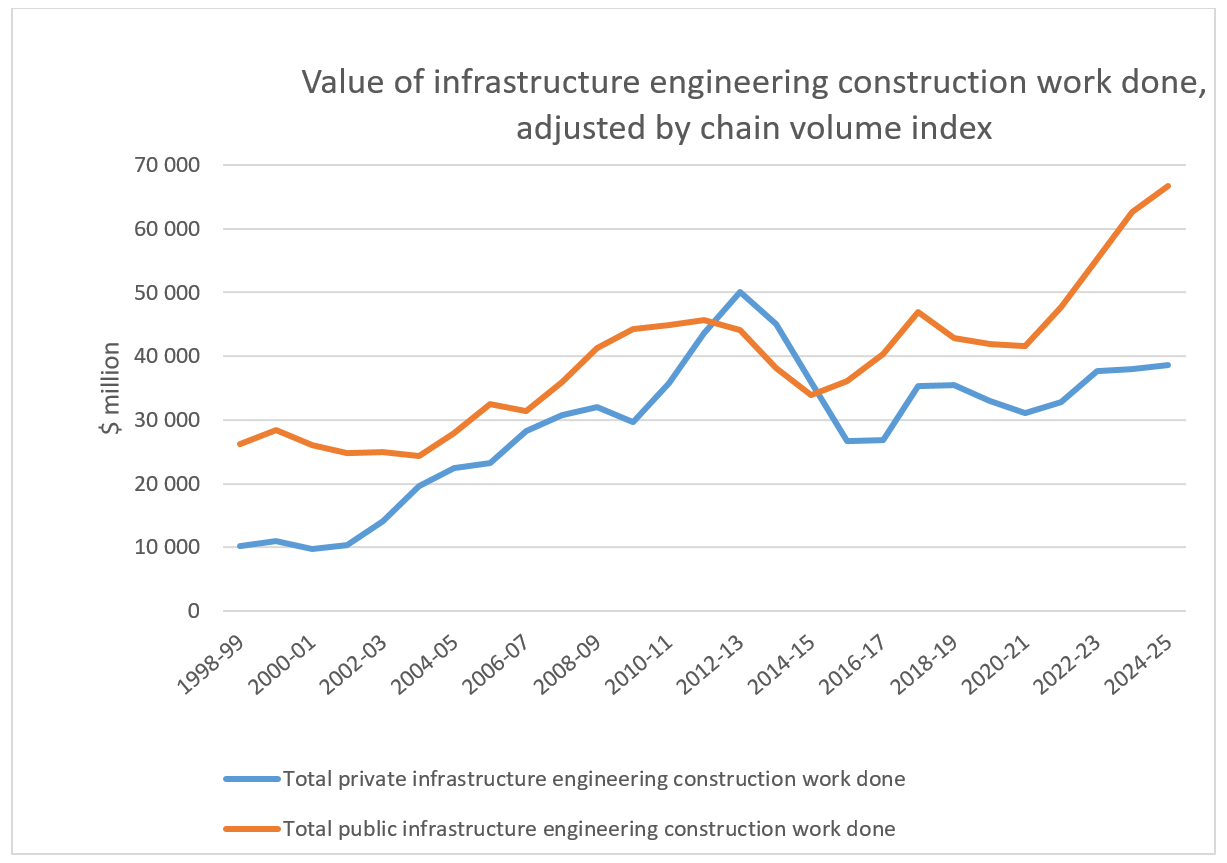
Source: ABS (2025), Engineering Construction Activity, Australia
Download data
- Infrastructure Construction—Yearbook 2025 (115 KB) - Download Excel file
- Australian Infrastructure and Transport Statistics Yearbook 2025 - Download PDF
Also see
Experimental analysis of networked service provision and hierarchies
Understanding the role of a given place in the network of human activities is critical when considering regional policies or local strategies. This paper applies a network lens to the spatial pattern of service provision in Australia. It considers the locations of services and their distribution in order to approximate catchment populations, develop population thresholds for each service, and order each service type. From there, the paper establishes a hierarchy of cities, towns and villages and uses this to explore connections between them.
- Experimental analysis of networked service provision and hierarchies
National profile of Transport, postal and warehousing workers in 2016
This information sheet is an update of BITRE's previous study on the same subject (BITRE Information Sheet 54) which used ABS 2011 census data. This study used ABS 2016 census data and provides details of the sub-industries in which TPW workers are employed, their employment status, hours worked, gender, age, occupation, educational qualifications, income, work location and commuting behaviour. It also describes some of the key changes that have occurred since 2011, such as the ageing and upskilling of the TPW workforce.
- National profile of Transport, postal and warehousing workers in 2016 [PDF: 863 KB]
National profile of Heavy and civil engineering construction workers in 2016
This study explores details of the sub-industries in which HCEC workers are employed, their employment status, hours worked, gender, age, occupation, educational qualifications, income, work location and commuting behaviour. It also describes some of the key changes that have occurred since 2011, including the changing gender mix and the upskilling of the HCEC workforce.
- National profile of Heavy and civil engineering construction workers in 2016
Electric Vehicle Uptake: Modelling a Global Phenomenon
This report describes an approach to estimating likely electric vehicle uptake for each of 22 countries around the world. Models of electric vehicle uptake were derived for Australia, Austria, Belgium, Britain, Canada, China, Denmark, Finland, France, Germany, India, Ireland, Italy, Japan, Korea, the Netherlands, New Zealand, Norway, Spain, Sweden, Switzerland, and the United States (as well as for the 'Rest of Europe').
- Electric Vehicle Uptake: Modelling a Global Phenomenon
- Data
Prices for Petrol and Gasoline—Modelling a Global Phenomenon
The report models petrol prices in 24 countries around the world - the world oil price determines the energy content of the petrol price, and then adding in taxes produces a prediction of the country's petrol price. The analysis also allows a prediction of how responsive a county's petrol price is to changes in the world oil price.
- Prices for Petrol and Gasoline–Modelling a Global Phenomenon
- World Petrol Prices Model