Run-off road crashes in Australia, 2016-2020
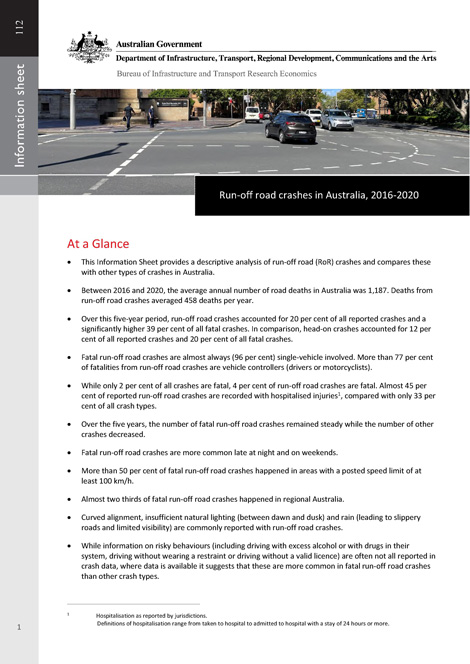
This Information Sheet provides descriptive analysis of run-off road (RoR) crashes and compares these with other types of crashes in Australia. Between 2016 to 2020, the average annual number of road deaths in Australia was 1,187. Deaths from run-off road crashes averaged 458 deaths per year. Run-off road crashes accounted for 20 per cent of all crashes and a significantly higher 39 per cent of all fatal crashes in Australia during the five-year period 2016 to 2020. Run-off road crashes form an important focus area in not only reducing total numbers of crashes but also the severity level of crashes.
Archived Road Trauma Involving Heavy Vehicles—Annual Summaries
-
2020
-
2019
- 2018
- 2017
- 2016
- 2015
- 2014
- 2013
Archived International Road Safety Comparisons—Annual
- 2022
- 2020
- 2019
- 2018
- 2017
- 2016
- 2015
- 2014
- 2013
- 2012
- 2011
- 2010
- 2009
- 2007
- 2006
- 2005
- 2004
- 2003
- 2002
- 2001
- Monograph 6: Australia's International Road Safety Performance 1998
- Monograph 2: Australia's International Road Safety Performance 1997
- Pre-ATSB (FORS) Monograph 28: Australia's International Road Safety Performance 1996
- Pre-ATSB (FORS) Monograph 16: Australia's International Road Safety Performance
- CR 114: Trends in Road Crash Fatality Rates: International Comparisons with Australia 1970–1990 (1992)
Archived Road Trauma Australia—Annual Summaries
Older issues of Road Trauma Australia—Annual Summaries are available below.
- 2022
- 2021
- 2020
- 2019
- 2018
- 2017
- 2016
- 2015
- 2014
- 2013
- 2012
- 2011
- 2010
- 2009
- 2008
- 2007
- 2006
- 2005
- 2004
- 2002
- 2001
Severe injuries from road crashes—Australia New Zealand Trauma Registry
These data extracts from the Australia New Zealand Trauma Registry provide summary tables of severe injury cases (admitted patients with an Injury Severity Score > 12) from participating hospitals. The report has separate tables for on-road transport, off-road transport, unknown transport and non-transport cases. Data are preliminary and relate to participating hospitals only
These tables are produced under the joint Australian Trauma Registry funding agreement between the Department of Health and the Department of Infrastructure, Transport, Regional Development, Communications and the Arts.
Location and other risk factors in crashes
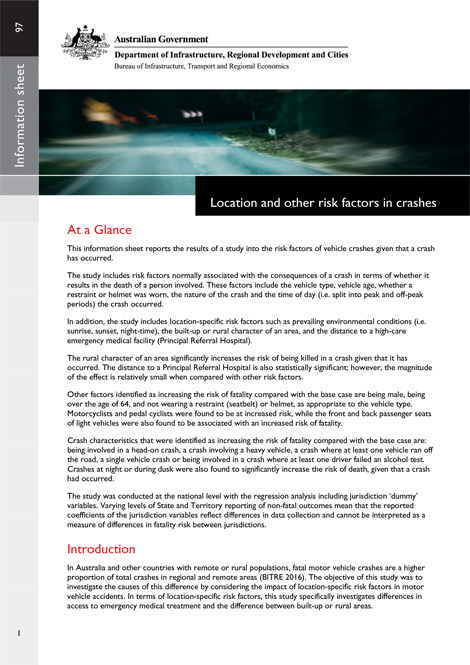
This information sheet reports results of a study into the risk factors of vehicle crashes given a crash has occurred in terms of whether it results in the death of a person involved. Factors include vehicle type and age, whether a restraint or helmet was worn, nature of crash, time of day and location-specific factors such as the built-up or rural character of an area, the distance to high-care emergency medical facility and environmental conditions i.e. sunrise, sunset or night-time.
- Location and other risk factors in crashes
Modelling Road Safety in Australian States and Territories
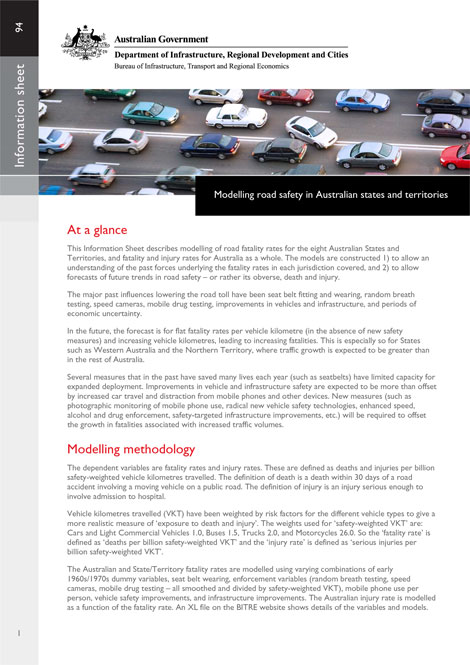
This Information Sheet describes modelling of road fatality rates for the eight Australian States and Territories, and fatality and injury rates for Australia as a whole. The models are constructed 1) to allow an understanding of the past forces underlying the fatality rates in each jurisdiction covered, and 2) to allow forecasts of future trends in road safety–or rather its obverse, death and injury.
- Modelling Road Safety in Australian States and Territories
- Modelling Road Safety in Australian States and Territories
Road Safety in Australia–Fact Sheet
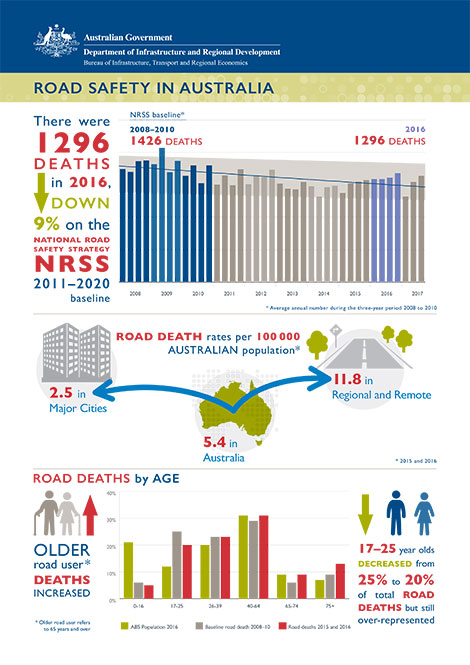
This fact sheet provides key road fatality data for 2015 and 2016, and how some key statistics have changed since the base years (2008 to 2010) of the National Road Safety Strategy 2011–2020.
- Road Safety in Australia–Fact Sheet
This information sheet provides an overview of the current status of motorcycling safety in Australia. In 2016 motorcyclist deaths increased by 22 per cent, to 248 deaths (almost 1 in five road deaths). This represents an increase of 7.4 per cent on the National Road Safety Strategy base years (2008-2010).
While the national trend in motorcyclist fatality rates over the last decade has improved by 40 per cent, increased exposure means that the number of motorcyclist deaths in Australia is now similar to 10 years ago. This underpins the need to identify further areas for improvement and focus efforts on reducing motorcyclist fatalities and hospitalised injuries.
- Motorcycling Safety
Light commercial vehicle safety
This information sheet analyses fatal crashes and fatalities involving light commercial vehicles. Light commercial vehicles account for more than 1 in 6 registered vehicles and almost 1 in 5 of total vehicle kilometres travelled (VKT).
In 2015 crashes involving light commercial vehicles accounted for 262 road deaths (21 per cent of road deaths), down 3.7 per cent on 2014. Deaths in crashes involving light commercial vehicles were down 5.0 per cent on the National Road Safety Strategy base period 2008–2010, less than light passenger vehicle involved crashes (down 16.4 per cent). This is partly due to greater exposure. Adjusting for VKT, light commercial vehicle fatal crash rates are still 17 per cent higher per billion VKT than for light passenger vehicles.
- Light commercial vehicle safety