Data on the latest national and state/territory road deaths and fatal crashes can be found on the National Road Safety Data Hub website.
Quarterly heavy vehicle road deaths
Explore up-to-date data tracking counts of fatalities in crashes involving heavy vehicles on the National Road Safety Data Hub.
Explore annual data on Australian road deaths from 2008 as reported by state and territory transport authorities. You can use the dashboard to explore data under 5 themes: overview, roads, road users, vehicles and fatality rates.
Chapter 6
This chapter provides the following information on Australian roads: road distances, road length in kilometres, licence registration transactions over different vehicle types, electric vehicles attributes and registration transactions.
A variety of sources are used for this data, including data from the Australian Bureau of Statistics, the Department of Infrastructure, Transport, Regional Development, Communications and the Arts, Federal Chamber of Automotive Industries (FCAI), VFACTS, BITRE estimates and State and Territory Governments.
- Australia's total estimated paved road length was 463,000 kilometres in 2023.
- An estimated 260 billion vehicle kilometres were travelled on Australia's roads in 2023–24.
- In 2023–24, Sports Utility Vehicles (SUVs) comprised 56% of new motor vehicle sales (excluding motor cycles) compared with only 30% 10 years earlier.
- In 2023, there were 87 thousand fully electric vehicle sales in Australia, up from 33 thousand the previous year.
Figure 13 shows the sale of registered battery electric vehicles and Plug-in Hybrids over time. Fully battery electric vehicles sales increased by 161 per cent between 2022 and 2023.
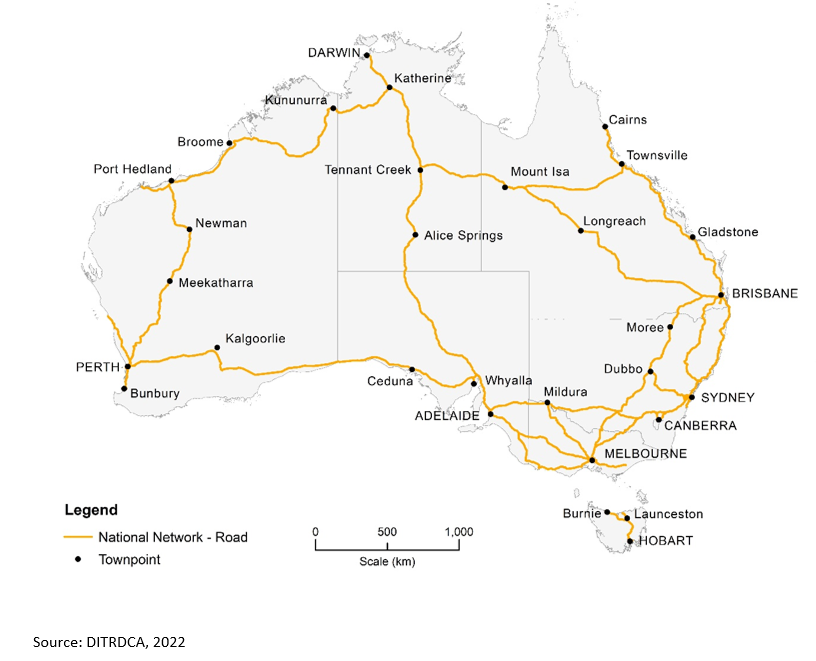
Figure 14 shows Australia's national road network.
Figure 13 Sales of electric vehicles
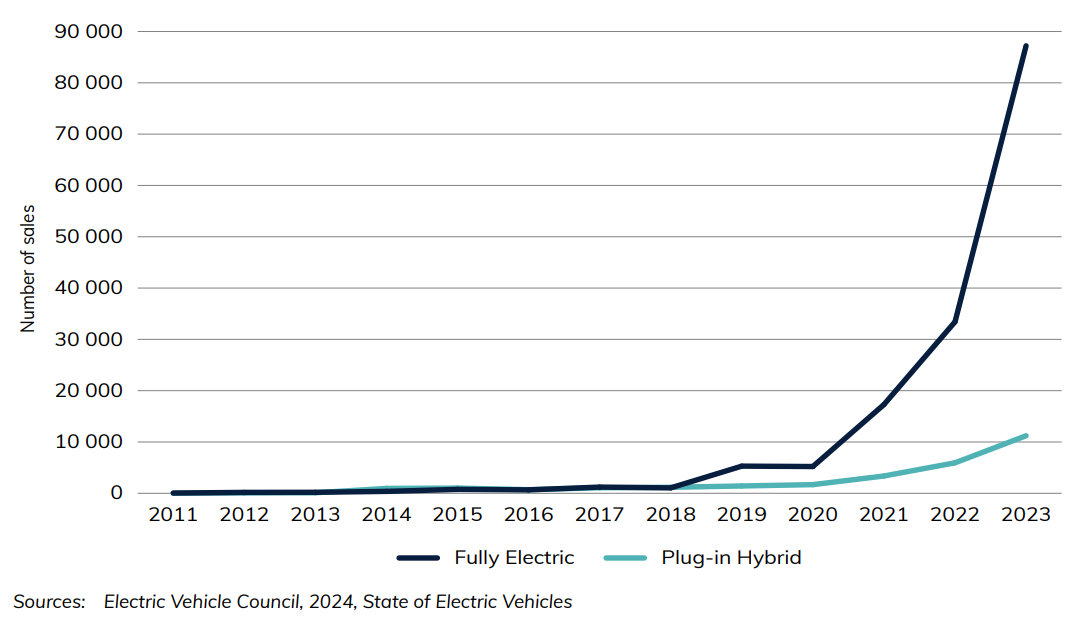
Figure 14 Map of national road network
Download data
- Road—Yearbook 2024 (XLSX 291 KB) - Download Excel file
- Australian Infrastructure and Transport Statistics—Yearbook 2024 - Download PDF
Also see
Chapter 10
This chapter provides data on Australian safety for road, aviation, rail and maritime transport. This includes data relating to crashes, fatalities, injuries and their rates of occurrence, as well as how this can differ for different demographics, states and territories (subject to data availability).
- In 2023, 1 258 people died in road crashes in Australia, down from 1 737 in 2001.
- 33 aviation fatalities occurred in Australia in 2023.
- Road crashes caused 40 000 people in Australia to be with hospitalized injuries in 2021 up from 27 000 in 2001.
- On Australia's railways, 15 people died and 63 were seriously injured in 2023 (excludes suspected suicide).
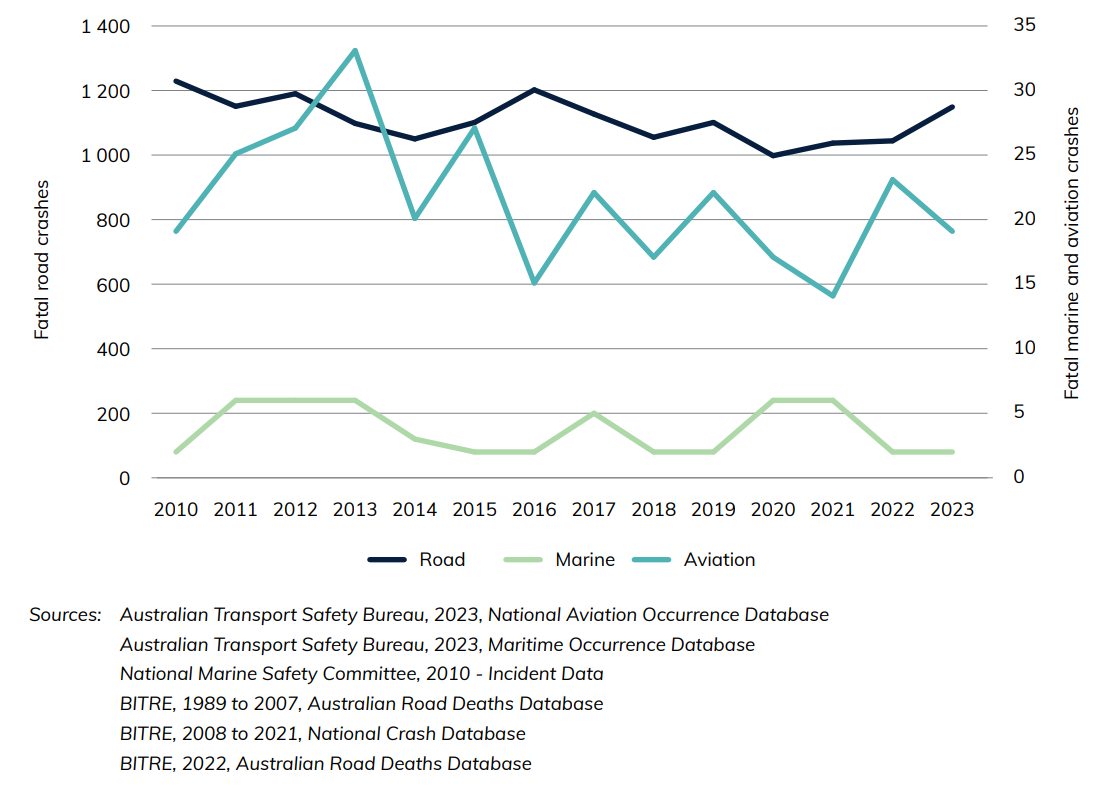
Figure 21 shows the number of fatal crashes over time (with road crashes on the left axis and marine and aviation crashes on the right axis). The average number of fatal road crashes (the number of crashes or accidents which resulted in at least one death) from 2010 to 2023 is 1109. In 2023 there was 1149 fatal road crashes. Fatal aviation crashes have remained between 14 and 23 since 2016. Marine fatal crashes have remained between 2 and 6 from 2010 to 2023.
Figure 21 Number of fatal crashes, by transport mode
Download data
- Transport Safety—Yearbook 2024 (178 KB) - Download Excel file
- Australian Infrastructure and Transport Statistics—Yearbook 2024 - Download PDF
Also see
Child pedestrian safety: ‘driveway deaths’ and ‘low-speed vehicle run-overs’, Australia, 2001–10
First Nations Peoples road deaths
The excel tables present annual road deaths, population and road death rates per 100,000 population from 2012 to 2021 by state and territory (where data is available), by indigenous status. The excel tables include road deaths and road death rates per 100,000 population for First Nations Peoples by age group, sex, road user, remoteness area and vehicle type. Additional tables for First Nations Peoples population are available by state and territory and age group and sex.
Road vehicle entry and recall statistics
Monthly statistics on road vehicles being provided to the Australian market, road vehicle recall notices and other road vehicle-related regulatory activities governed under the Road Vehicle Standards Act 2018 (RVSA).
Data on road safety enforcement activities can be found on the National Road Safety Data Hub website.
The data provides information on road safety enforcement activities undertaken across Australian states and territories from 2008, including:
- unlicensed driving
- random roadside alcohol breath tests
- roadside drug tests
- speeding infringements
- mobile phone use while driving infringements
- seatbelt infringements
The series is collated from data collected by multiple organisations with varied definitions and data collection practices are not fully consistent across states and territories. Please see the data dictionary and the dashboard for more information.
BITRE is working with data owners to introduce more consistent definitions, address data gaps and investigate opportunities to streamline data collection and sharing processes. This will improve the value of this data series for policymakers, including for reporting on progress on the National Road Safety Strategy 2021-30 and National Road Safety Action Plan 2023-25.
Social Cost of Road Crashes
Updated content: this report replaces the version uploaded on Friday 14 October. Text and chart changes have been made to the report’s section on age.
The Australian National University (ANU) was engaged by the Bureau of Infrastructure and Transport Research Economics (BITRE) to develop a model to estimate the social cost of road crashes in Australia. The current study replicates and extends the previous BITRE costing study (BITRE, 2009) by using current data, improved methods and broader scope of analysis, including analysis of who bears the burden of road crashes. The current study also set out to aid in addressing three policy questions posed by BITRE by drawing on results of the costing study as well as a rapid review of relevant literature.
The ANU research team members include Emily Lancsar, Ralf Steinhauser, Siobhan Bourke, Robert Breunig, Russell Gruen, Leo Dobes, Liza Munira, Liliana Bulfone, Kathryn Glass, Cameron Gordon, and Jolene Cox.
The BITRE team was Tim Risbey and Dr Gary Dolman, with key contributions from Dr Mark Harvey, Leo Soames and Simon O'Mahony, and Neil Thompson from the Office of Road Safety.
BITRE greatly appreciated the assistance of stakeholders who provided data, participated in the two project workshops, and provided comments on the draft report.