Chapter 10
This chapter provides data on Australian safety for road, aviation, rail and maritime transport types. This includes data relating to crashes, fatalities, injuries and their rates of occurrence, as well as how this can differ for different demographics, states and territories (subject to data availability).
- In 2022, 1,180 people died in road crashes in Australia, down from 1 737 in 2001.
- 34 aviation fatalities occurred in Australia in 2022.
- Road crashes caused 40 000 people in Australia to be with hospitalized injuries in 2021 up from 27 000 in 2001.
- On Australia’s railways, 13 people died and 47 were seriously injured in 2022 (excludes suspected suicide).
Figure 1 Number of fatal crashes, by transport mode
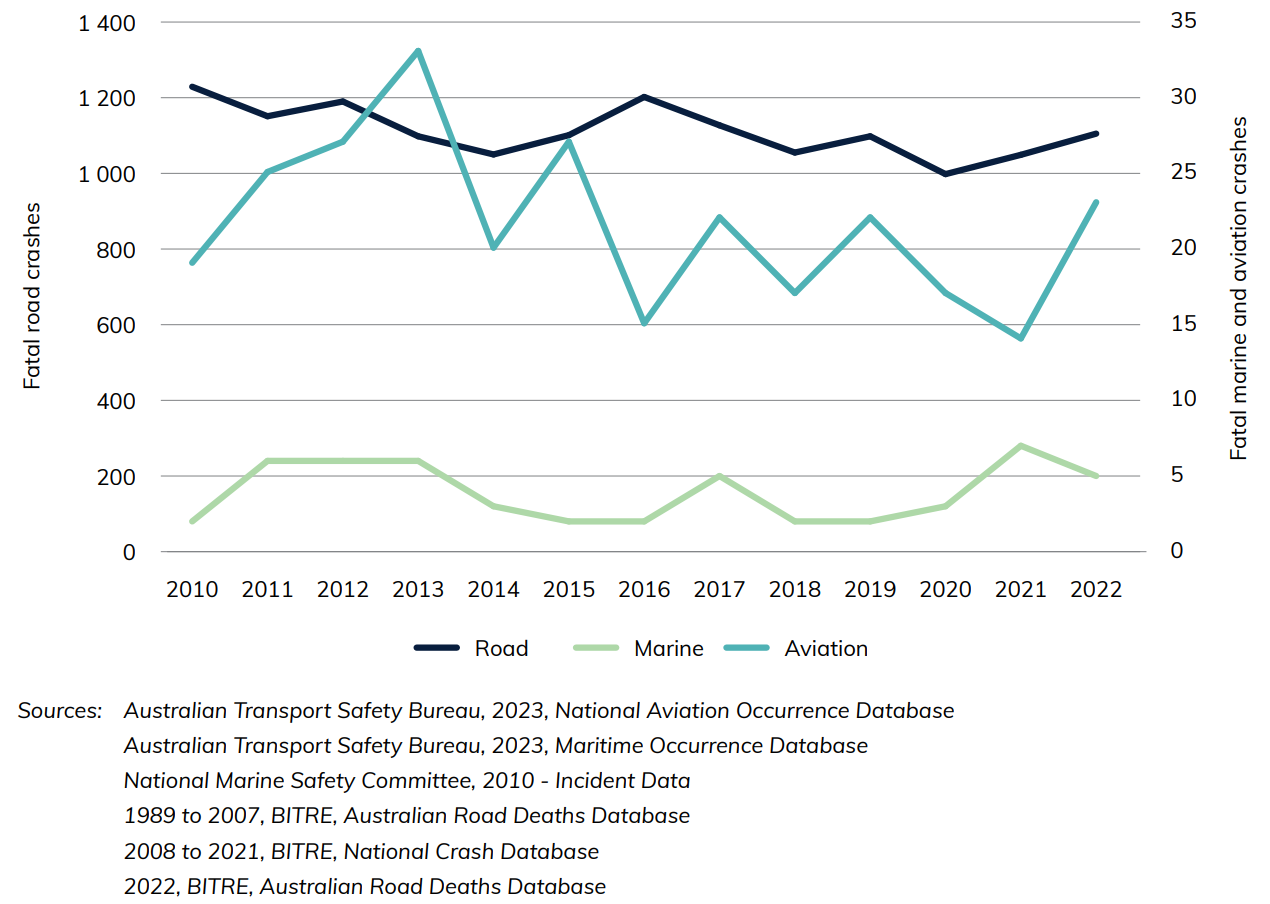
This graph shows the number of fatal crashes over time, by transport mode (with road crashes on the left axis and marine and aviation crashes on the right axis). Fatal road crashes (the number of crashes or accidents which resulted in at least one death) have been slowly trending downwards between 2010 and 2022, falling from 1 229 to 1 105, with an average of 1 112 over this period. There were 33 fatal aviation crashes in 2013 and they have remained between 14 and 23 since 2016. Marine fatal crashes have remained between 2 and 6 from 2010 to 2022.
Download data
Also see
Transport Energy and Environment
Chapter 11
This chapter provides information on the Australian measures of transport energy and the environment. Data is sourced from the Department of Climate Change, Energy, the Environment and Water’s petroleum statistics and BITRE estimates.
- Road vehicles made up 84 percent of full fuel cycle greenhouse gas emissions from all domestic transport modes in 2022-23, compared to 9 per cent from aviation.
- The national average price for petrol was 182.9 cents per litre in the 2022‑23 financial year.
- In 2022-23, domestic road vehicle full fuel cycle greenhouse gas emissions estimates (carbon dioxide equivalent) reached a record high level of 106 000 gigagrams of CO2 equivalent.
- In 2022-23, there was an estimated 56 billion litres of transport petroleum sold in Australia.
Figure 1 Selected refined petroleum products—Australian production
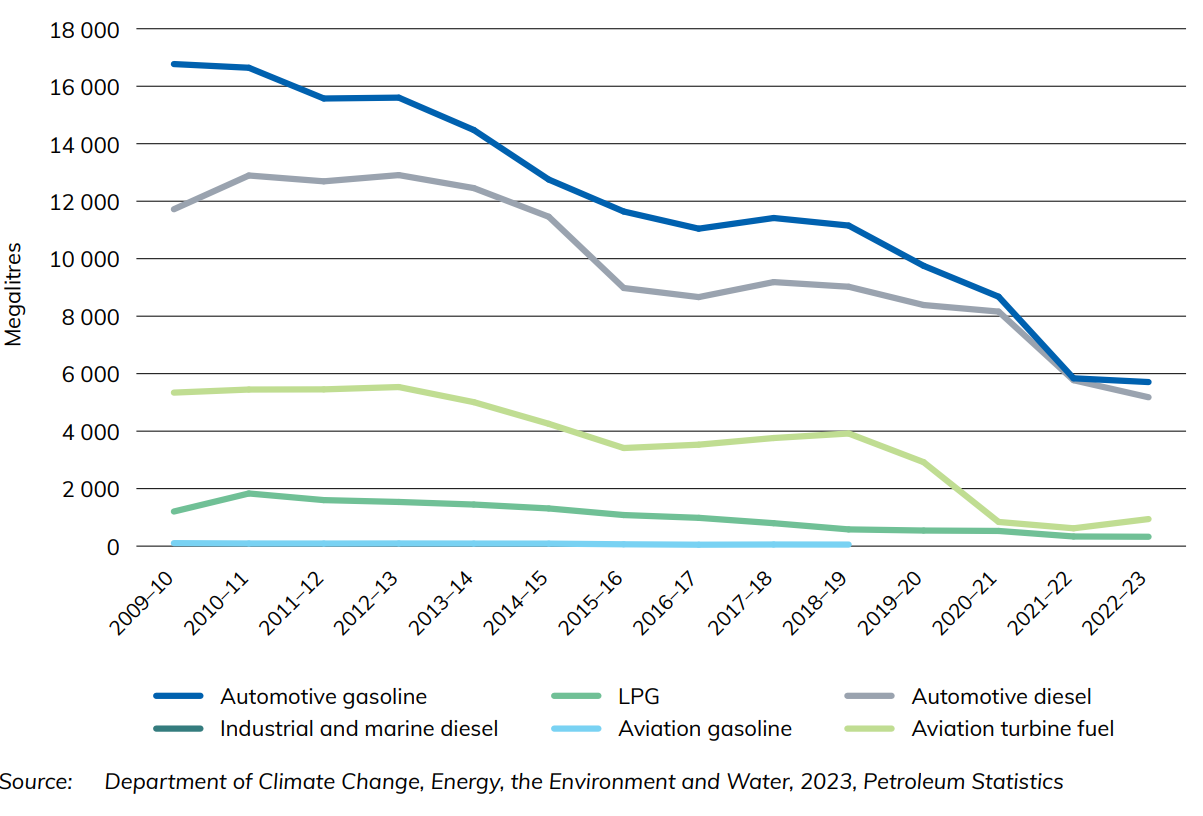
Figure 1 shows the change in production of selected refined petroleum products in Australia since 2009-10. It highlights how Australia’s production of these selected refined petroleum products is declining with time.
Figure 2 Selected refined petroleum products—imports to Australia

Figure 2 depicts the change in selected refined Australian petroleum imported for various transport industries as at June of each financial year.
Figure 3 Selected refined petroleum products—exports from Australia

Figure 3 shows the change in selected refined Australian petroleum exported for various transport industries as at June of each financial year.
Figure 4 Transport full fuel cycle greenhouse gas emissions
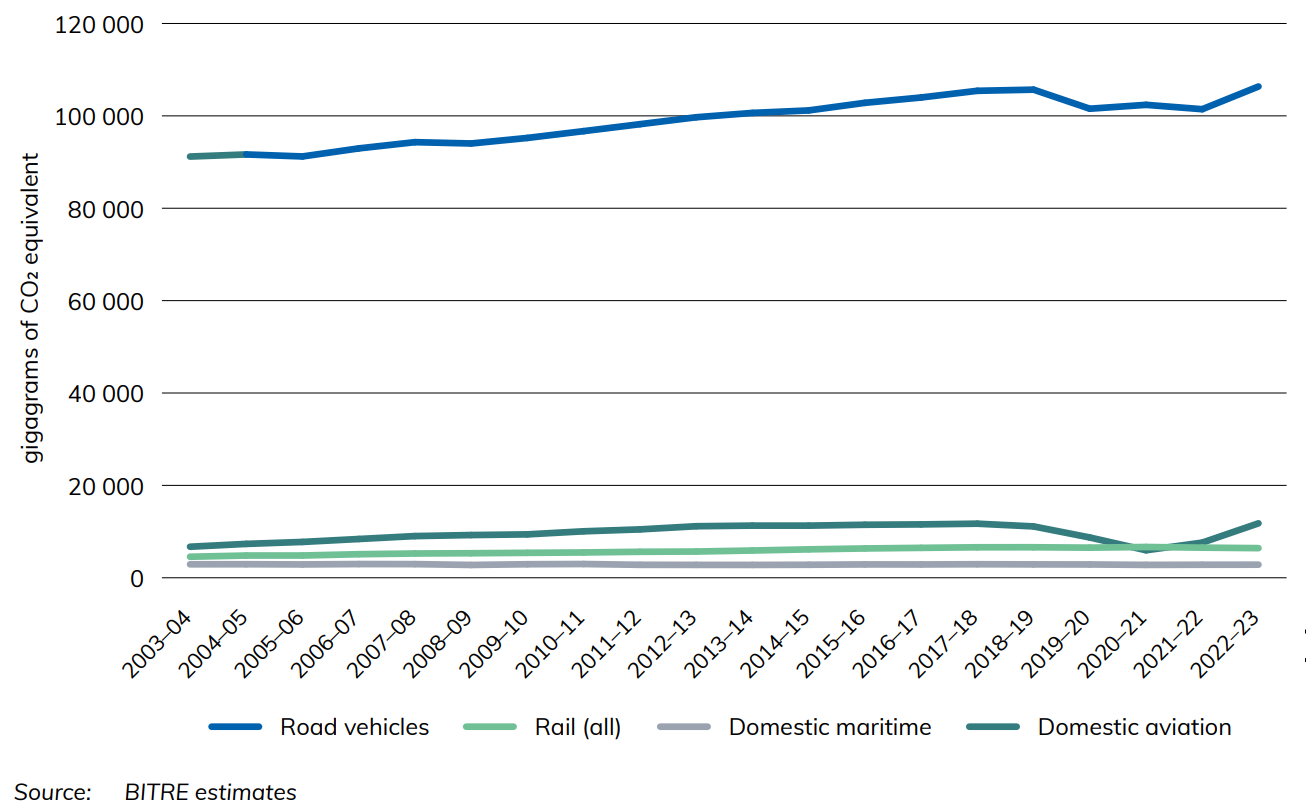
Figure 4 shows full fuel cycle greenhouse gas emissions by transport mode in gigagrams of CO2 equivalent. Transport emissions estimates in Australia have risen steadily since 1974-75, except over the COVID-19 pandemic period, which saw them dip temporarily for road vehicles and domestic aviation. Domestic aviation emissions were most affected, almost halving from 11 116 gigagrams of CO2 equivalent in 2018-19 to 5 955 gigagrams of CO2 equivalent in 2020-21, while road vehicle emissions fell by roughly 3 per cent over the same period. In 2022-23, estimates of emissions from domestic aviation and road vehicles both increased to their new highest levels, 11 784 and 106 355 gigagrams of CO2 equivalent respectively.
Download data
Also see
Tasmanian Freight Equalisation Scheme Monitoring Reports
The Tasmanian Freight Equalisation Scheme (TFES) provides financial assistance for cost incurred by shippers of eligible non-bulk goods moved by sea across the Bass Strait. More information about the operation of the Scheme can be found at Tasmanian Freight Equalisation Scheme | Department of Infrastructure, Transport, Regional Development, Communications and the Arts.
Under the TFES Ministerial Directions, BITRE provides a statistical report on all components of the Scheme every four years. The Monitoring Reports and other reports related to the scheme are linked below.
Monitoring Reports
- Tasmanian Freight Equalisation Scheme Monitoring Report 2024
- Consultation Draft Tasmanian Freight Equalisation Scheme Monitoring Report 2024
- Monitoring report 2020 Tasmanian Freight Equalisation Scheme
Other Reports
- Tasmanian Freight Equalisation Scheme - Review of the expanded component: Final Report (2018)
- Tasmanian Freight Equalisation Scheme: A 'Landbridge' Approach to the Estimation of Subsidy Rates (1981)
- Tasmanian Freight Equalisation Scheme: Recommended Rates of Assistance for Southbound Cargoes, Livestock and Timber at 31 January 1979
- Tasmanian Freight Equalisation Scheme: Recommended Northbound Assistance Rates at 1 January 1978
- Tasmanian Freight Equalisation Scheme: Discussion Paper September 1996
Tasmanian Freight Schemes Parameter Reviews
Infrastructure and the Economy
Chapter 1
This chapter provides data on the Australian economy including the value added by Australian infrastructure industries in addition to:
- employment in the transport and storage industry
- average weekly earnings for road, rail, water and air and space industries
- price indices
- 4.6 per cent of Australia's GDP was accounted for by Australia's transport, postal and warehousing industry in 2023-24.
- 297 thousand people were employed in the road transport industry compared to 46 thousand in the rail industry.
- $1 639 is the average weekly earnings for the road transport industry in 2023
- 83 per cent of people employed within the road transport industry identify as male.
The gross value added of transport, postal and warehousing as a percentage of GDP has remained relatively stable since 1974-75, generally ranging between 4-5% of GDP. In terms of employment, although employment in the transport, postal and warehousing industry has grown in overall terms, as a percentage of total Australian employment, it has stayed at around 5% for the last 30 years. Figure 1 shows employment statistics for various transport industries as at August of each year.
Figure 1 Australian employment numbers in selected major infrastructure industries
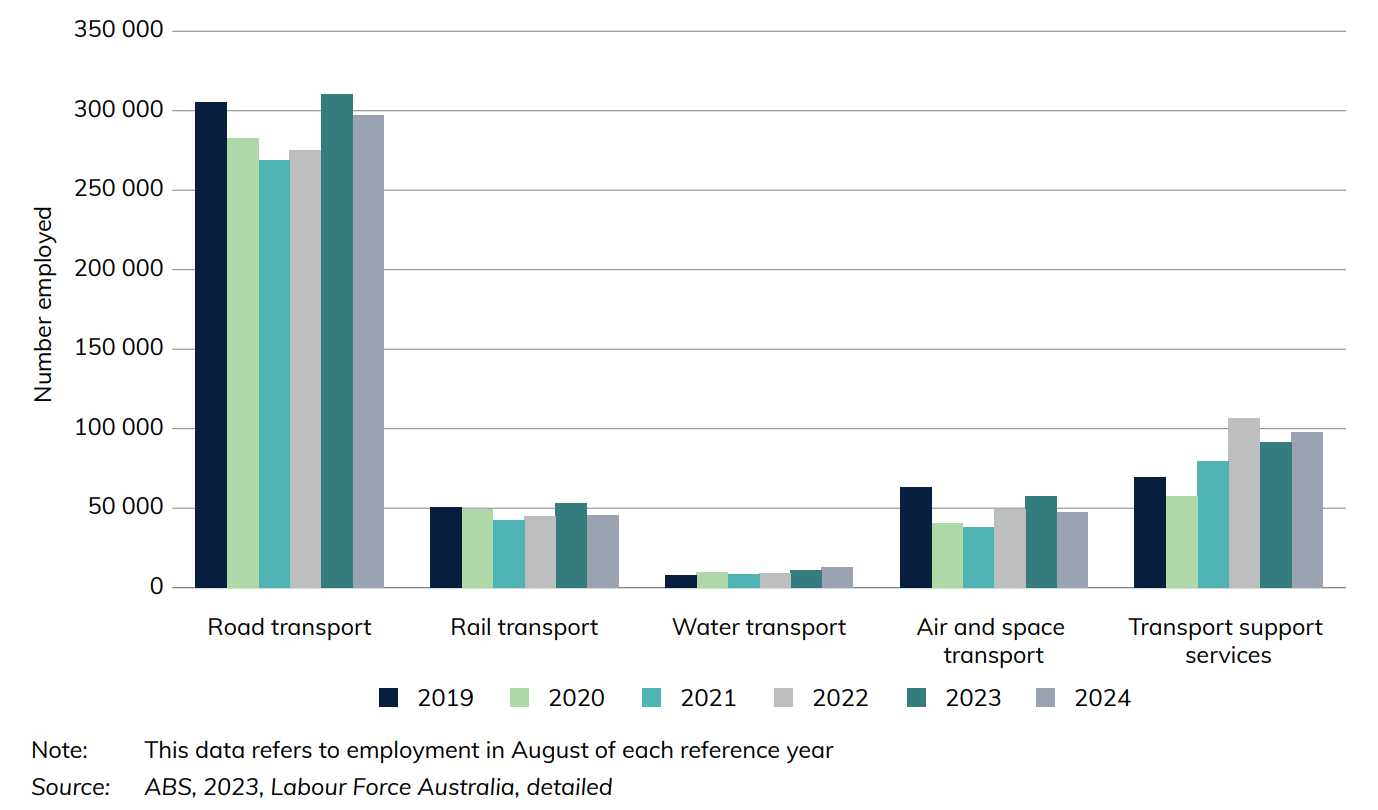
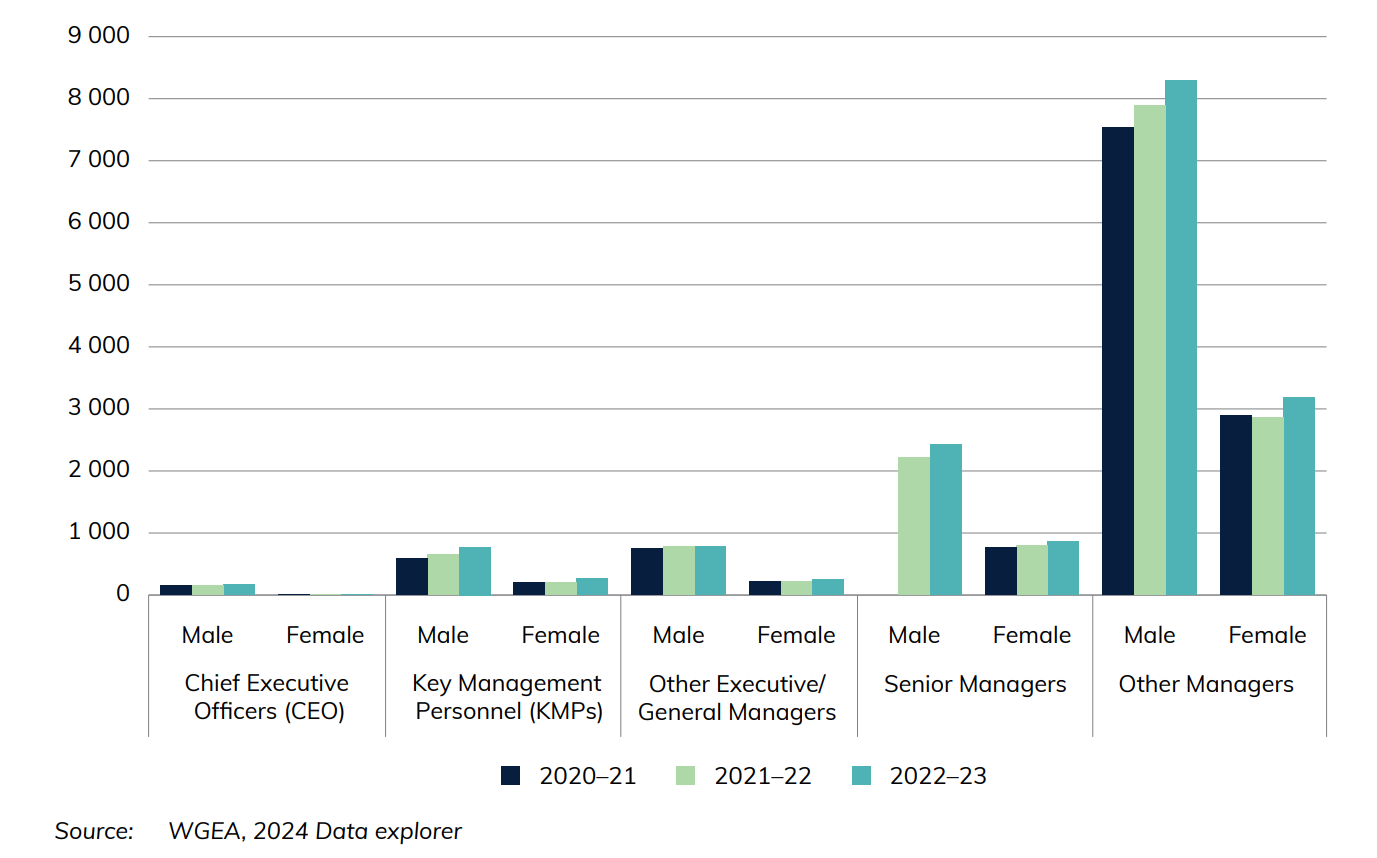
Figure 2 compares the number of leadership positions held by men and women within the transport industry for non-public sector organisations over 100 employees. In 2022-23, leadership positions in the transport industry were predominantly occupied by males, with 12,453 males in Chief Executive Officer, Key Management Personnel/Heads of Business and other managerial positions compared to 4,584 females.
Figure 2 Leadership positions held in transport industries, by gender
Download data
- Infrastructure and the Economy—Yearbook 2024 (140 KB) - Download Excel file
- Australian Infrastructure and Transport Statistics Yearbook 2024 - Download PDF
Also see
Infrastructure Construction
Chapter 2
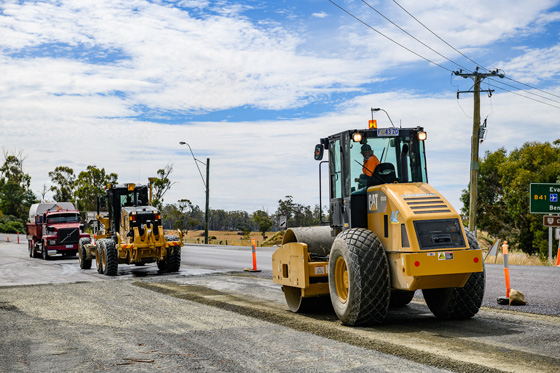
This chapter provides information on Australian measures of infrastructure engineering construction. These are classified as: transport (roads, rail, harbours, etc), energy (electricity and gas transmission networks, etcetera), telecommunications networks, and water supply and distribution networks. Data is sourced from the Australian Bureau of Statistics, Engineering Construction Activity, Australia publication.
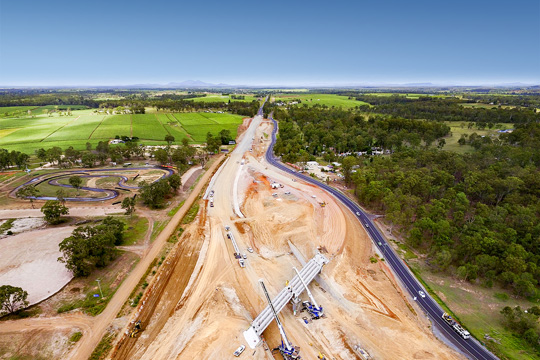
- Transport infrastructure engineering construction work done recorded a new all-time high of $51 billion (adjusted by chain volume index) in 2023–24. This accounted for 53 per cent of the value of infrastructure construction work done in Australia (including transport, energy, telecommunications and water).
- In 2023–24, the value of road engineering construction work done was:
- $33 billion on roads and bridges
- $16 billion on railways
- $1.5 billion on harbours.
Figure 3 and Figure 4 show the change in infrastructure investment activity in Australia over time. Transport, water and energy investment increased relatively consistently until roughly 2012–13, when they each experienced a notable fall. They have recovered in recent years, however, with the Transport sector reaching its new highest point of roughly $51 billion in 2023–24 (Figure 3).
Figure 3 Infrastructure construction activity, adjusted by chain volume index
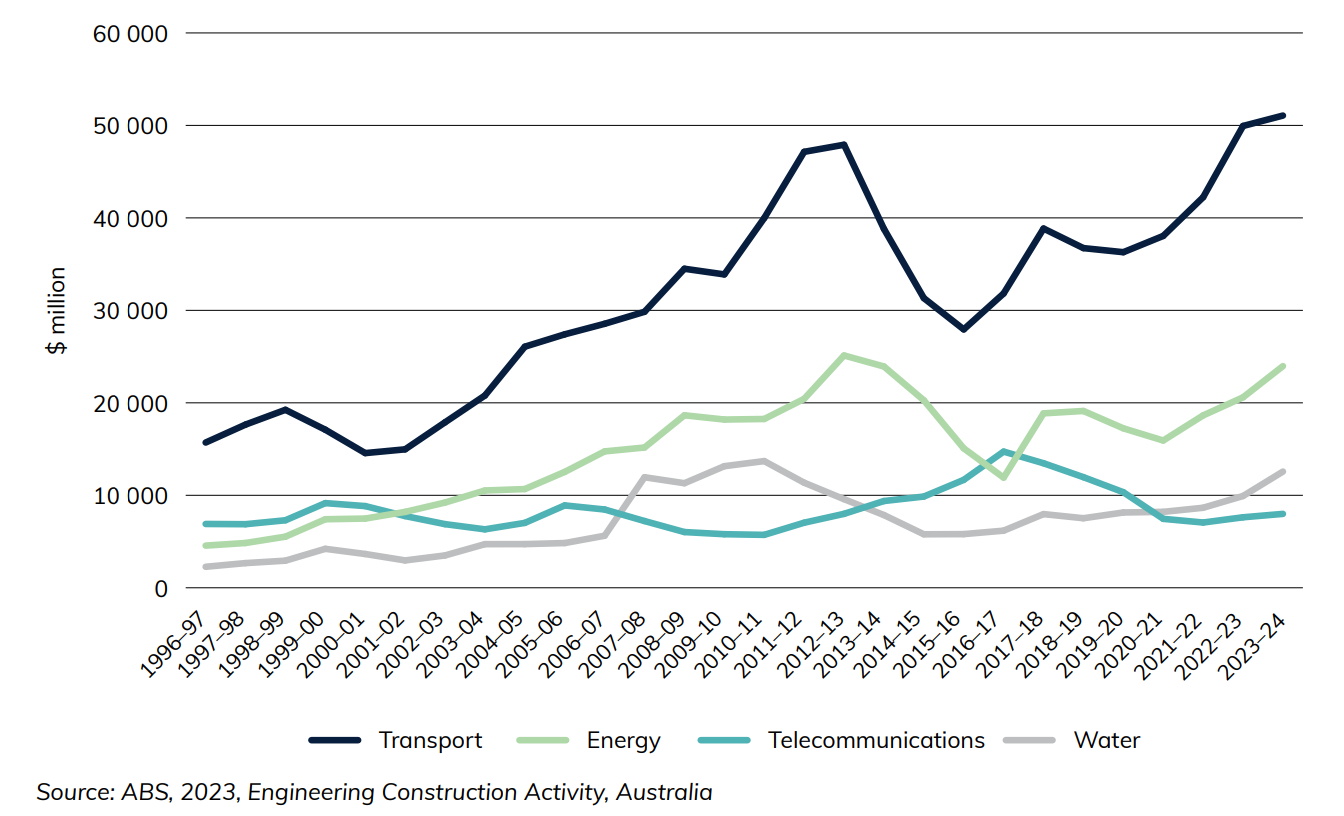
Figure 4 shows the value of engineering Construction activity on different modes of transport. Both road (including bridges) ($33 billion) and railways ($16 billion) have recorded record highs two years in a row.
Figure 4 Infrastructure construction activity, by sector, adjusted by chain volume index
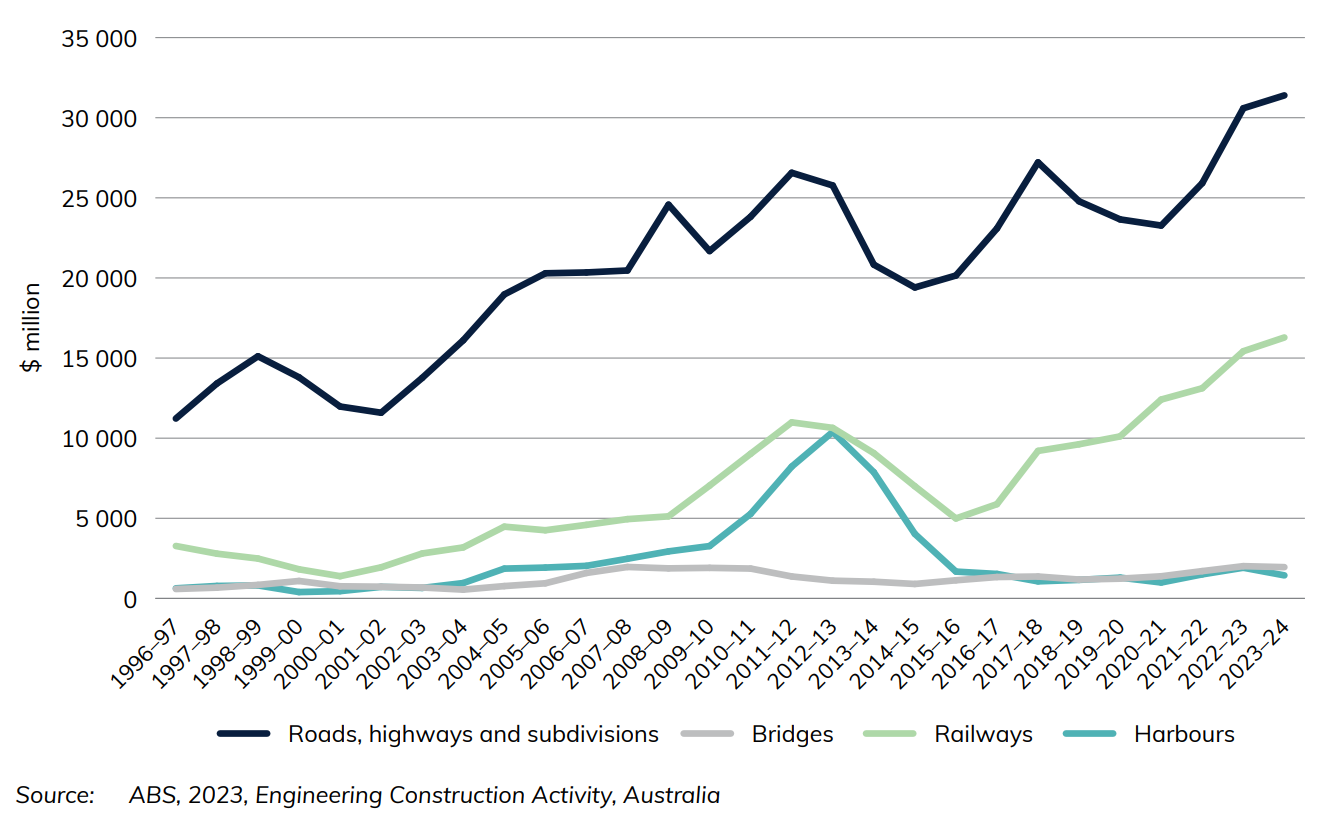
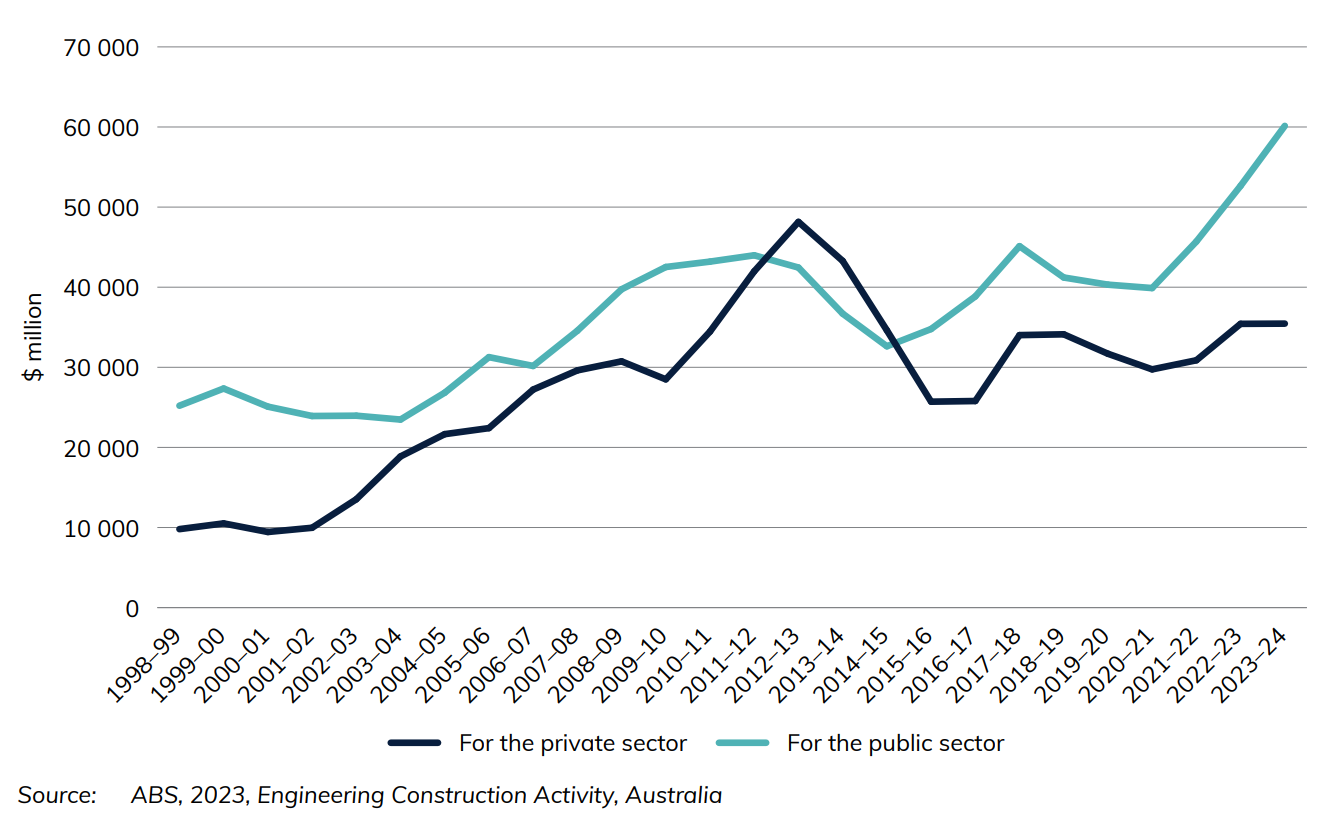
Figure 5 illustrates the private and public sector changes in Australian infrastructure expenditure.
Figure 5 Infrastructure construction activity, by sector, adjusted by chain volume index
Download data
- Infrastructure Construction—Yearbook 2024 (109 KB) - Download Excel file
- Australian Infrastructure and Transport Statistics—Yearbook 2024 - Download PDF
Also see
Road-related Revenue and Expenditure
Chapter 3
This chapter provides information on the Government's total expenditures and sources of revenue for road-related activities for the Commonwealth, state and local Government (noting only expenditure is shown at the local level). A general overview for the Commonwealth is presented first, before expenditures (Table 3.1) and revenues (Table 3.2) are broken down at state/territory level. A variety of sources are used for this data, including data from the Australian Tax Office, the Australian Bureau of Statistics, the Department of Infrastructure, Transport, Regional Development, Communications and the Arts, the Commonwealth Budget, BITRE estimates and State and Territory Governments. For a more detailed breakdown, please refer to the endnotes for Chaptere 3.
- The public sector (National, state and local) spent $39 billion in roads in 2022–23.
- $31 billion in road-related revenue was collected (excluding road-related revenue from the Goods and Services Tax, Fringe Benefits Tax and the Luxury Car Tax).
Public sector road-related expenditure over time can be seen in Figuree 6.
Figure 6 Road-related expenditure, by level of government (constant 2022–23 prices, adjusted by CPI)
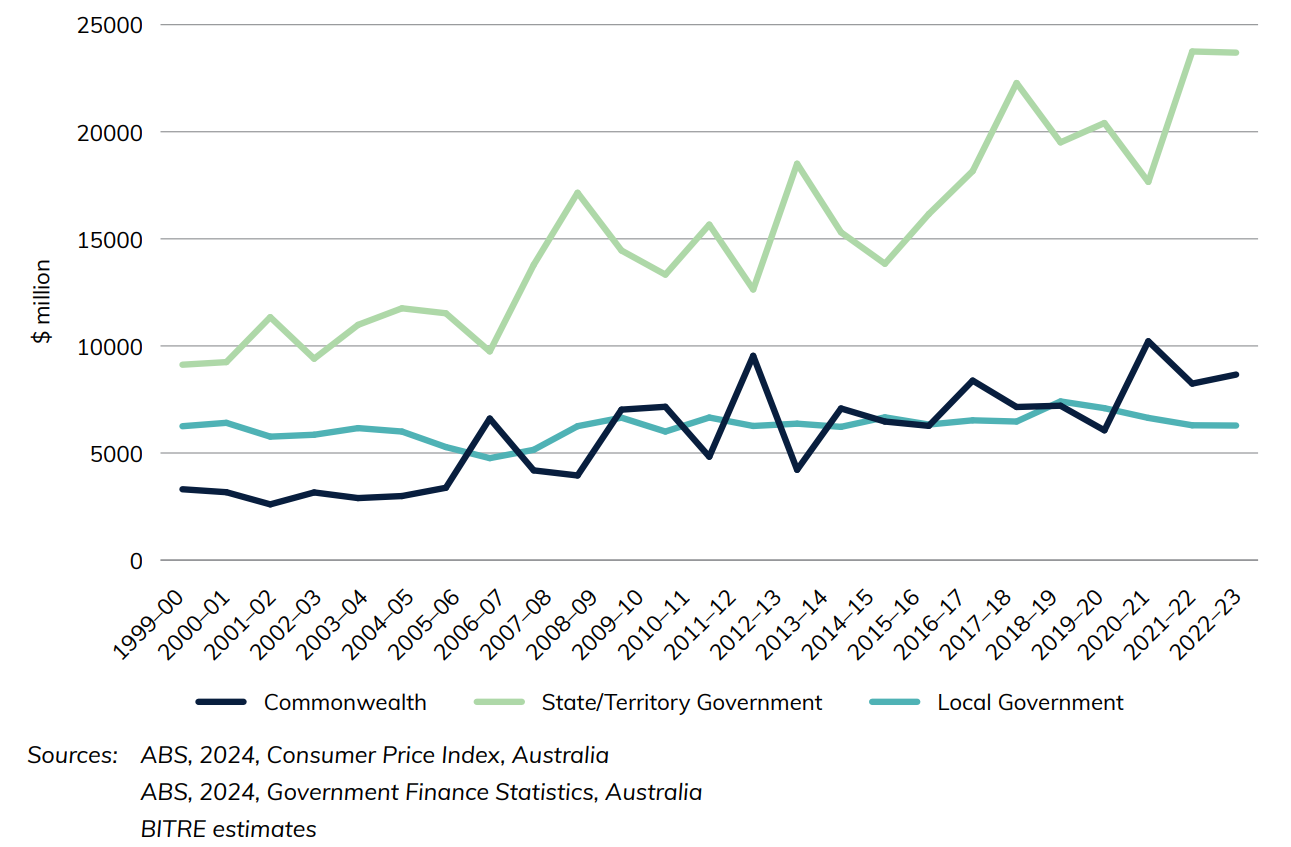
Figure 7 shows selected road-related revenues
Figure 7 Selected road-related revenues
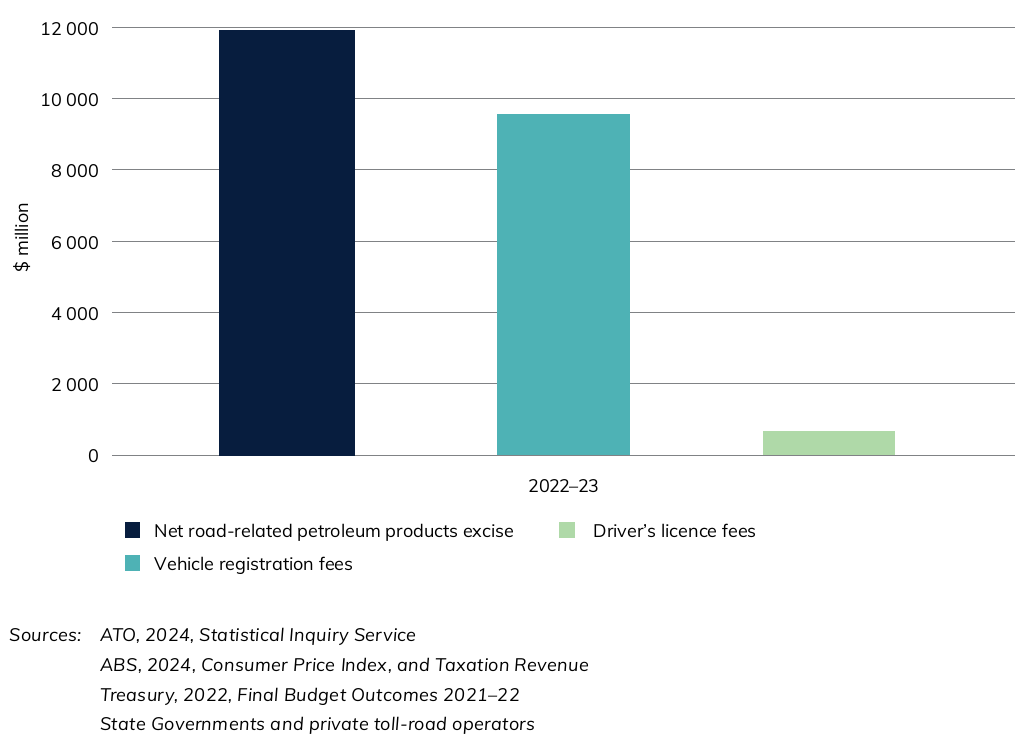
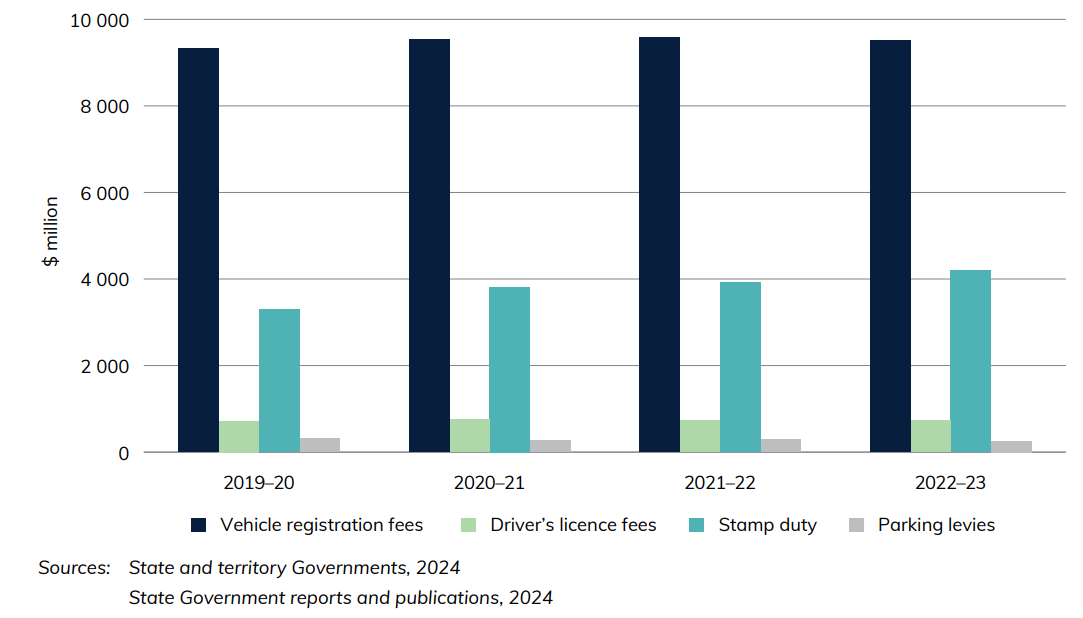
Figure 8 illustrates that the majority of revenue for the states/territories is vehicle registration fees.
Figure 8 State and Territory Government Road-related revenues (excluding tolls)
Download data
- Road-related Revenue and Expenditure—Yearbook 2024 (234 KB) - Download Excel file
- Australian Infrastructure and Transport Statistics—Yearbook 2024 - Download PDF
Also see
Freight chapter - Yearbook 2024
Chapter 4
Download data
- Australian Infrastructure and Transport Statistics Yearbook 2024 - Download PDF
- Freight—Yearbook 2024 (146 KB) - Download Excel file
Freight transport activity (Figures 9 and 10) is measured in terms of tonne kilometres (the number of tonnes moved by a vehicle multiplied by the distance the load travelled in kilometres). The Australian domestic freight task has experienced strong growth over the last 40 years, with road and rail freight now dominating domestic freight activity.
- Melbourne had the most metropolitan road freight estimated at 17.8 billion tonne-kilometres in 2023–24.
- NSW's estimated road freight for 2023–24 was the highest on record at 86 billion tonne-kilometres.
Figure 9 shows a map of Australia's major domestic freight flows by transport mode. Line and arrow thickness indicate the volume of freight carried on each route, not the value of freight or performance of supply chains. The map shows that the highest volume domestic freight route is iron ore transported by rail in the Pilbara region. This next largest individual flow is coal carried by rail in Central Queensland and the Hunter Valley, followed by bauxite shipped from Weipa and Gove to Gladstone.
Figure 9 Australia's Freight Flows Map
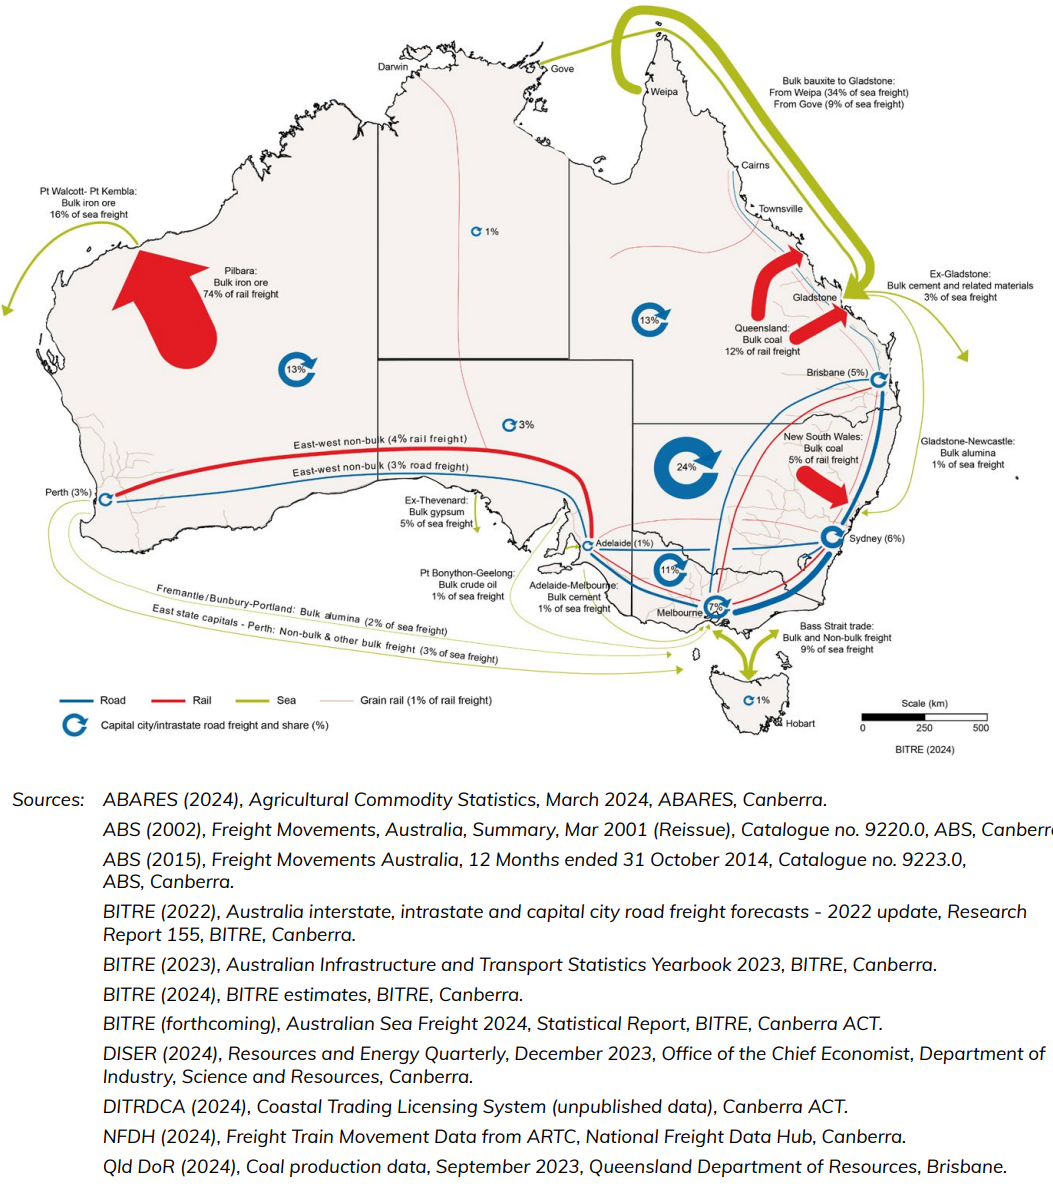
Figure 10 Australian domestic freight task, by mode of transport
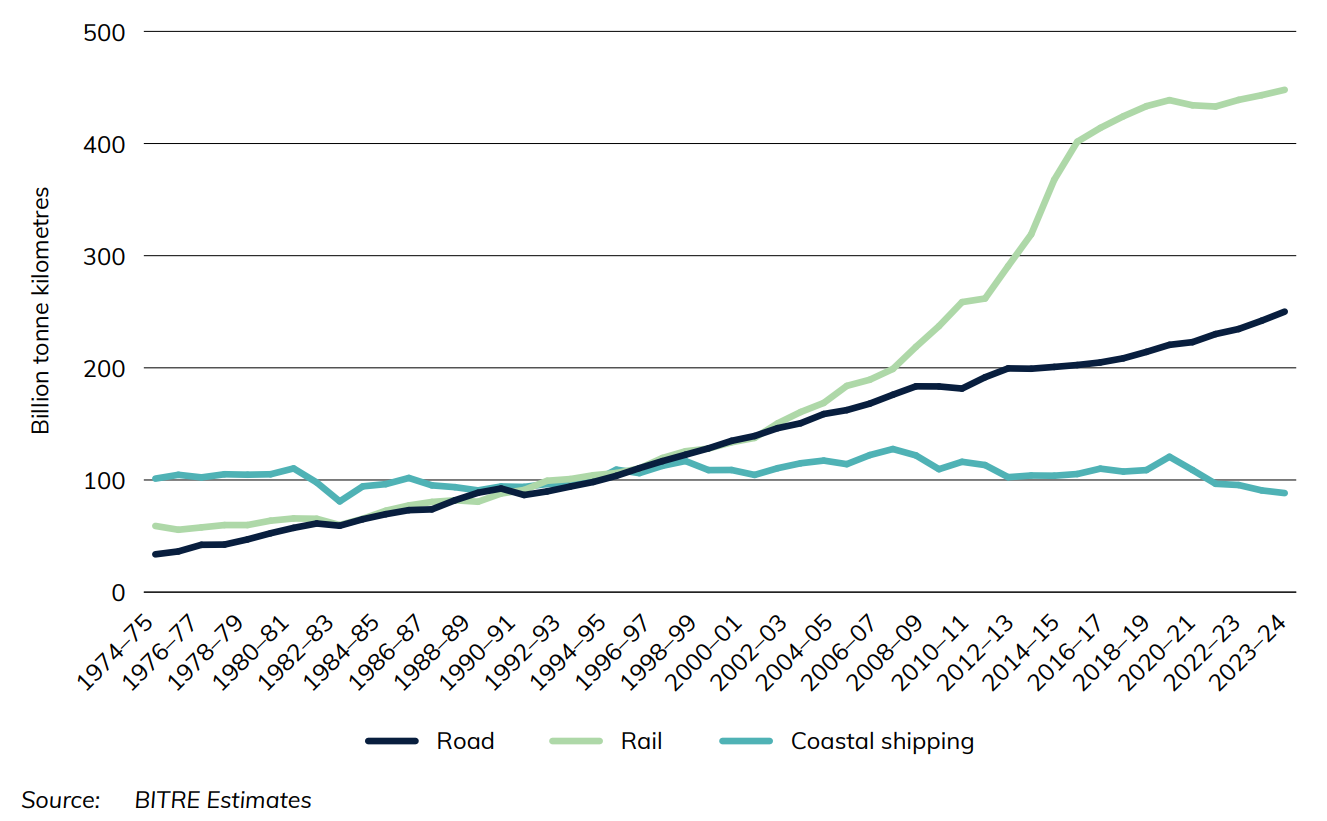
The Australian domestic freight task (Figure 2) has experienced strong growth over the last 40 years, with road and rail freight now dominating domestic freight activity.
Also see
Chapter 5

- Australian Infrastructure and Transport Statistics—Yearbook 2024 - Download PDF
- Passengers—Yearbook 2024 (195 KB) - Download Excel file
This chapter provides information on passenger transport activity, including nationally, by city pair, by capital city and by method of travel to work. The data in this chapter comes from a variety of sources, being from BITRE's estimates, the ABS' Census Basic Community Profiles Series and from Tourism Research Australia.
- 163 billion passenger kilometres were travelled by car on capital city roads in 2023–24, returning to pre COVID pandemic levels of 2018–19.
- 15 billion passenger kilometres were travelled on heavy rail networks in 2023–24.
- 18 billion passenger kilometres were travelled on heavy rail in 2018–19, prior to any COVID impacts.
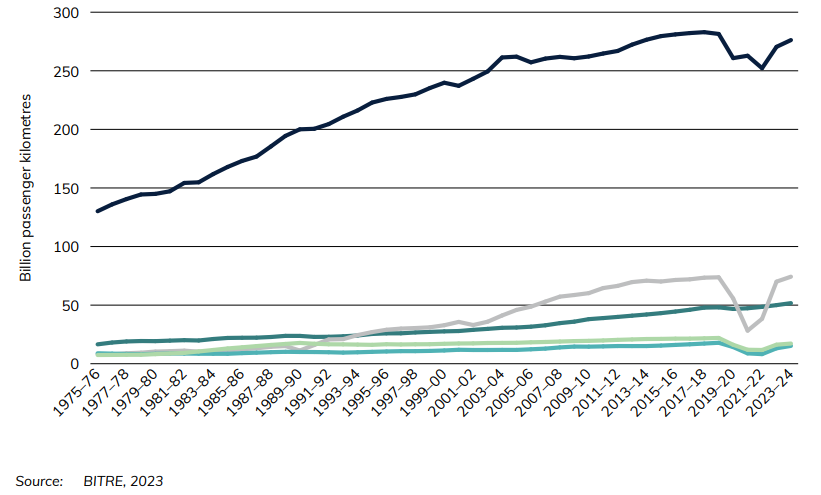
Passenger transport activity (Figure 11) is measured by passenger kilometres (the number of kilometres travelled by passenger vehicles multiplied by the number of occupants in the vehicle).
Figure 11 Total national motorised passenger travel, by transport mode
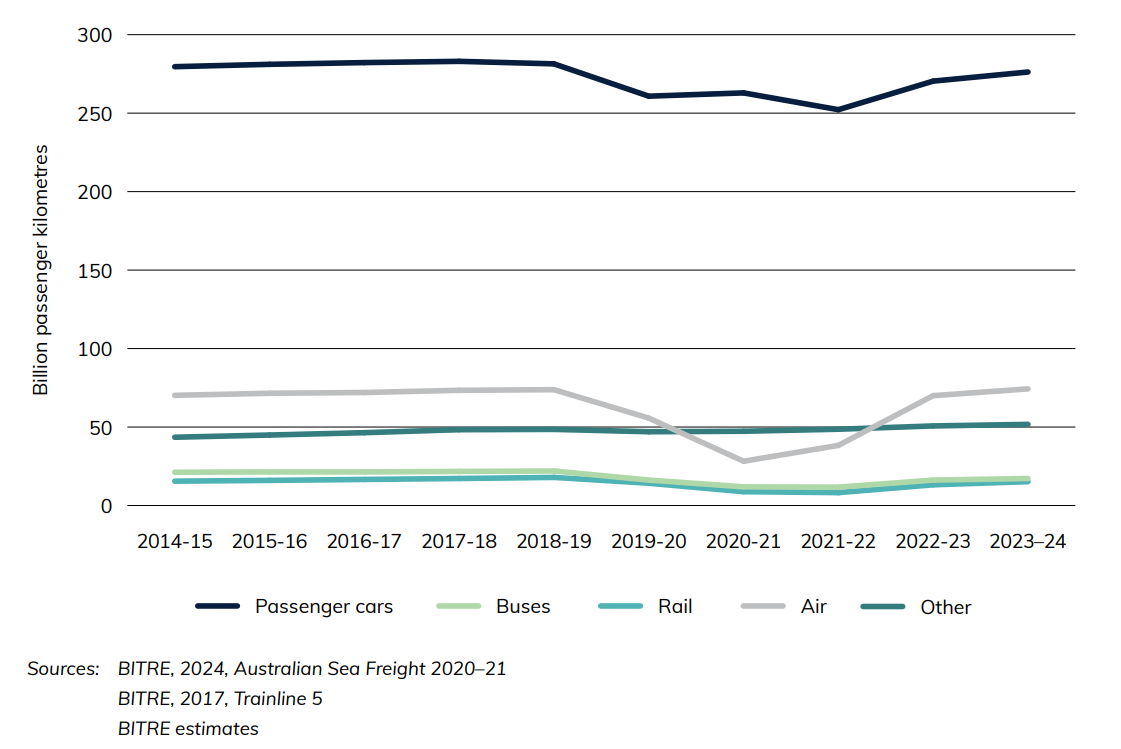
The Australian domestic passenger task is dominated by road transport, mainly passenger cars (Figure 12, right axis). Passenger travel on other modes has generally been increasing, albeit with a dip over the pandemic period. Air travel expectedly fell most significantly, however in 2023–24 it had recovered to near its pre-pandemic level.
Figure 12 Australian domestic passenger task, by mode of transport
Chapter 6
This chapter provides the following information on Australian roads: road distances, road length in kilometres, licence registration transactions over different vehicle types, electric vehicles attributes and registration transactions.
A variety of sources are used for this data, including data from the Australian Bureau of Statistics, the Department of Infrastructure, Transport, Regional Development, Communications and the Arts, Federal Chamber of Automotive Industries (FCAI), VFACTS, BITRE estimates and State and Territory Governments.
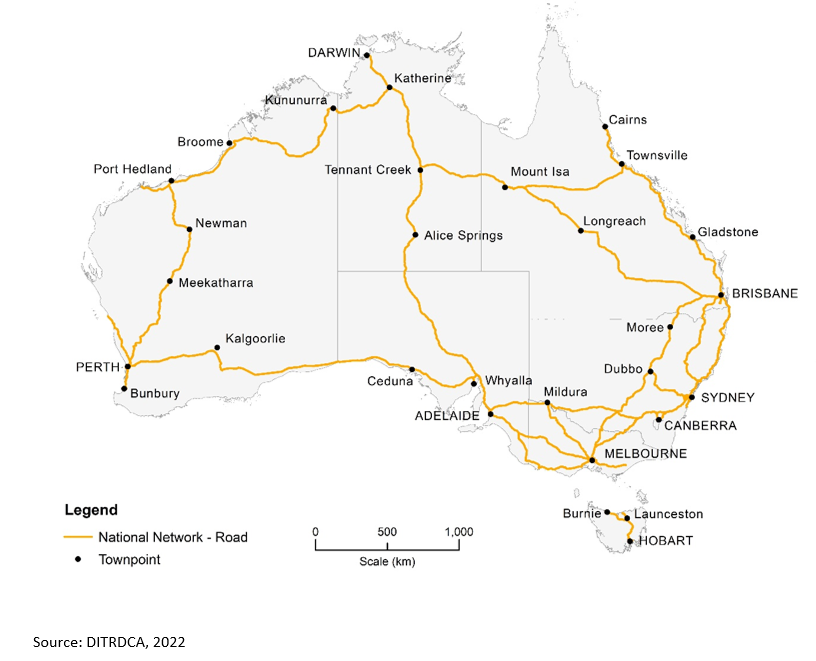
- Australia's total estimated paved road length was 463,000 kilometres in 2023.
- An estimated 260 billion vehicle kilometres were travelled on Australia's roads in 2023–24.
- In 2023–24, Sports Utility Vehicles (SUVs) comprised 56% of new motor vehicle sales (excluding motor cycles) compared with only 30% 10 years earlier.
- In 2023, there were 87 thousand fully electric vehicle sales in Australia, up from 33 thousand the previous year.
Figure 13 shows the sale of registered battery electric vehicles and Plug-in Hybrids over time. Fully battery electric vehicles sales increased by 161 per cent between 2022 and 2023.
Figure 14 shows Australia's national road network.
Figure 13 Sales of electric vehicles
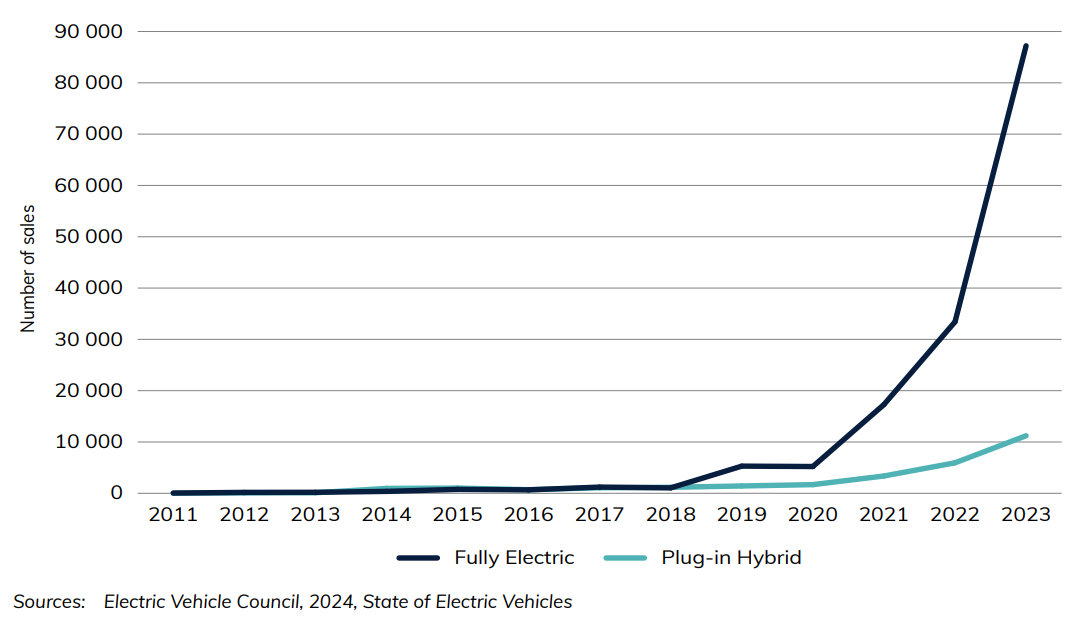
Figure 14 Map of national road network
Download data
- Road—Yearbook 2024 (XLSX 291 KB) - Download Excel file
- Australian Infrastructure and Transport Statistics—Yearbook 2024 - Download PDF
Also see
Chapter 7
Chapter 7 aims to give an understanding of Australia's rail characteristics. This chapter provides information on rail lengths, rail interstate non-bulk freight, public transit patronage on rail and rail related expenditure. The data is sourced mainly from BITRE and the Australian Bureau of Statistics.
- People in Melbourne use light rail more than any other city with 148 million passengers in 2022–23.
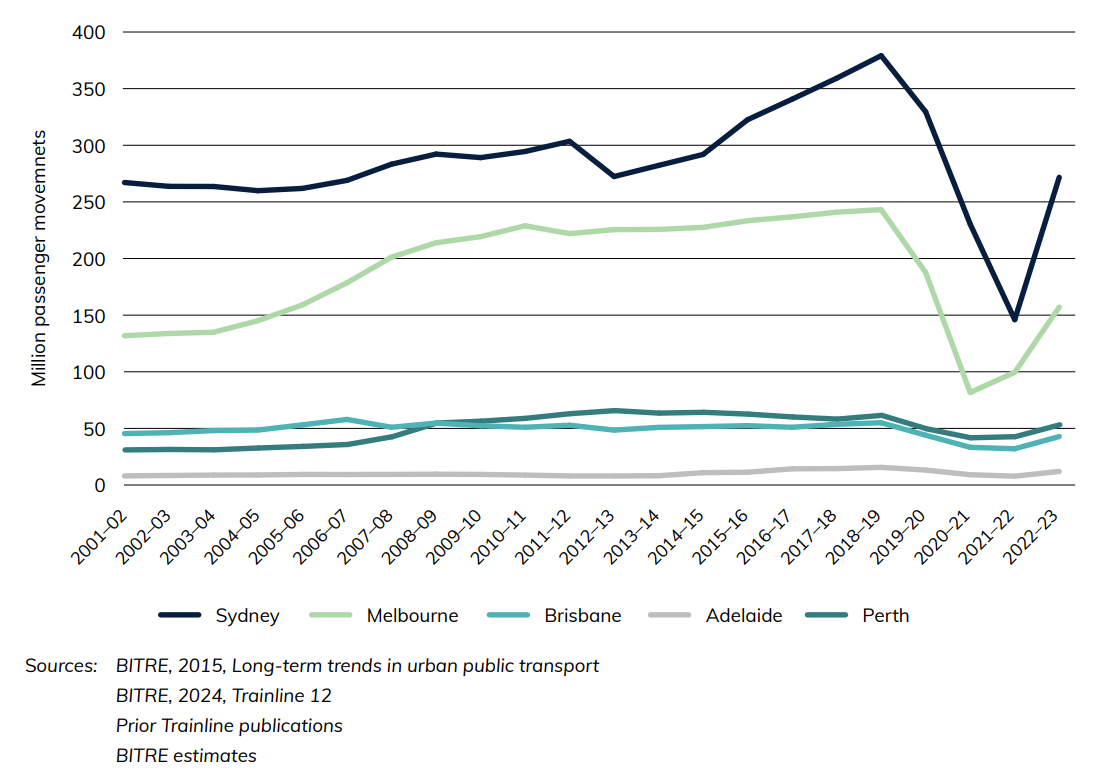
- People in Sydney use heavy rail more than any other city with 271 million passengers in 2022–23.
- In 2022–23 there were 35 billion dollars of public rail-related expenditure.
Figure 15 shows Australia's network of railways by gauge, breaking it down into different classifications. The lines shown here are the railways that were open for traffic at October 2022. The only change since 2021 was the opening of the Forrestfield-Airport Link (Metronet) line in Perth.
Figure 15 Australia's railways, by gauge
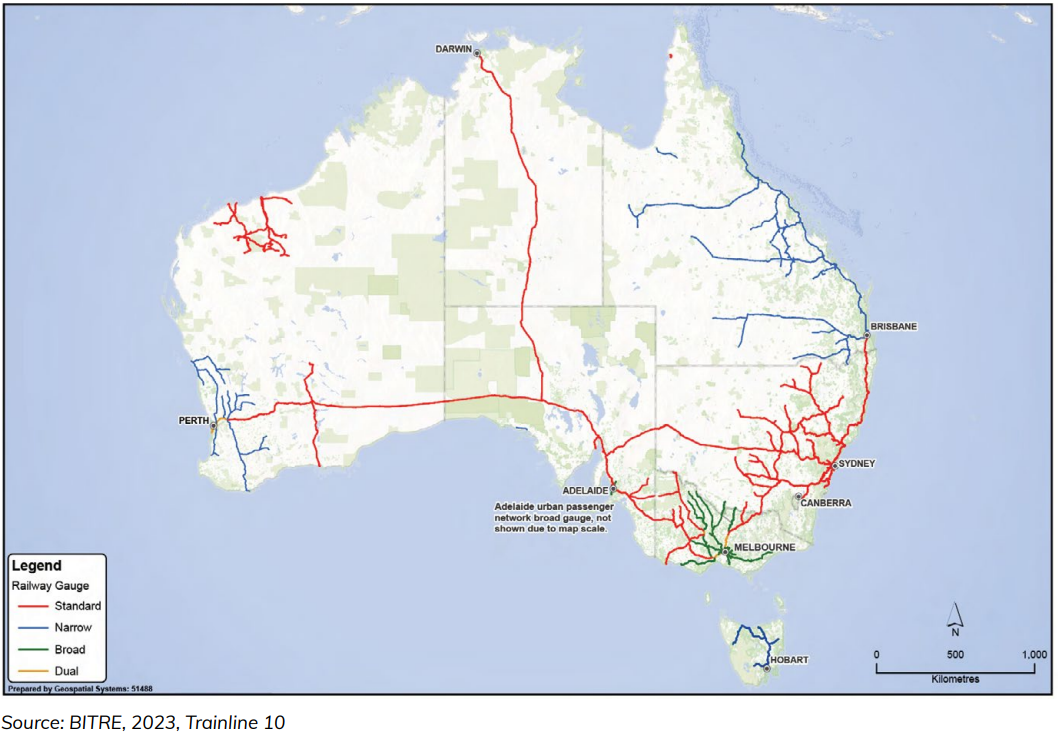
Figure 16 shows rail public transport patronage by million passenger movements. Passenger movements were trending upwards in Sydney, Melbourne, Perth and Adelaide before starting to fall sharply in 2019–20 due to the COVID-19 pandemic. While Melbourne's passenger numbers began to recover in 2021–22, Sydney's continued to decline rapidly, recording a larger proportional fall than in each of the two preceding years. This refers to all trips on suburban rail networks and is based on reporting from train operators.
Figure 16 Public transit patronage on heavy rail, Australian capital cities
Download data
- Rail—Yearbook 2024 (105 KB) - Download Excel file
- Australian Infrastructure and Transport Statistics—Yearbook 2024 - Download PDF