
Information and data on domestic aviation can be found at the following links.
- Australian domestic aviation activity—monthly publications
- Australian domestic aviation activity—time series
- Australian domestic aviation activity—annual publications
Below are graphs and summary analysis relating to domestic aviation activity.
Summary
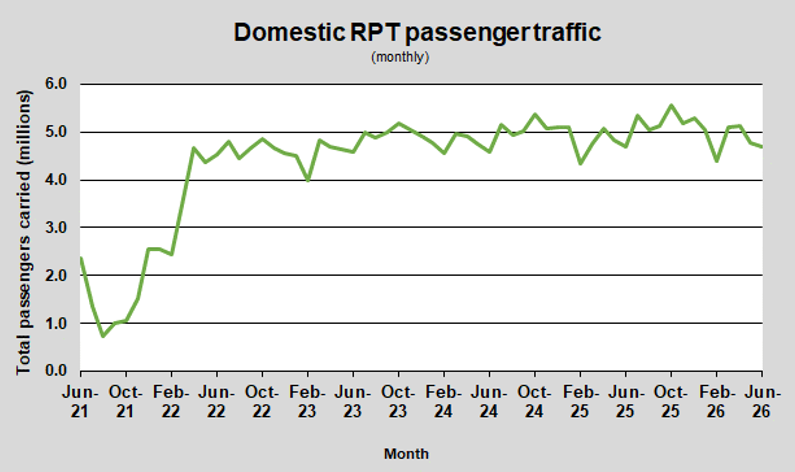
There were 5.10 million passengers carried on Australian domestic commercial aviation (including charter operations) in June 2026 compared with 5.05 million in June 2025 (up 1.0%). This is an increase of 3.7% on pre-COVID June 2019 passenger numbers (4.92 million).
4.69 million passengers were carried on Regular Public Transport (RPT) flights in June 2026 (excluding charter operations), a decrease of 0.1% compared with June 2025.
For the month of June 2026 there were 47.6 thousand RPT aircraft trips, a decrease of 2.3% on June 2025.
For the year ending June 2026 there were 60.75 million RPT passengers, an increase of 2.2% on the year ending June 2025.
RPT revenue passenger kilometres (RPKs) performed were 5.64 billion for the month, compared with 5.69 billion in June 2025 (down 0.8%).
Capacity, measured by available seat kilometres (ASKs), decreased to 6.92 billion in June 2026 compared with 7.10 billion in June 2025 (down 2.5%).
The industry-wide load factor (RPKs/ASKs) increased from 80.1% in June 2025 to 81.5% in June 2026.
Total cargo movements at Australian airports on domestic RPT flights were 27.3 thousand tonnes in June 2026, an increase of 4.3% compared with June 2025.
In June 2026 there were 2.08 million domestic passenger movements through regional airports, an increase of 0.1% from June 2025.
Fixed-wing charter operators carried 409.9 thousand passengers in June 2026, an increase of 15.8% compared with June 2025.
Summary of annual RPT activity
| YE June 2025 | YE June 2026 | % Change | |
|---|---|---|---|
| Total passengers carried (millions) | 59.46 | 60.75 | 2.2 |
| Revenue passenger kilometres (billions) | 71.62 | 73.26 | 2.3 |
| Available seats (millions) | 73.32 | 75.26 | 2.6 |
| Available seat kilometres (billions) | 86.35 | 89.08 | 3.2 |
| Load factor % | 82.9 | 82.2 | -0.7* |
| Aircraft trips (000s) | 601.0 | 602.9 | 0.3 |
* percentage point difference
Domestic airfares

BITRE's domestic airfare index monitors changes over time in the price of Australian air travel. Fares are collected monthly for the top 70 routes in the Australian domestic network.
Domestic discount airfares
Click the expand button at the bottom right of the dashboard to enter full screen mode.
Cheapest available return fares from January 2010 to latest data month.
For Graphs, Summary table and Notes see further down the page.
See here for Airfares collection methodology
Airfares time series from October 1992 to latest data month.
Graphs
Domestic airfares (Business)

Domestic airfares (Restricted Economy)

Domestic airfares (Best Discount)

Summary table
Real Domestic Airfare Index (July 2003 = 100)
| Survey Month | Best Discount | Business | Restricted Economy |
|---|---|---|---|
| Sep 2025 | 75.2 | 59.2 | 66.2 |
| Oct 2025 | 68.9 | 57.0 | 60.9 |
| Nov 2025 | 65.5 | 50.9 | 56.7 |
| Dec 2025 | 76.3 | 51.0 | 61.8 |
| Jan 2026 | 62.3 | 48.5 | 52.3 |
| Feb 2026 | 70.0 | 49.4 | 57.6 |
| Mar 2026 | 70.6 | 52.3 | 55.7 |
| Apr 2026 | 62.3 | 51.6 | 55.8 |
| May 2026 | 61.0 | 52.1 | 55.4 |
| Jun 2026 | 69.3 | 50.4 | 55.4 |
| Jul 2026 | 63.7 | 49.8 | 56.2 |
| Aug 2026 | 69.8 | 50.0 | 55.6 |
| Sep 2026 | 73.9 | 52.2 | 64.9 |
Notes
Indexes are constructed from BITRE's monthly survey of airline internet booking sites. Fares are recorded only when they are available on the nominated day of travel (the last Thursday of the month). The series is a price index of the lowest available fare in each fare class, weighted over selected routes. It does not measure real airline yields or average fares paid by passengers. For more information on methodology use the link at the top of this page.
Occasionally, the index may record an unusual result when the nominated day of travel falls on, or adjacent to, a public holiday:
- The travel date fell on a public holiday for April 2024, December 2024 and December 2025.
- The travel date fell the day before a public holiday for December 2020, January 2024, March 2024 and December 2025.
- The return travel date fell the day before a public holiday in March 2020 and March 2022.
- The travel date for April 2025 fell between 2 public holidays.
- The travel date for January 2025 fell after a public holiday
April 2021 to current—Best Discount index: During the period of "Half Off" airfares made available through Tourism Aviation Network Support (TANS), the BITRE Airfares Survey has collected the cheapest available fare—using "Half Off" fares where available.
April 2021—Restricted Economy index: Virgin Australia Restricted Economy fares on some routes were noticeably lower this month. The Virgin Australia web site notes that complimentary food would no longer be provided on Economy class fares as of 25 March 2021. It is not clear what part this change has played in the reductions to Virgin Australia's Restricted Economy fares.
Business class fares from April 2020: Fares collected may not include normal entitlements like meals and lounge access during the period impacted by COVID-19.
Index calculation for April 2020 to November 2020: There were significant reductions to airline services in April and May 2020 in particular due to the COVID-19 pandemic and valid fares were not available for many routes covered by the survey. The indexes for April to November 2020 are based on the available routes during those months compared to the same routes in the base period.
November 2017 change to Restricted Economy index: From November 2017, refunds of Jetstar's Restricted Economy products (Starter with Max) for cancellations are only available in the form of vouchers. Vouchers may only be redeemed for other Jetstar products and are therefore considered by BITRE to be closer to a transfer than a full refund. This change in Jetstar's product places it outside BITRE's definition of a restricted economy fare, which has resulted in a sharp increase in the restricted economy index for November 2017.
March 2015—the Full Economy index is discontinued: From the middle of February 2015, Qantas Airways ceased offering Full Economy fares for domestic travel. It is no longer possible to produce an index for this fare category. In the future, if Full Economy fares are offered on sufficient routes, the index for this fare category could be reinstated.
December 2011 and January 2012 changes to Business and Full Economy indexes: Both the Business and Full Economy indexes were substantially affected by changes to fare offered. In December 2011 the Business index fell substantially mainly due to reductions in many of these fares by Qantas. This index again dropped significantly in January 2012 as Virgin Australia introduced Business class fares on many more of their routes. With the expansion of Virgin Australia's Business class fares they removed their Premium Economy class fare completely. The removal of these fares resulted in the Full Economy index rising substantially in January 2012.
June 2011 change to Restricted Economy index: In June 2011 both Virgin Australia and Jetstar introduced simplified fare structures. The new fare types used in constructing the indexes are shown on the Methodology page. The major impact of this change was to the Restricted Economy index. The new Virgin Australia fares used for this category (Flexi) were substantially lower than the previously used Virgin fares (Flexible). In a competitive response Qantas also reduced its Flexi Saver fares on competing routes. These changes produced a sharp drop in the Restricted Economy index.
February 2008 change to Full Economy index: Prior to February 2008 the Full Economy Fare category was based solely on the Qantas Fully Flexible Fare. From February 2008 on the category was expanded to include Virgin Blue's Corporate Plus Fare, leading to a drop in the index at the point of changeover.
Consumer price index Source: Australian Bureau of Statistics, Catalogue No 6401.0. We acknowledge that the ABS has rebased CPI to September 2025 and this will be incorporated from the start of the 2026-27 financial year.
Summary of current report
This annual survey covers all civilian registered aircraft used in the Commercial Air Transport (CAT), general aviation and sport and recreation sectors of the Australian aviation industry.
The CAT sector is scheduled commercial air transport and non-scheduled commercial air transport operations. The general aviation sector is all other VH registered aircraft (other than commercial air transport). The sport and recreation sector includes aircraft registered with one of the following Civil Aviation Safety Authority regulated self-administration bodies:
- Recreational Aviation Australia (RA-Aus),
- Gliding Australia,
- Sports Aviation Federation of Australia (SAFA) or,
- the Australian Sport Rotorcraft Association (ASRA).
The major categories of flying are aerial work, own use business flying, instructional flying, personal and pleasure flying and other flying. In addition, the sport aviation segment includes operations by ultralight aircraft, gliders, hang gliders and gyrocopters. The survey results are merged with details from the civil aircraft register which gives access to additional relevant information including aircraft type, engine and fuel type, country and year of manufacture.
The base measure of this report is flying hours. All operators of Australian registered aircraft are asked to report the hours flown and landings across the various flying categories. The VH registered response to this year's reporting request was 70.2%.
Since 2020 aircraft registered with RA-Aus have been included in the annual Australian Aircraft Activity Report. The RA-Aus response to this year’s reporting request was 72.6%. Statistics for the remainder of the sport aviation segment are collected directly from the self-administrating associations.
Key Indicators
In 2024 the total hours flown in Australia by Australian owned and operated aircraft increased by 1.4% to 3.63 million hours.
CAT hours flown by VH registered aircraft increased by 1.5% to 1.93 million hours. Hours flown by scheduled commercial air transport increased by 4.7% to 1.44 million hours, while hours flown by non-scheduled commercial air transport decreased by 6.9% to 489,442 hours.
General aviation hours flown by VH registered aircraft increased by 2% to 1.4 million hours. Sport and pleasure flying hours decreased (down 10% to 221,665 hours), instructional flying (up 14.5% to 437,458 hours), own-use business flying (up 1.3% to 131,330 hours) and aerial work (down 1.4% to 542,419 hours).
Sport aviation (ultralights, gliders, hang gliders and gyrocopters) activity generally experiences large swings in activity from year to year. In 2024, sport aviation activity decreased 1.5 % to 328,574 hours.
Hours Flown in Australian Aircraft Activity (000's)—year end December
| Year | |||
|---|---|---|---|
| 2023 | 2024 | ||
| (thousands) | |||
| Commercial air transport | Scheduled | 1 371.6 | 1 436.2 |
| Non-scheduled | 526.0 | 489.4 | |
| Total commercial air transport | 1 897.6 | 1 925.6 | |
| General aviation (VH)* | Aerial work | 550.4 | 542.4 |
| Own-use business | 129.6 | 131.3 | |
| Instructional flying | 381.9 | 437.5 | |
| Sport and pleasure flying | 246.0 | 221.7 | |
| Other flying | 41.9 | 43.5 | |
| Total general aviation (VH) | 1 349.9 | 1 376.4 | |
| Sport aviation (non-VH) | 333.6 | 328.6 | |
| Total hours flown | 3 581.1 | 3 630.6 | |
*VH aircraft are registered with CASA
*non-VH aircraft are registered with self-administrating associations
Airline on-time performance statistics—monthly summary
- Airline on-time performance—monthly reports and time series data
- Airline on-time performance—annual reports (financial and calendar years)
Summary—August 2026
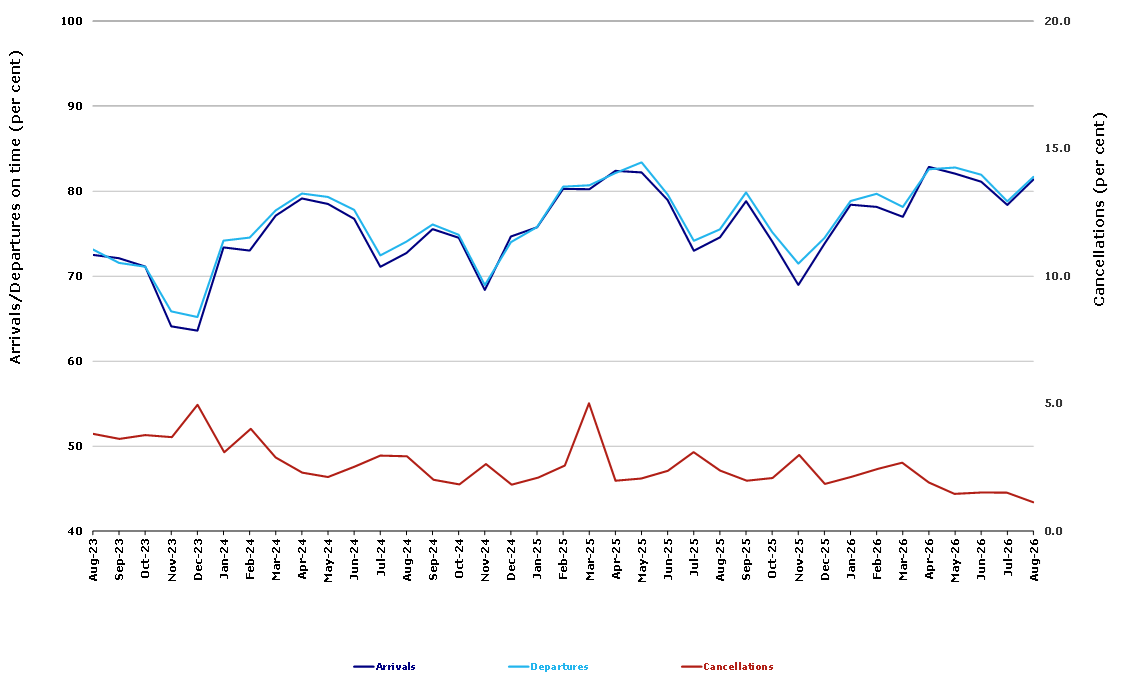
For August 2026, on-time performance over all routes operated by participating airlines (Hinterland, Jetstar, Qantas, QantasLink, Rex Airlines, Skytrans Australia, Virgin Australia and Virgin Australia Regional Airlines) averaged 81.4% for on-time arrivals and 81.7% for on-time departures. The cancellation rate for the month was 1.1%. The equivalent figures for August 2025 were 74.6 % for on-time arrivals, 75.5% for on-time departures and 2.4% for cancellations.
This month’s on-time arrivals figure was higher than the long-term average (averaged over the period of OTP reporting starting in November 2003) performance for all routes (80.5%) and the on-time departures figure was also higher than the long-term average (81.6%). The rate of cancellations was higher than the long-term average of 2.2%.
On-time arrivals
The Qantas network (Qantas and QantasLink combined operations) recorded 83.6% for on-time arrivals while the Virgin Australia network (Virgin Australia and Virgin Australia Regional Airlines combined operations) recorded 81.1%. Hinterland achieved the highest on-time arrivals at 95.0%, followed by QantasLink at 83.7%, Qantas at 83.5%, Virgin Australia at 81.2%, Jetstar at 76.7%, Rex Airlines at 75.8%, Virgin Australia Regional Airlines at 74.7% and Skytrans at 73.1%.
On-time departures
The Qantas network recorded 83.9% for on-time departures while the Virgin Australia network recorded 81.7%. Hinterland achieved the highest level of on-time departures for August 2026 at 97.5%, followed by Qantas at 85.9%, QantasLink at 82.8%, Virgin Australia at 81.8%, Rex Airlines at 78.5%, Virgin Australia Regional Airlines at 77.0%, Jetstar at 74.6% and Skytrans Australia at 74.3%.
Cancellations
Skytrans Australia recorded the highest percentage of cancellations at 4.1% during the month. The second highest cancellation rate was from Rex Airlines at 1.9%, QantasLink at 1.7%, Virgin Australia at 0.9%, Qantas at 0.8%, Jetstar at 0.5% and Hinterland and Virgin Australia Regional Airlines both at 0.0%.
Routes
Airlines’ on-time performance varies across the routes they serve. Individual route data by specific airline for 59 routes (118 sectors when counting both directions of flights) are shown on pages 10-21.
Of the 59 routes which met the criteria for on-time performance reporting in August 2026, the Melbourne-Ayers Rock sector had the highest percentage of on-time arrivals (100.0%), while the Perth-Adelaide sector had the highest percentage of on-time departures (94.2%). The Hamilton Island-Sydney sector had the lowest percentage of on-time arrivals (51.7%) and the lowest percentage of on-time departures (48.3%).
Cancellations were highest on the Orange-Sydney sector at 8.7%, followed by the Sydney-Orange sector at 8.5%, the Port Lincoln-Adelaide sector at 5.1%, the Adelaide-Port Lincoln sector at 4.3%, the Canberra-Melbourne sector at 3.8% and the Port Macquarie-Sydney sector at 3.4%.
For the month of August 2026 35 of the 118 route sectors (from the 59 routes) had zero cancellations: Adelaide-Alice Springs, Adelaide-Gold Coast, Alice Springs-Adelaide, Brisbane-Darwin, Brisbane-Hamilton Island, Brisbane-Hobart, Brisbane-Launceston, Brisbane-Mount Isa, Brisbane-Perth, Brisbane-Proserpine, Brisbane-Rockhampton, Cairns-Melbourne, Canberra-Gold Coast, Darwin-Melbourne, Darwin-Perth, Gold Coast-Adelaide, Gold Coast-Canberra, Hamilton Island-Brisbane, Hamilton Island-Sydney, Launceston-Brisbane, Launceston-Sydney, Melbourne-Cairns, Melbourne-Darwin, Melbourne-Sunshine Coast, Mount Isa-Brisbane, Newman-Perth, Perth-Broome, Perth-Darwin, Perth-Newman, Proserpine-Brisbane, Sunshine Coast-Melbourne, Sydney-Hamilton Island, Sydney-Launceston, Ayers Rock-Melbourne and Melbourne-Ayers Rock.
Airports
Ayers Rock Airport recorded the highest percentage of on-time arrivals (100.0%) while Emerald Airport had the highest percentage of on-time departures (93.4%). Port Macquarie Airport recorded the lowest percentage of on-time arrivals (62.9%) while Hamilton Island Airport had the lowest percentage of on-time departures (49.2%). These figures only refer to reported routes and do not cover all flights at these airports.
Table 1: Total industry on-time performance for August 2026
| Reporting Airlines | Sectors Scheduled | Arrivals on-time % | Departures on-time % | Cancellations % |
|---|---|---|---|---|
| Hinterland | 1,614 | 95.0 | 97.5 | 0.0 |
| Jetstar | 7,347 | 76.7 | 74.6 | 0.5 |
| Qantas - all QF designated services | 19,480 | 83.6 | 83.9 | 1.4 |
| Rex Airlines | 4,330 | 75.8 | 78.5 | 1.9 |
| Skytrans Australia | 341 | 73.1 | 74.3 | 4.1 |
| Virgin Australia - all VA designated services | 11,197 | 81.1 | 81.7 | 0.9 |
| All Airlines | 44,309 | 81.4 | 81.7 | 1.1 |
| Individual operating entities | ||||
| Qantas | 6,959 | 83.5 | 85.9 | 0.8 |
| QantasLink | 12,521 | 83.7 | 82.8 | 1.7 |
| Virgin Australia | 11,023 | 81.2 | 81.8 | 0.9 |
| Virgin Australia Regional Airlines | 174 | 74.7 | 77.0 | 0.0 |
Figure 1: Total industry on-time performance by month from August 2023
Airline on-time performance—2025 calendar year
- Airline on-time performance—annual reports
- Airline on-time performance—monthly reports and time series data
Summary – 2025 Calendar Year
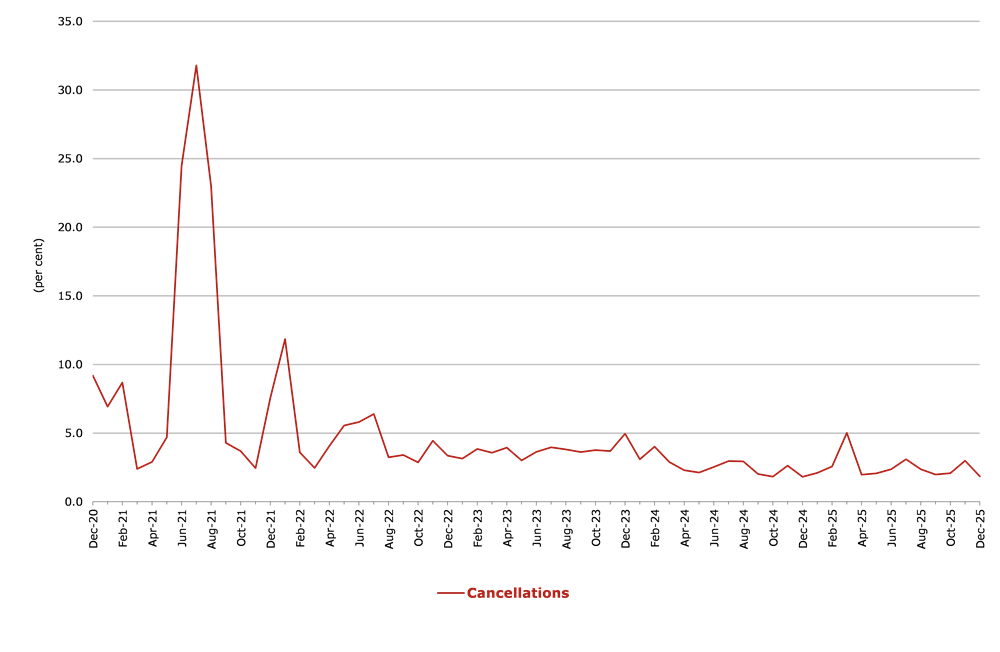
For the year ended December 2025, on time performance (OTP) over all routes operated by participating airlines (Hinterland, Jetstar, Qantas, QantasLink, Rex Airlines, Skytrans Australia (formerly Smartlynx Australia), Virgin Australia and Virgin Australia Regional Airlines) averaged 76.9 per cent for on time arrivals and 77.7 per cent for on time departures. The cancellation rate for the year was 2.5 per cent. The equivalent figures for 2024 were 74.6 per cent for on time arrivals, 75.4 per cent for on time departures and 2.6 per cent for cancellations. Airlines’ on time performance varies across the routes they serve. Individual route data by specific airline for 60 routes which operated for at least part of the 2025 calendar year are shown on pages 9-21.
The 2025 on time arrivals figure was lower than the long-term average (average over the period of OTP reporting starting in November 2003) performance for all routes (80.5 per cent) and the on time departures figure was also lower than the long-term average (81.6 per cent). The rate of cancellations was higher than the long-term average of 2.2 per cent.
On time arrivals
The Qantas network (Qantas and QantasLink combined operations) recorded 77.9 per cent for on time arrivals while the Virgin Australia network (Virgin Australia and Virgin Australia Regional Airlines combined operations) recorded 76.0 per cent. Hinterland achieved the highest on time arrivals at 88.4 per cent, followed by Skytrans Australia at 85.1 per cent, QantasLink at 78.3 per cent, Qantas at 77.2 per cent, Virgin Australia at 76.0 per cent, Jetstar at 75.2 per cent, Rex Airlines at 73.0 per cent and Virgin Australia Regional Airlines at 71.5 per cent.
On time departures
The Qantas network recorded 78.8 per cent for on time departures while the Virgin Australia network recorded 77.0 per cent. Hinterland achieved the highest level of on time departures for 2025 at 92.5 per cent, followed by Skytrans Australia at 86.3 per cent, Qantas at 79.7 per cent, QantasLink at 78.3 per cent, Virgin Australia at 77.2 per cent, Rex Airlines at 76.0 per cent, Jetstar at 73.6 per cent and Virgin Australia Regional Airlines at 67.6 per cent.
Cancellations
Skytrans Australia recorded the highest percentage of cancellations at 8.4 per cent during the year. The second highest cancellation rate was from QantasLink at 3.6 per cent, followed by Qantas at 2.7 per cent, Rex Airlines at 2.5 per cent, Jetstar at 2.2 per cent, Virgin Australia at 1.7 per cent, Virgin Australia Regional Airlines at 1.1 per cent and Hinterland at 0.8 per cent.
Routes
Of the 60 routes which met the criteria for OTP reporting, the Townsville-Cairns route (Jan 2025 only) had the highest percentage of on time arrivals (90.9 per cent) and the highest percentage of on time departures (90.9 per cent). For those routes reporting for the entirety of 2025, Emerald-Brisbane had the highest percentage of on time arrivals (89.8 per cent) and the highest percentage of on time departures (88.4 per cent). The Hamilton Island-Sydney route had the lowest percentage of on time arrivals (60.8 per cent) and the lowest percentage of on time departures (61.6 per cent).
Cancellations were highest on the Canberra-Sydney route at 6.2 per cent, followed by the Sydney-Canberra route at 5.6 per cent, the Port Lincoln-Adelaide and Sydney-Melbourne routes at 4.4 per cent, the Port Macquarie-Sydney and Melbourne-Sydney routes at 4.3 per cent, the Adelaide-Port Lincoln and Gladstone-Brisbane routes at 4.1 per cent, the Sydney-Port Macquarie route at 4.0 per cent and the Devonport-Melbourne route at 3.9 per cent.
Cancellations were lowest on the Melbourne-Ayers Rock at 0.0 per cent, followed by the Sydney-Hamilton Island route at 0.1 per cent, Ayers Rock-Melbourne and Sydney-Cairns routes at 0.3 per cent, and the Perth-Newman and Melbourne-Sunshine Coast routes at 0.4 per cent.
Airports
Of the airports with OTP reporting for 2025, Emerald Airport recorded the highest percentage of on time arrivals (86.2 per cent) and the highest percentage of on time departures (88.4 per cent). Port Macquarie Airport recorded the lowest percentage of on time arrivals (70.0 per cent) and Broome Airport recorded the lowest percentage of on time departures (64.8 per cent). These figures only refer to reported routes and do not cover all flights at these airports.
Table 1: Total industry on-time performance for 2025
| Reporting Airlines | Sectors Scheduled | Arrivals On Time % | Departures On Time % | Cancellations % |
|---|---|---|---|---|
| Hinterland | 18,415 | 88.4 | 92.5 | 0.8 |
| Jetstar | 96,686 | 75.2 | 73.6 | 2.2 |
| Qantas - all QF designated services | 231,962 | 77.9 | 78.8 | 3.2 |
| Rex Airlines | 52,716 | 73.0 | 76.0 | 2.5 |
| Skytrans Australia (formerly SmartLynx Australia) | 6,191 | 85.1 | 86.3 | 8.4 |
| Virgin Australia - all VA designated services | 145,379 | 76.0 | 77.0 | 1.7 |
| All Airlines | 551,349 | 76.9 | 77.7 | 2.5 |
| Individual operating entities | ||||
| Qantas | 88,886 | 77.2 | 79.7 | 2.7 |
| QantasLink | 143,076 | 78.3 | 78.3 | 3.6 |
| Virgin Australia | 143,031 | 76.0 | 77.2 | 1.7 |
| Virgin Australia Regional Airlines | 2,348 | 71.5 | 67.6 | 1.1 |
Figure 1. Total Industry Arrivals and Departures On Time by month from December 2020
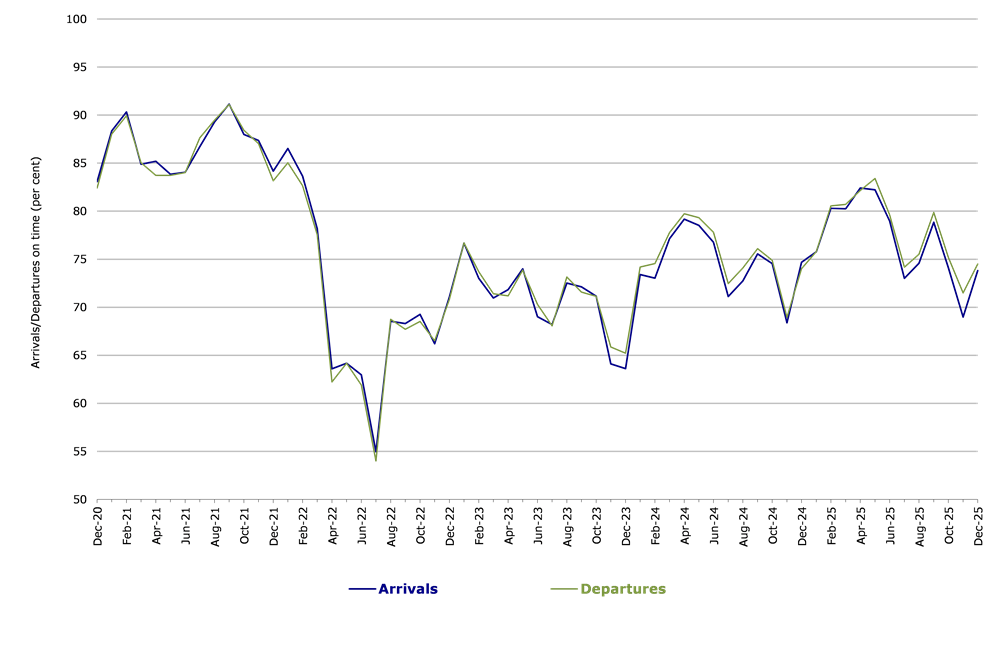
Figure 2. Total Industry Cancellations by month from December 2020
Tasmanian Freight Equalisation Scheme Monitoring Reports
The Tasmanian Freight Equalisation Scheme (TFES) provides financial assistance for cost incurred by shippers of eligible non-bulk goods moved by sea across the Bass Strait. More information about the operation of the Scheme can be found at Tasmanian Freight Equalisation Scheme | Department of Infrastructure, Transport, Regional Development, Communications and the Arts.
Under the TFES Ministerial Directions, BITRE provides a statistical report on all components of the Scheme every four years. The Monitoring Reports and other reports related to the scheme are linked below.
Monitoring Reports
- Tasmanian Freight Equalisation Scheme Monitoring Report 2024
- Consultation Draft Tasmanian Freight Equalisation Scheme Monitoring Report 2024
- Monitoring report 2020 Tasmanian Freight Equalisation Scheme
Other Reports
- Tasmanian Freight Equalisation Scheme - Review of the expanded component: Final Report (2018)
- Tasmanian Freight Equalisation Scheme: A 'Landbridge' Approach to the Estimation of Subsidy Rates (1981)
- Tasmanian Freight Equalisation Scheme: Recommended Rates of Assistance for Southbound Cargoes, Livestock and Timber at 31 January 1979
- Tasmanian Freight Equalisation Scheme: Recommended Northbound Assistance Rates at 1 January 1978
- Tasmanian Freight Equalisation Scheme: Discussion Paper September 1996
Tasmanian Freight Schemes Parameter Reviews
Australian Infrastructure and Transport Statistics Yearbook 2025: Freight chapter
Chapter 1: Freight

- Australian Infrastructure and Transport Statistics Yearbook 2025 - Download full report PDF
- Freight—Yearbook 2025 (128 KB) - Download Excel file
Freight transport activity (Figures 1 and 2) is measured in terms of tonne kilometres (the number of tonnes moved by a vehicle multiplied by the distance the load travelled in kilometres). The Australian domestic freight task has experienced strong growth over the last 40 years, with road and rail freight now dominating domestic freight activity.
During the COVID-19 pandemic, the total bulk and non-bulk freight task fell slightly, from 780 billion tonne kilometres in 2018–19 to 760 billion tonne kilometres in 2020–21. It has grown over the last three years and is estimated to have reached its highest point in 2024–25 at 786 billion tonne kilometres.
- Melbourne had the most metropolitan road freight estimated at 18.2 billion tonne kilometres in 2024–25.
- NSW’s estimated road freight for 2024–25 was the highest on record at 87.6 billion tonne kilometres.
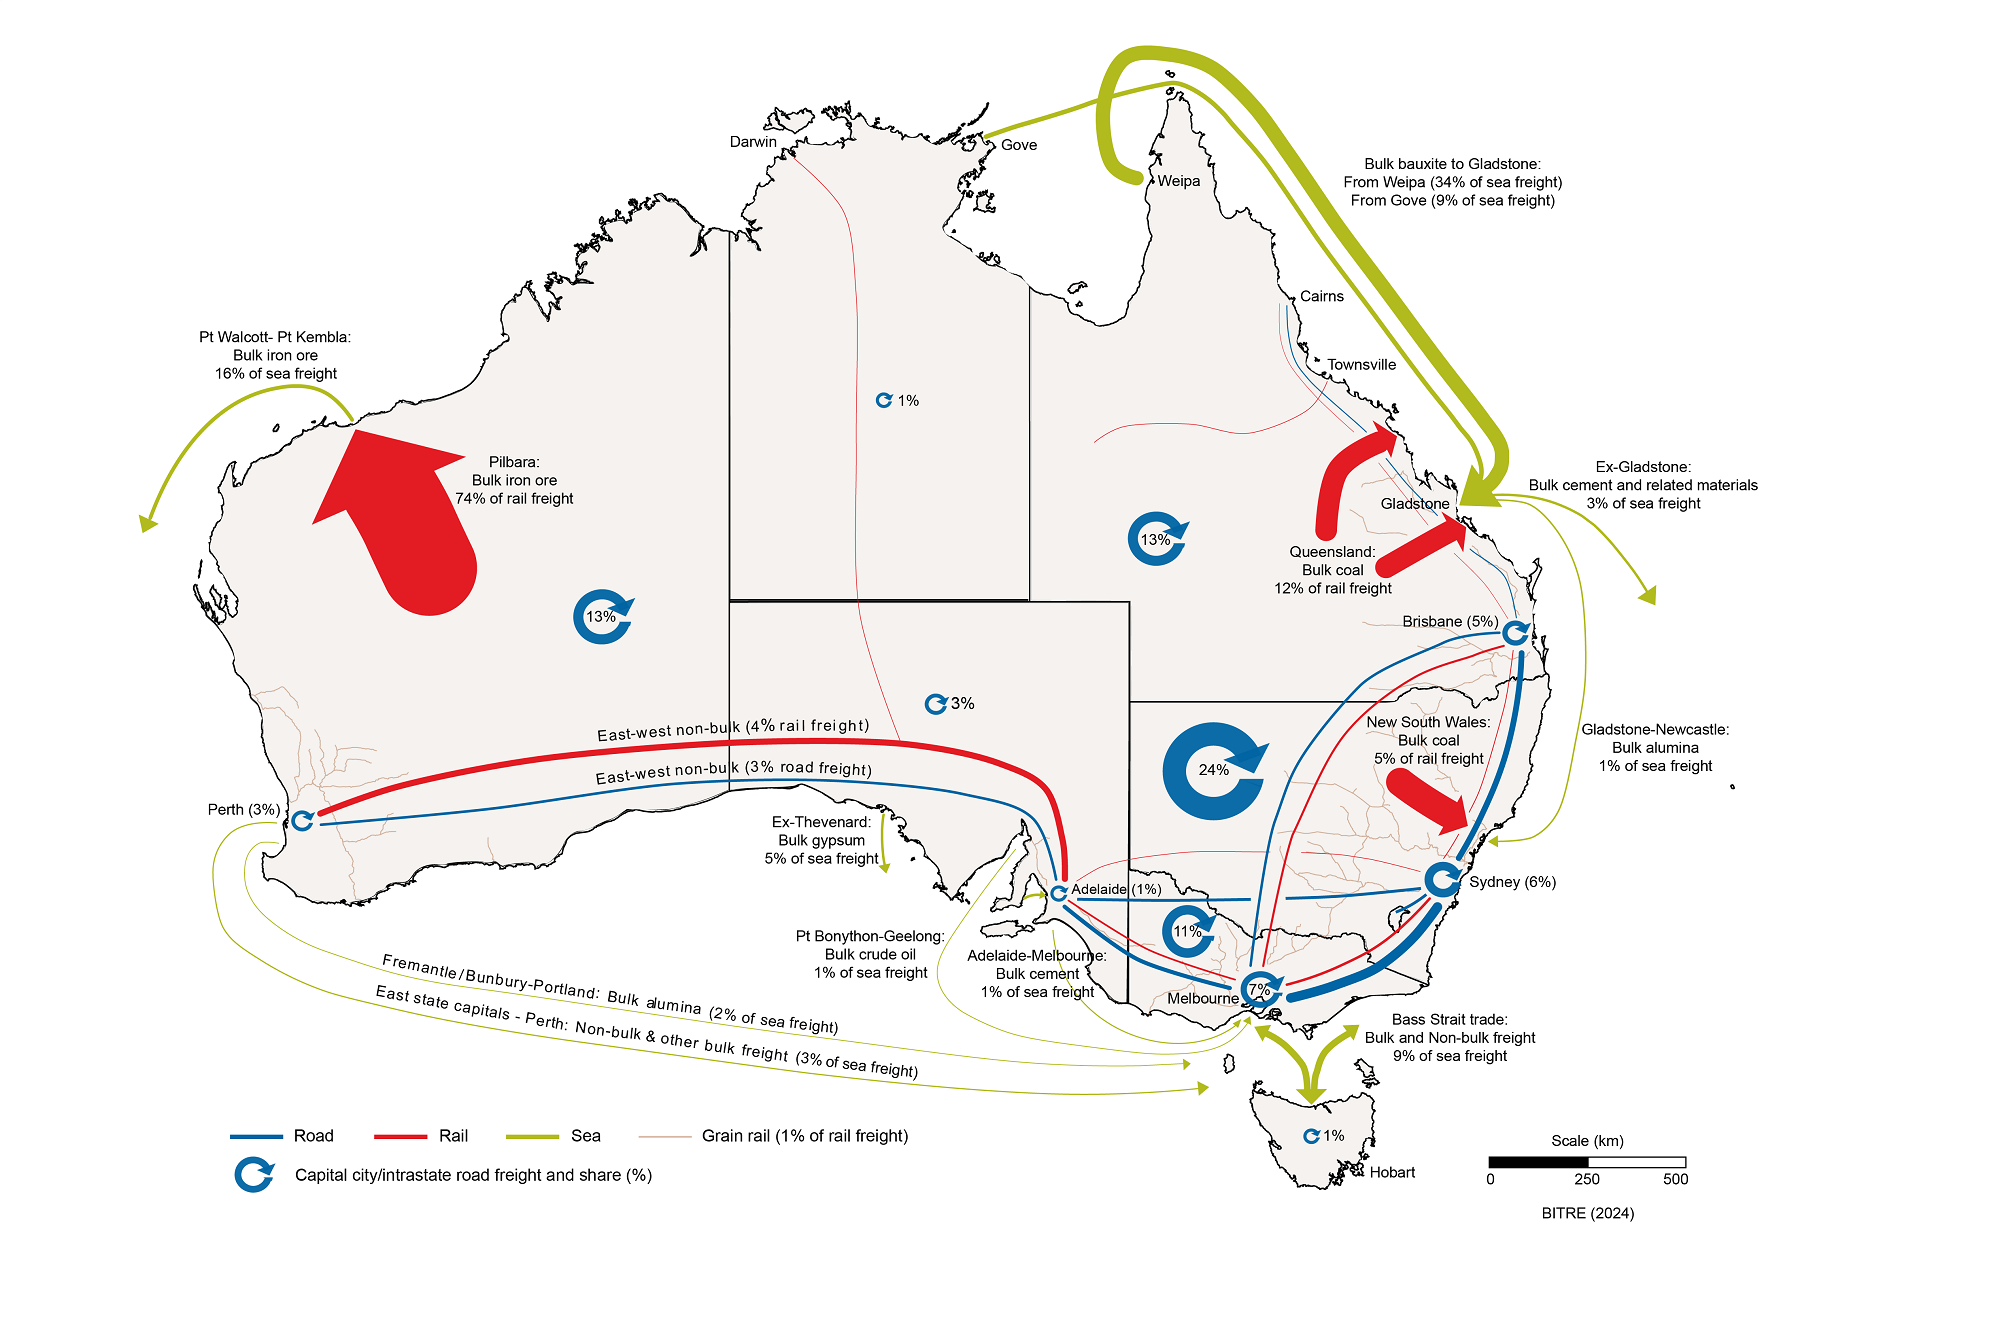
Figure 1 shows a map of Australia's major domestic freight flows by transport mode (based on 2023–24 figures). Line and arrow thickness indicate the volume of freight carried on each route, not the value of freight or performance of supply chains. The map shows that the highest volume domestic freight route is iron ore transported by rail in the Pilbara region. This next largest individual flow is coal carried by rail in Central Queensland and the Hunter Valley, followed by bauxite shipped from Weipa and Gove to Gladstone.
Figure 1 Australian Freight Flows Map
Sources:
ABARES (2024), Agricultural Commodity Statistics, March 2024, ABARES, Canberra.
ABS (2002), Freight Movements, Australia, Summary, Mar 2001 (Reissue), Catalogue no. 9220.0, ABS, Canberra.
ABS (2015), Freight Movements Australia, 12 Months ended 31 October 2014, Catalogue no. 9223.0, ABS, Canberra.
BITRE (2022), Australia interstate, intrastate and capital city road freight forecasts - 2022 update, Research Report 155, BITRE, Canberra.
BITRE (2023), Australian Infrastructure and Transport Statistics Yearbook 2023, BITRE, Canberra.
BITRE (2024), BITRE estimates, BITRE, Canberra.
BITRE, Australian Sea Freight 2023–24, Statistical Report, BITRE, Canberra ACT.
DISER (2024), Resources and Energy Quarterly, December 2023, Office of the Chief Economist, Department of Industry, Science and Resources, Canberra.
DITRDCA (2024), Coastal Trading Licensing System (unpublished data), Canberra ACT.
NFDH (2024), Freight Train Movement Data from ARTC, National Freight Data Hub, Canberra.
Qld DoR (2024), Coal production data, September 2023, Queensland Department of Resources, Brisbane.
Figure 2 illustrates Australian domestic freight activity by transport mode from 1974–75 to 2024–25. The chart indicates that rail and road account for the majority of domestic freight movement. In 2024–25, rail transported approximately 447 billion tonne kilometres of freight, while road accounted for approximately 253 billion tonne kilometres.
Figure 2 Australian domestic freight task, by mode of transport
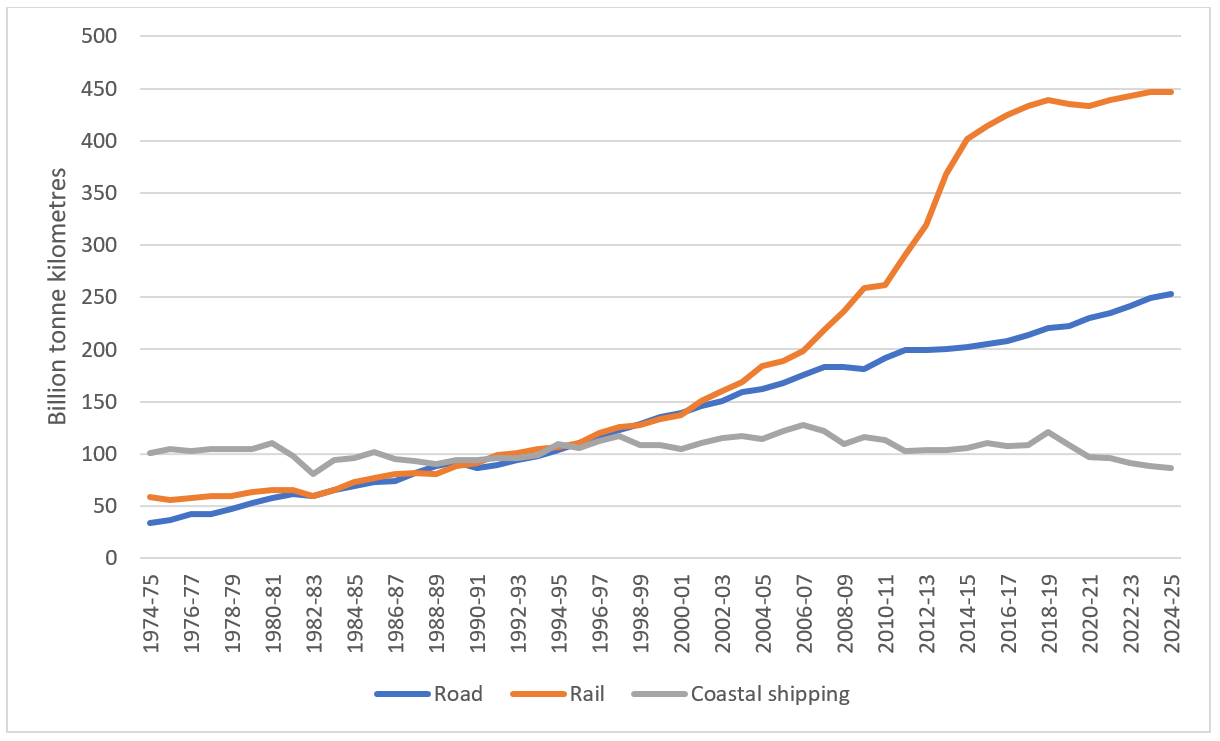
Source: BITRE Estimates
Australian Infrastructure and Transport Statistics Yearbook 2025: Shipping chapter
Chapter 7: Shipping
- Australian Infrastructure and Transport Statistics Yearbook 2025 - Download PDF
- Shipping—Yearbook 2025 (124 KB) - Download Excel file
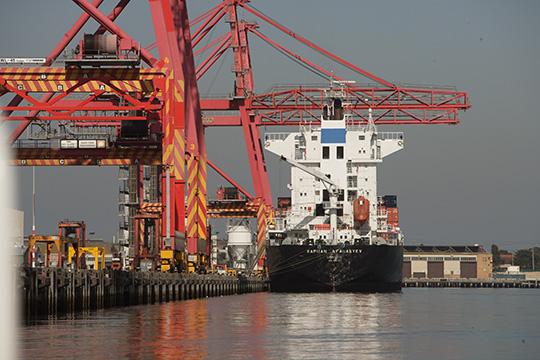
This chapter provides information on Australian ships, cargo, ports and fleet, including mileage, tonnage and number of vessels. The data is sourced from BITRE’s Australian Sea Freight publication, BITRE’s Waterline publication and BITRE estimates based on Lloyd's List Intelligence data.
- 9.1 million TEUs (twenty-foot equivalent units) were exchanged at container terminals in Brisbane, Sydney, Melbourne, Fremantle, and Adelaide in 2024–25.
- 32,142 port calls were made to Australian ports in 2024–25. The states with the highest number were Western Australia with 9,580 and Queensland with 8,244.
- 5,841 different cargo vessels visited Australian ports in 2024–25.
- There were 53 Australian registered vessels in the Australian trading fleet, including small vessels, and 83 overseas registered vessels in 2022–23.
Figure 14 Principal Australian ports, by commodity
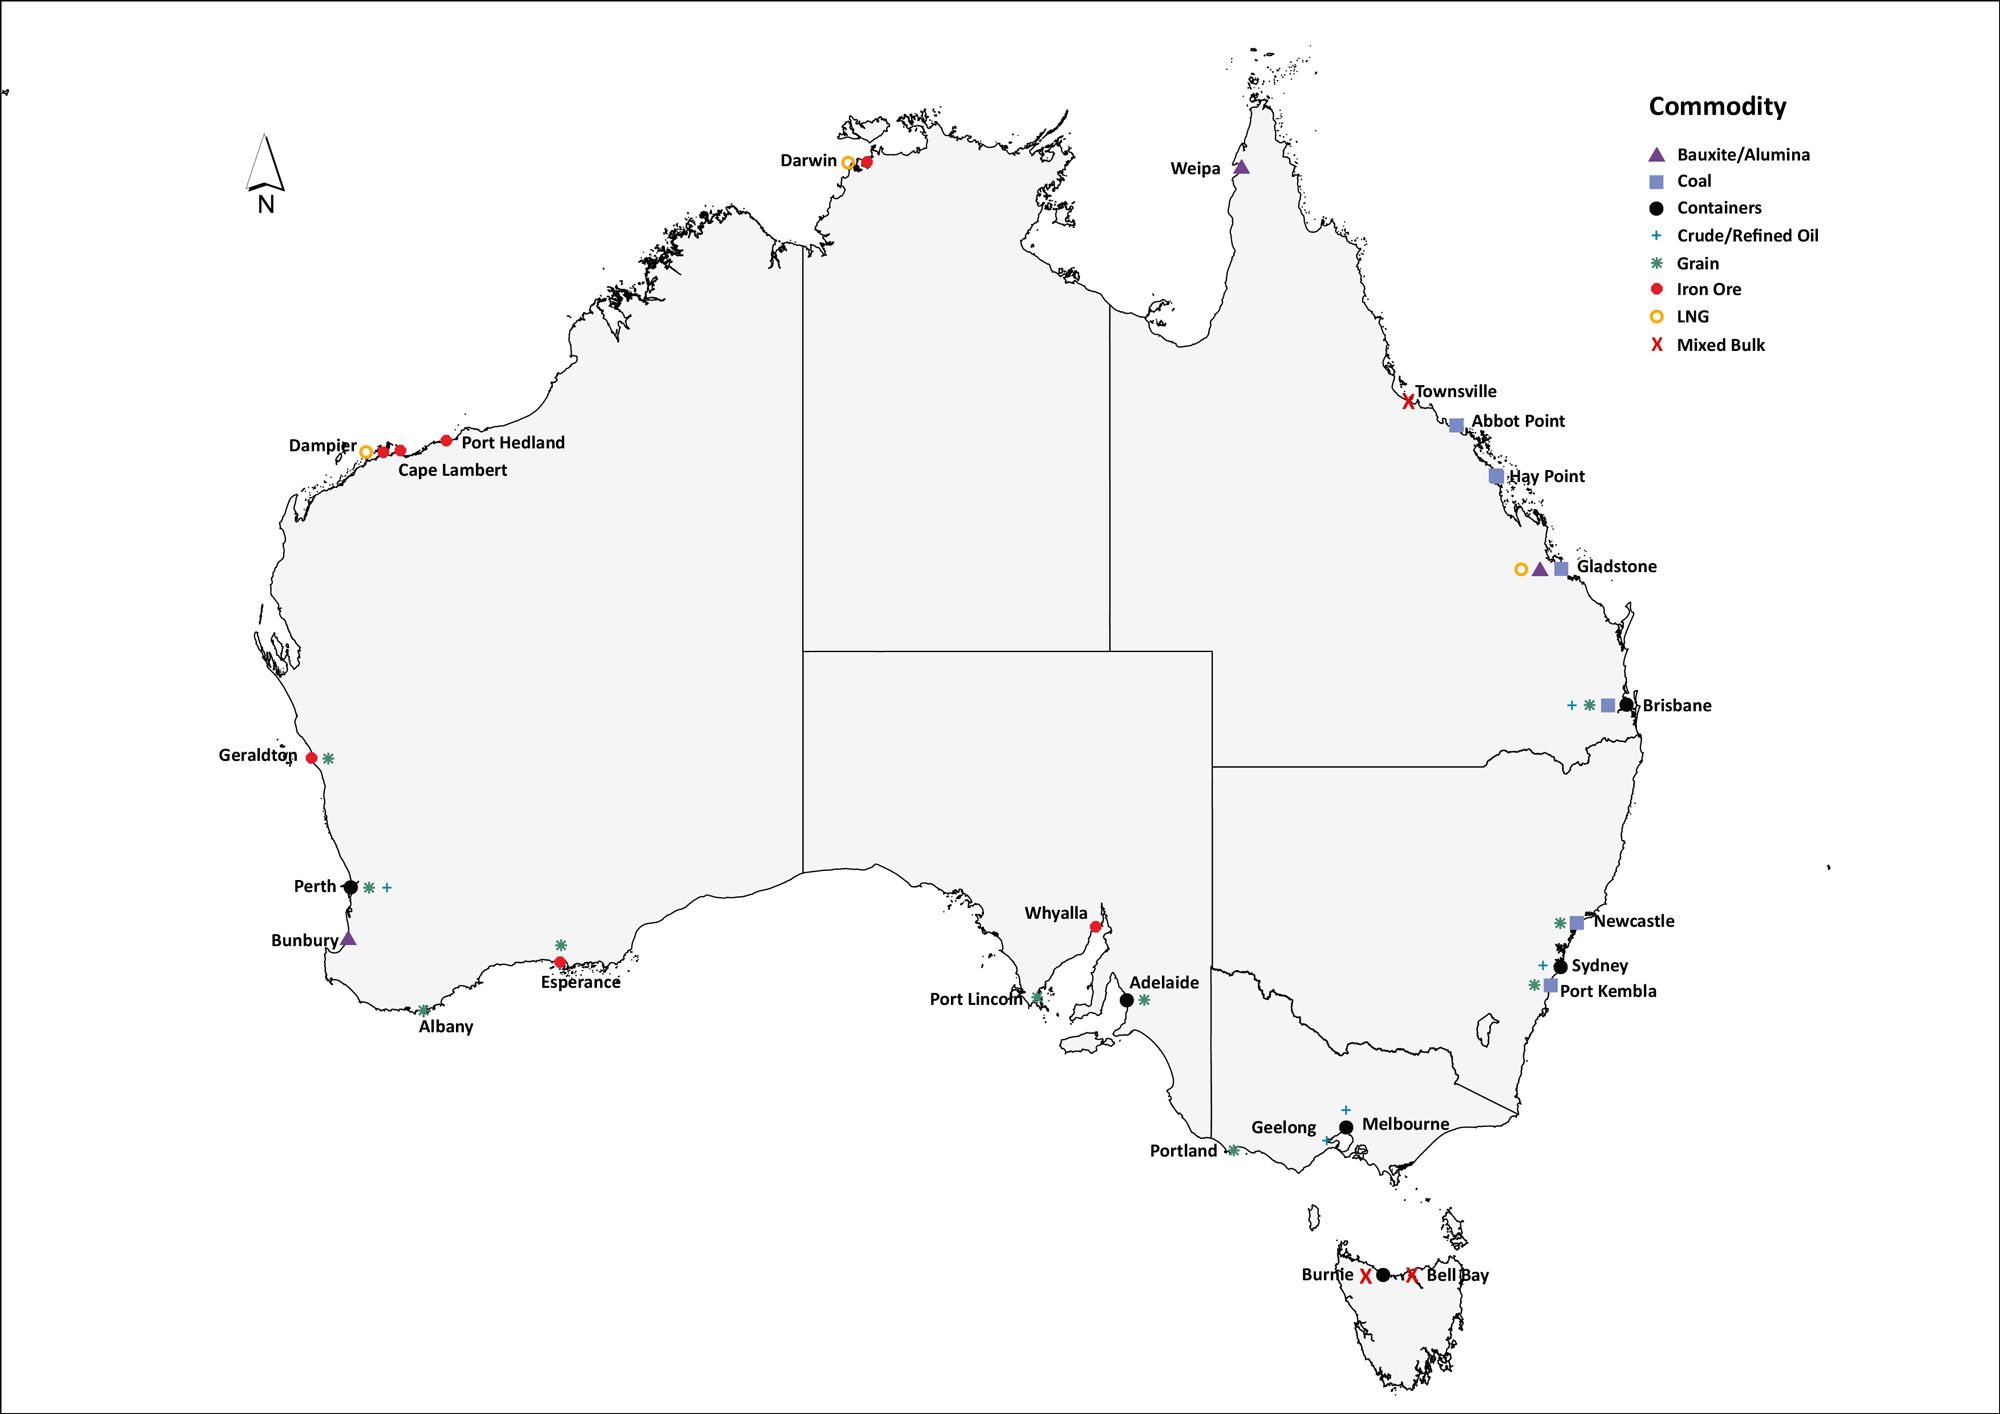
Figure 15 shows the number of port calls by state from 1999-00 to 2024-25. Queensland and Western Australia saw the largest increases and were consistently Australia’s two most visited states by cargo ships.
Figure 15 Number of port calls by state/territory
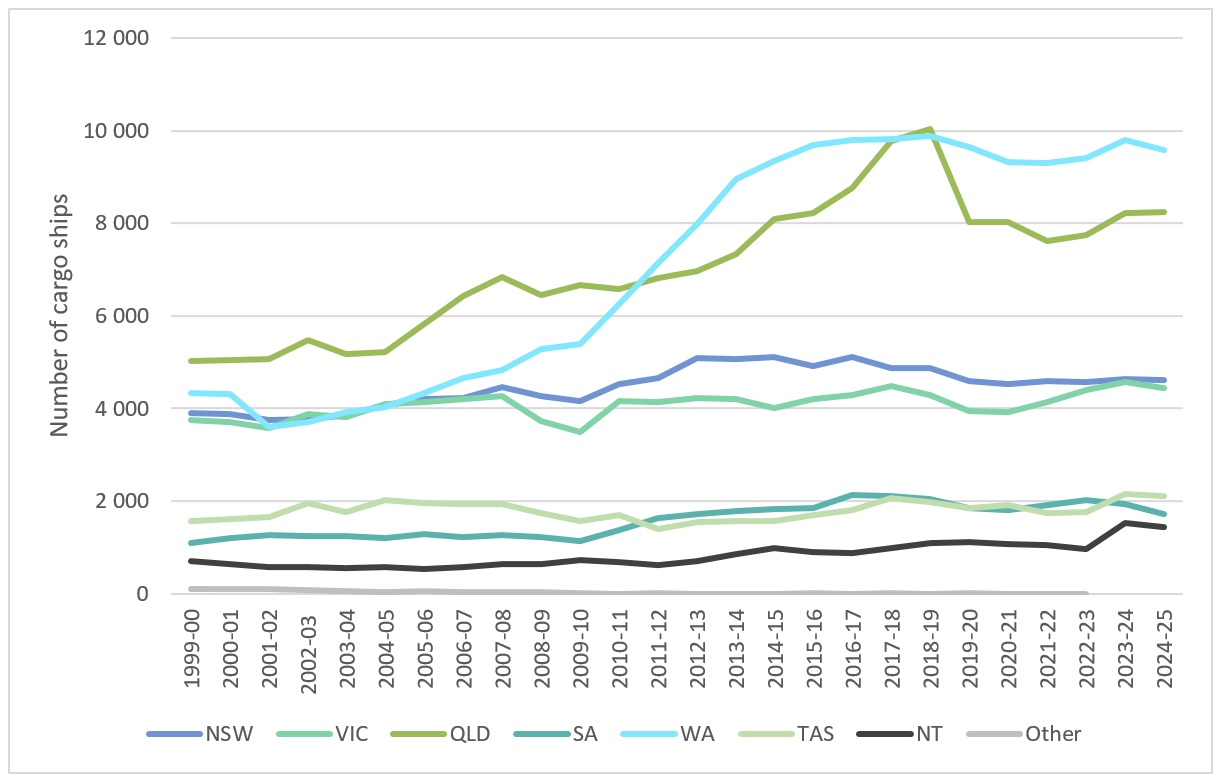
Note: “Other” includes state/territory not clearly specified in the source data.
Data may change slightly from year to year due to revisions to historical data. Ships that have made only port calls in the financial year where the target port equals the previous recorded port are excluded.
Source: BITRE estimates based on Lloyd’s List Intelligence data
Forecasting uptake of driver assistance technologies in Australia
This report uses an established modelling framework for forecasting the uptake of technologies that assist drivers and full vehicle automation in Australian light vehicles. Taking uncertainties into consideration, the report provides sensitivity analysis, based on several assumptions, to estimate the possible uptake of sales and fleet penetration till 2070. BITRE will maintain a watch on automated vehicles (AVs) as they are deployed and use the modelling framework to update its estimates when new information to inform forecasts becomes available.
- Forecasting uptake of driver assistance technologies in Australia [PDF: 7029 KB]
Measuring infrastructure asset performance and customer satisfaction: A review of existing frameworks

Well-managed, modern and functioning infrastructure underpins much of the economic prosperity of Australia. It is thus crucial that Australia's infrastructure keeps up with the needs of the community.
While some infrastructure asset types, namely public roads and airports, have made significant progress in performance measurement, for others there is a dearth of information or public engagement. The patchwork approach that has resulted means that Australia may be missing out on the potential benefits of consistent and widespread performance measurement: improved accountability, incentivised performance, and better performance evaluation. This report introduces and explores many of the issues surrounding infrastructure performance measurement that should be considered in the context of providing greater consistency across infrastructure asset types.
- Measuring infrastructure asset performance and customer satisfaction: A review of existing frameworks