
Summary of current report
This annual survey covers all civilian registered aircraft used in the Commercial Air Transport (CAT), general aviation and sport and recreation sectors of the Australian aviation industry.
The CAT sector is scheduled commercial air transport and non-scheduled commercial air transport operations. The general aviation sector is all other VH registered aircraft (other than commercial air transport). The sport and recreation sector includes aircraft registered with one of the following Civil Aviation Safety Authority regulated self-administration bodies:
- Recreational Aviation Australia (RA-Aus),
- Gliding Australia,
- Sports Aviation Federation of Australia (SAFA) or,
- the Australian Sport Rotorcraft Association (ASRA).
The major categories of flying are aerial work, own use business flying, instructional flying, personal and pleasure flying and other flying. In addition, the sport aviation segment includes operations by ultralight aircraft, gliders, hang gliders and gyrocopters. The survey results are merged with details from the civil aircraft register which gives access to additional relevant information including aircraft type, engine and fuel type, country and year of manufacture.
The base measure of this report is flying hours. All operators of Australian registered aircraft are asked to report the hours flown and landings across the various flying categories. The VH registered response to this year's reporting request was 70.2%.
Since 2020 aircraft registered with RA-Aus have been included in the annual Australian Aircraft Activity Report. The RA-Aus response to this year’s reporting request was 72.6%. Statistics for the remainder of the sport aviation segment are collected directly from the self-administrating associations.
Key Indicators
In 2024 the total hours flown in Australia by Australian owned and operated aircraft increased by 1.4% to 3.63 million hours.
CAT hours flown by VH registered aircraft increased by 1.5% to 1.93 million hours. Hours flown by scheduled commercial air transport increased by 4.7% to 1.44 million hours, while hours flown by non-scheduled commercial air transport decreased by 6.9% to 489,442 hours.
General aviation hours flown by VH registered aircraft increased by 2% to 1.4 million hours. Sport and pleasure flying hours decreased (down 10% to 221,665 hours), instructional flying (up 14.5% to 437,458 hours), own-use business flying (up 1.3% to 131,330 hours) and aerial work (down 1.4% to 542,419 hours).
Sport aviation (ultralights, gliders, hang gliders and gyrocopters) activity generally experiences large swings in activity from year to year. In 2024, sport aviation activity decreased 1.5 % to 328,574 hours.
Hours Flown in Australian Aircraft Activity (000's)—year end December
| Year | |||
|---|---|---|---|
| 2023 | 2024 | ||
| (thousands) | |||
| Commercial air transport | Scheduled | 1 371.6 | 1 436.2 |
| Non-scheduled | 526.0 | 489.4 | |
| Total commercial air transport | 1 897.6 | 1 925.6 | |
| General aviation (VH)* | Aerial work | 550.4 | 542.4 |
| Own-use business | 129.6 | 131.3 | |
| Instructional flying | 381.9 | 437.5 | |
| Sport and pleasure flying | 246.0 | 221.7 | |
| Other flying | 41.9 | 43.5 | |
| Total general aviation (VH) | 1 349.9 | 1 376.4 | |
| Sport aviation (non-VH) | 333.6 | 328.6 | |
| Total hours flown | 3 581.1 | 3 630.6 | |
*VH aircraft are registered with CASA
*non-VH aircraft are registered with self-administrating associations
Airline on-time performance statistics—monthly summary
- Airline on-time performance—monthly reports and time series data
- Airline on-time performance—annual reports (financial and calendar years)
Summary—July 2026
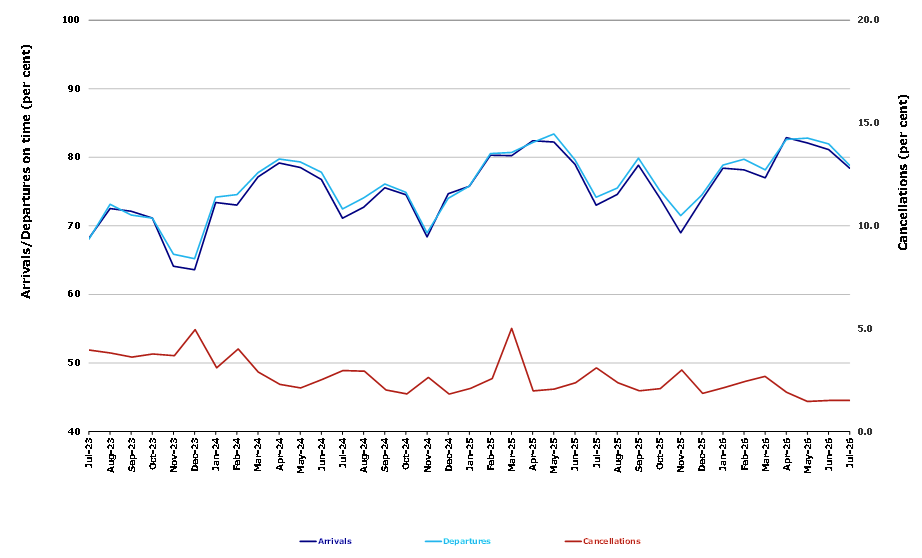
For July 2026, on time performance over all routes operated by participating airlines (Hinterland, Jetstar, Qantas, QantasLink, Rex Airlines, Skytrans Australia, Virgin Australia and Virgin Australia Regional Airlines) averaged 78.4% for on time arrivals and 78.8% for on time departures. The cancellation rate for the month was 1.5%. The equivalent figures for July 2025 were 73.0% for on time arrivals, 74.2% for on time departures and 3.1% for cancellations.
This month’s on time arrivals figure was lower than the long term average (average over the period of OTP reporting starting in November 2003) performance for all routes (80.5%) and the on time departures figure was also lower than the long term average (81.6%). The rate of cancellations was lower than the long term average of 2.2%.
On-time arrivals
The Qantas network (Qantas and QantasLink combined operations) recorded 81.4% for on time arrivals while the Virgin Australia network (Virgin Australia and Virgin Australia Regional Airlines combined operations) recorded 76.3%. Hinterland achieved the highest on time arrivals at 93.1%, followed by Qantas at 82.1%, QantasLink at 81.0%, Skytrans Australia at 79.5%, Rex Airlines at 76.9%, Virgin Australia at 76.5%, Jetstar at 72.5% and Virgin Australia Regional Airlines at 65.6%.
On-time departures
The Qantas network recorded 82.0% for on time departures while the Virgin Australia network recorded 77.1%. Hinterland achieved the highest level of on time departures for July 2026 at 96.1%, followed by Qantas at 84.4%, Skytrans Australia at 80.9%, QantasLink at 80.6%, Rex Airlines at 80.1%, Virgin Australia at 77.2%, Virgin Australia Regional Airlines at 75.9% and Jetstar at 70.0%.
Cancellations
Skytrans Australia recorded the highest percentage of cancellations at 3.6% during the month. The second highest cancellation rate was from QantasLink at 2.2%, Qantas at 1.6%, Virgin Australia at 1.4%, Rex Airlines at 1.2%, Jetstar at 0.9%, Hinterland at 0.4% and Virgin Australia Regional Airlines at 0.0%.
Routes
Airlines’ on time performance varies across the routes they serve. Individual route data by specific airline for 59 routes (118 sectors when counting both directions of flights) are shown on pages 10-21.
Of the 59 routes which met the criteria for on time performance reporting in July 2026, the Adelaide-Perth sector had the highest percentage of on time arrivals (91.9%), while the Brisbane-Mount Isa sector had the highest percentage of on time departures (95.8%). The Alice Springs-Adelaide sector had the lowest percentage of on time arrivals (50.0%) and the lowest percentage of on time departures (46.0%).
Cancellations were highest on the Canberra-Sydney sector at 5.4%, followed by the Mildura-Melbourne sector at 5.2%, the Sydney-Canberra sector at 4.7%, the Canberra-Melbourne sector at 4.5%, the Melbourne-Sydney sector at 4.3% and the Sydney-Melbourne sector at 4.2%.
For the month of July 2026 there were 39 out of the 118 route sectors (from the 59 routes) that had zero cancellations: Adelaide-Alice Springs, Adelaide-Perth, Alice Springs-Adelaide, Ayers Rock-Melbourne, Brisbane-Cairns, Brisbane-Canberra, Brisbane-Darwin, Brisbane-Hamilton Island, Brisbane-Hobart, Brisbane-Launceston, Brisbane-Mount Isa, Brisbane-Newcastle, Brisbane-Proserpine, Broome-Perth, Cairns-Brisbane, Canberra-Brisbane, Canberra-Gold Coast, Darwin-Brisbane, Darwin-Perth, Gold Coast-Canberra, Hamilton Island-Brisbane, Hobart-Brisbane, Launceston-Brisbane, Melbourne-Ayers Rock, Melbourne-Cairns, Melbourne-Darwin, Mount Isa-Brisbane, Newcastle-Brisbane, Newman-Perth, Perth-Adelaide, Perth-Broome, Perth-Darwin, Perth-Newman, Proserpine-Brisbane, Sydney-Ballina, Sydney-Coffs Harbour, Sydney-Hobart, Sydney-Wagga Wagga, and Wagga Wagga-Sydney.
Airports
Mount Isa Airport recorded the highest percentage of on time arrivals (91.7%) while Emerald Airport had the highest percentage of on time departures (89.6%). Alice Springs Airport recorded the lowest percentage of on time arrivals (58.0%) and the lowest percentage of on time departures (46.0%). These figures only refer to reported routes and do not cover all flights at these airports.
Table 1: Total industry on-time performance for July 2026
| Reporting Airlines | Sectors Scheduled | Arrivals on-time % | Departures on-time % | Cancellations % |
|---|---|---|---|---|
| Hinterland | 1,664 | 93.1 | 96.1 | 0.4 |
| Jetstar | 8,645 | 72.5 | 70.0 | 0.9 |
| Qantas - all QF designated services | 19,927 | 81.4 | 82.0 | 2.0 |
| Rex Airlines | 4,358 | 76.9 | 80.1 | 1.2 |
| Skytrans Australia | 359 | 79.5 | 80.9 | 3.6 |
| Virgin Australia - all VA designated services | 12,479 | 76.3 | 77.1 | 1.4 |
| All Airlines | 47,432 | 78.4 | 78.8 | 1.5 |
| Individual operating entities | ||||
| Qantas | 7,138 | 82.1 | 84.4 | 1.6 |
| QantasLink | 12,789 | 81.0 | 80.6 | 2.2 |
| Virgin Australia | 12,267 | 76.5 | 77.2 | 1.4 |
| Virgin Australia Regional Airlines | 212 | 65.6 | 75.9 | 0.0 |
Figure 1: Total industry on-time performance by month from July 2023
Airline on-time performance—2025 calendar year
- Airline on-time performance—annual reports
- Airline on-time performance—monthly reports and time series data
Summary – 2025 Calendar Year
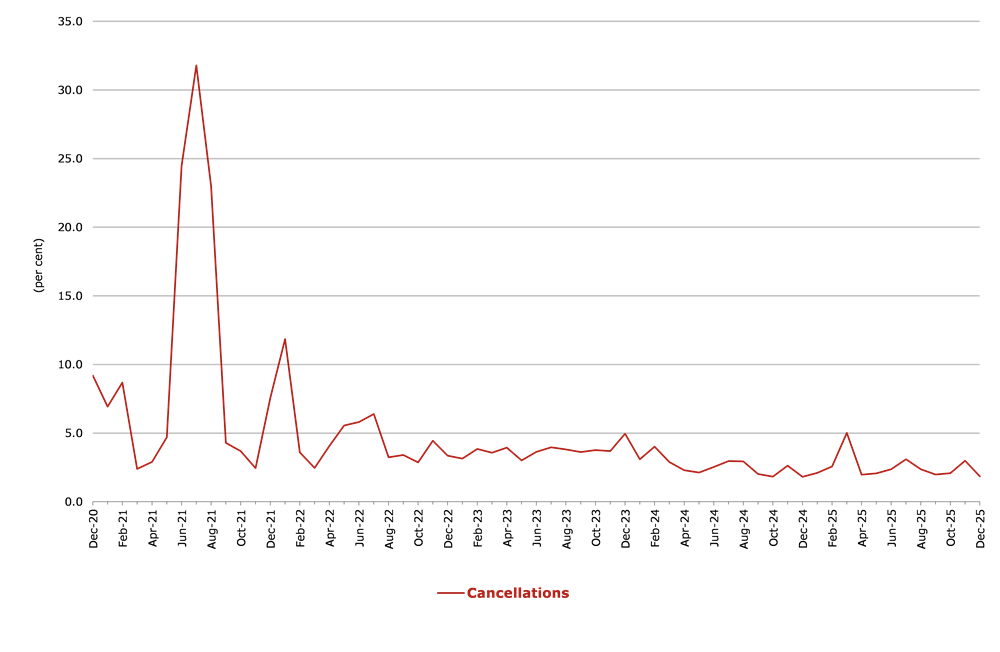
For the year ended December 2025, on time performance (OTP) over all routes operated by participating airlines (Hinterland, Jetstar, Qantas, QantasLink, Rex Airlines, Skytrans Australia (formerly Smartlynx Australia), Virgin Australia and Virgin Australia Regional Airlines) averaged 76.9 per cent for on time arrivals and 77.7 per cent for on time departures. The cancellation rate for the year was 2.5 per cent. The equivalent figures for 2024 were 74.6 per cent for on time arrivals, 75.4 per cent for on time departures and 2.6 per cent for cancellations. Airlines’ on time performance varies across the routes they serve. Individual route data by specific airline for 60 routes which operated for at least part of the 2025 calendar year are shown on pages 9-21.
The 2025 on time arrivals figure was lower than the long-term average (average over the period of OTP reporting starting in November 2003) performance for all routes (80.5 per cent) and the on time departures figure was also lower than the long-term average (81.6 per cent). The rate of cancellations was higher than the long-term average of 2.2 per cent.
On time arrivals
The Qantas network (Qantas and QantasLink combined operations) recorded 77.9 per cent for on time arrivals while the Virgin Australia network (Virgin Australia and Virgin Australia Regional Airlines combined operations) recorded 76.0 per cent. Hinterland achieved the highest on time arrivals at 88.4 per cent, followed by Skytrans Australia at 85.1 per cent, QantasLink at 78.3 per cent, Qantas at 77.2 per cent, Virgin Australia at 76.0 per cent, Jetstar at 75.2 per cent, Rex Airlines at 73.0 per cent and Virgin Australia Regional Airlines at 71.5 per cent.
On time departures
The Qantas network recorded 78.8 per cent for on time departures while the Virgin Australia network recorded 77.0 per cent. Hinterland achieved the highest level of on time departures for 2025 at 92.5 per cent, followed by Skytrans Australia at 86.3 per cent, Qantas at 79.7 per cent, QantasLink at 78.3 per cent, Virgin Australia at 77.2 per cent, Rex Airlines at 76.0 per cent, Jetstar at 73.6 per cent and Virgin Australia Regional Airlines at 67.6 per cent.
Cancellations
Skytrans Australia recorded the highest percentage of cancellations at 8.4 per cent during the year. The second highest cancellation rate was from QantasLink at 3.6 per cent, followed by Qantas at 2.7 per cent, Rex Airlines at 2.5 per cent, Jetstar at 2.2 per cent, Virgin Australia at 1.7 per cent, Virgin Australia Regional Airlines at 1.1 per cent and Hinterland at 0.8 per cent.
Routes
Of the 60 routes which met the criteria for OTP reporting, the Townsville-Cairns route (Jan 2025 only) had the highest percentage of on time arrivals (90.9 per cent) and the highest percentage of on time departures (90.9 per cent). For those routes reporting for the entirety of 2025, Emerald-Brisbane had the highest percentage of on time arrivals (89.8 per cent) and the highest percentage of on time departures (88.4 per cent). The Hamilton Island-Sydney route had the lowest percentage of on time arrivals (60.8 per cent) and the lowest percentage of on time departures (61.6 per cent).
Cancellations were highest on the Canberra-Sydney route at 6.2 per cent, followed by the Sydney-Canberra route at 5.6 per cent, the Port Lincoln-Adelaide and Sydney-Melbourne routes at 4.4 per cent, the Port Macquarie-Sydney and Melbourne-Sydney routes at 4.3 per cent, the Adelaide-Port Lincoln and Gladstone-Brisbane routes at 4.1 per cent, the Sydney-Port Macquarie route at 4.0 per cent and the Devonport-Melbourne route at 3.9 per cent.
Cancellations were lowest on the Melbourne-Ayers Rock at 0.0 per cent, followed by the Sydney-Hamilton Island route at 0.1 per cent, Ayers Rock-Melbourne and Sydney-Cairns routes at 0.3 per cent, and the Perth-Newman and Melbourne-Sunshine Coast routes at 0.4 per cent.
Airports
Of the airports with OTP reporting for 2025, Emerald Airport recorded the highest percentage of on time arrivals (86.2 per cent) and the highest percentage of on time departures (88.4 per cent). Port Macquarie Airport recorded the lowest percentage of on time arrivals (70.0 per cent) and Broome Airport recorded the lowest percentage of on time departures (64.8 per cent). These figures only refer to reported routes and do not cover all flights at these airports.
Table 1: Total industry on-time performance for 2025
| Reporting Airlines | Sectors Scheduled | Arrivals On Time % | Departures On Time % | Cancellations % |
|---|---|---|---|---|
| Hinterland | 18,415 | 88.4 | 92.5 | 0.8 |
| Jetstar | 96,686 | 75.2 | 73.6 | 2.2 |
| Qantas - all QF designated services | 231,962 | 77.9 | 78.8 | 3.2 |
| Rex Airlines | 52,716 | 73.0 | 76.0 | 2.5 |
| Skytrans Australia (formerly SmartLynx Australia) | 6,191 | 85.1 | 86.3 | 8.4 |
| Virgin Australia - all VA designated services | 145,379 | 76.0 | 77.0 | 1.7 |
| All Airlines | 551,349 | 76.9 | 77.7 | 2.5 |
| Individual operating entities | ||||
| Qantas | 88,886 | 77.2 | 79.7 | 2.7 |
| QantasLink | 143,076 | 78.3 | 78.3 | 3.6 |
| Virgin Australia | 143,031 | 76.0 | 77.2 | 1.7 |
| Virgin Australia Regional Airlines | 2,348 | 71.5 | 67.6 | 1.1 |
Figure 1. Total Industry Arrivals and Departures On Time by month from December 2020
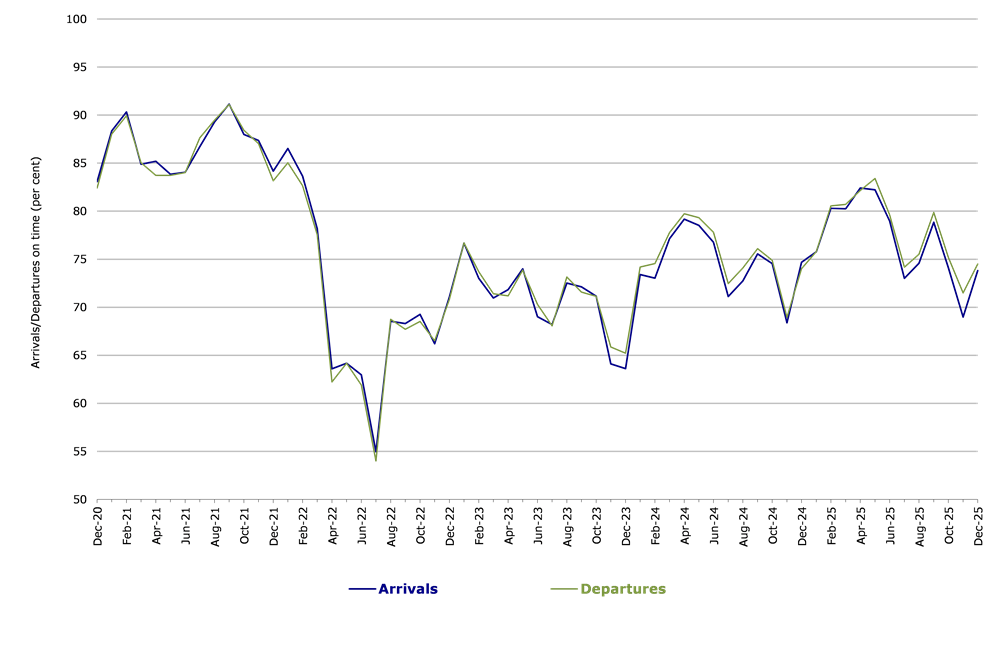
Figure 2. Total Industry Cancellations by month from December 2020
Aviation activity as a leading indicator of economic activity
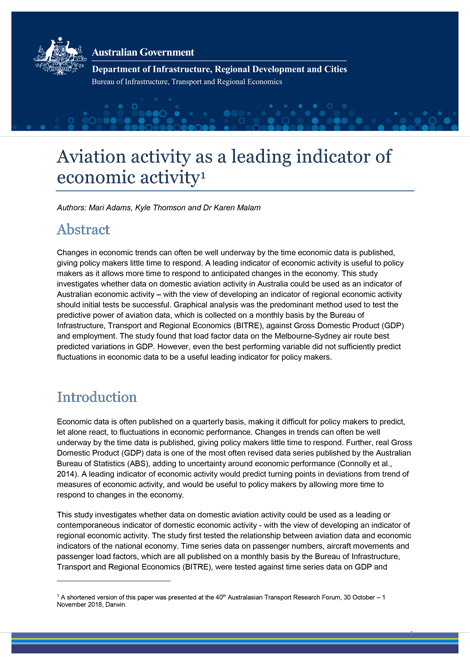
This study investigates whether data on domestic aviation activity in Australia could be used as an indicator of Australian economic activity–with the view of developing an indicator of regional economic activity should initial tests be successful. Graphical analysis was the predominant method used to test the predictive power of aviation data, which is collected on a monthly basis by the Bureau of Infrastructure, Transport and Regional Economics (BITRE), against Gross Domestic Product (GDP) and employment.
- Aviation activity as a leading indicator of economic activity
General Aviation Study
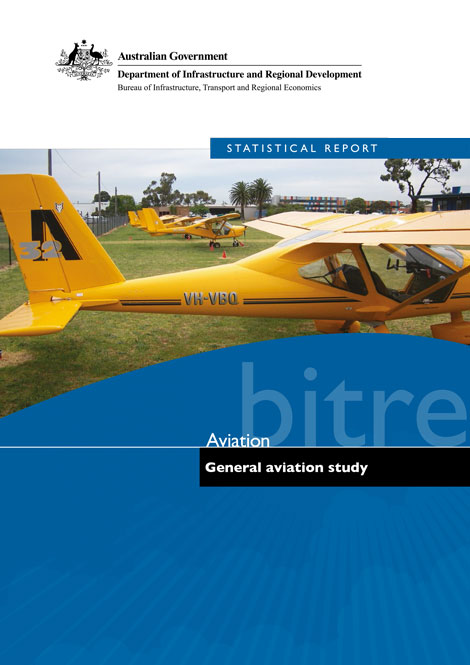
General aviation is a diverse sector that is undergoing change. While overall GA activity appears to be declining slowly, it is not accurate to say that all parts of GA are declining.
Those parts of GA that are discretionary in nature, such as pleasure flying, appear to decline in more conservative economic times, while those parts of GA that are a key part of an expanding industry, such as aerial mustering, have been growing strongly. Detailed economic analysis of these relationships is not currently possible due to the current lack of financial statistics for GA, however this report outlines some of the key challenges facing GA and identifies some key opportunities for the industry and Government to respond to these challenges.
- General Aviation Study
Employment Generation and Airports
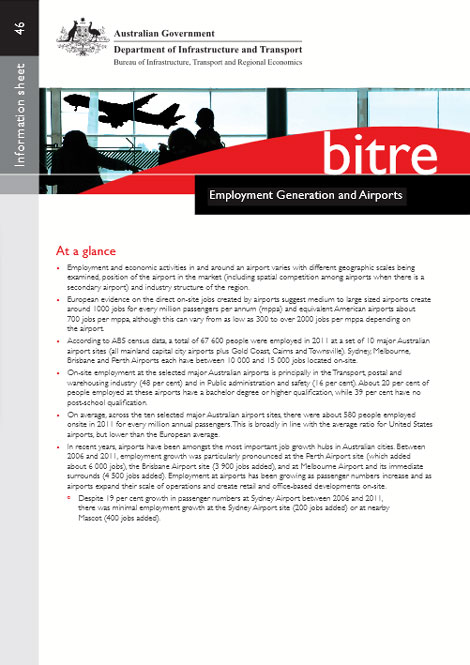
This information sheet provides evidence about the relationship between airport infrastructure and economic activity. It draws together evidence from the international literature and evidence for major Australian airports. It presents estimates of the number of jobs located at major Australian airports in 2011, the industry structure and skill mix of that employment, and recent growth in employment based on the ABS Census of Population and Housing.
- Employment Generation and Airports
Brisbane Airport: Interim Report on International Terminal
This Report represents part of a full-scale study by BTE, at the direction of the Minister for Transport, of the development requirements for Brisbane Airport. The full report will be issued at a later date and will present a detailed examination of the civil aviation requirements of the region and the appropriate expansion/replacement program.
- Brisbane Airport: Interim Report on International Terminal
Deregulation of Domestic Aviation—The First Year
The Commonwealth's regulation of interstate aviation, in place for over thirty years, came to an end at midnight on 30 October 1990. This study reviews the developments in the last few months of regulation and in the first year of deregulation.
- Deregulation of Domestic Aviation–The First Year
Air Transport Service Trends in Regional Australia—2011 update
This report updates and supersedes the time series statistics presented in Report 115 and Information sheet 35 on Air transport services in regional Australia: trends and access. It updates the data (to 2012) and the geographic basis of the analysis.
- Air Transport Service Trends in Regional Australia–2011 update
Avline provides a summary of previously released Aviation related data drawing on a range of sources including BITRE, ABS, Airservices Australian and the US Energy Information Administration. In addition, Avline provides a comparison of published airport charges at the five major capital city airports and at a selection of regional airports. Avline 2010–11 covers the financial year 2010–11 and is the third of the series to be published annually instead of biannually.