Five facts about commuting in Australia
This Information Sheet covers a wide range of subjects, including volume and length of commuting, traffic congestion and commuting patterns. The following five questions are discussed:
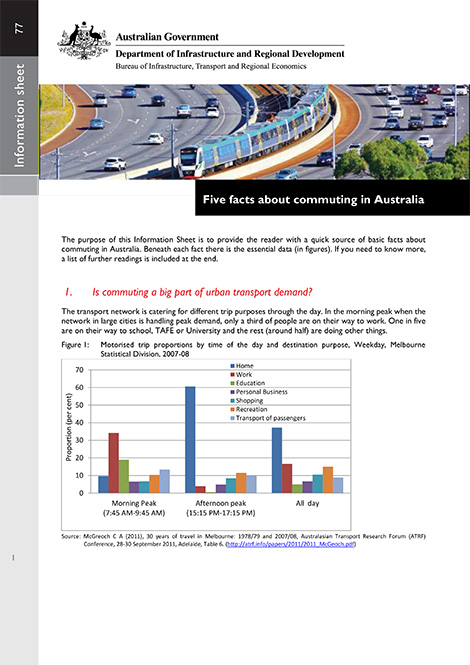
- Is commuting a big part of urban transport demand?
- Is it true that a lot of people are spending hours stuck in traffic?
- What has an Italian physicist got to do with commuting?
- Why do some people commute longer? and
- Are our commuting patterns changing?
- Five facts about commuting in Australia
Heavy truck safety: crash analysis and trends
This paper analyses road traffic crashes involving heavy trucks, highlighting characteristics such as severity, location, temporarily and type of crash. A brief introduction to the regulatory environment and statistical summaries of Australia's heavy vehicle fleet are also provided.
- Heavy truck safety: crash analysis and trends
BITRE road construction and maintenance price index—2015 update
This Information Sheet presents the quarterly road construction and maintenance price index for the year 2014–15. Additionally, it presents sub-indexes by activity type for road construction and road maintenance, and by road type for arterial, sealed local and unsealed local roads.
- BITRE road construction and maintenance price index–2015 update
Traffic and congestion cost trends for Australian capital cities
The avoidable cost of congestion for the Australian capital cities is estimated to be around $16.5 billion for the 2015 financial year, having grown from about $12.8 billion for 2010. BITRE 'business-as-usual' projections of these costs of metropolitan congestion rise to around $30 billion by 2030–with the various modelling scenarios conducted giving aggregate 2030 results of between $27.7 and $37.3 billion, depending upon the chosen assumptions.
- Traffic and congestion cost trends for Australian capital cities
- VKT and Summary Cost Data
Australia's commuting distance: cities and regions
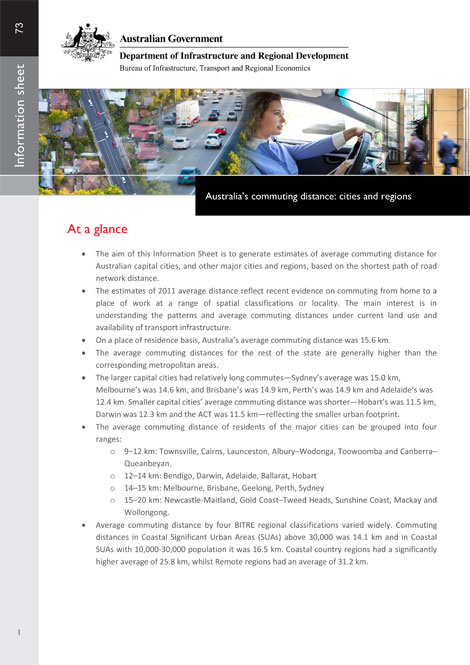
The 2011 average commuting distances reflect recent evidence on commuting from home to a place of work at a range of spatial classifications or localities. The main interest is in understanding the patterns and average commuting distances under current land use and availability of transport infrastructure.
- Australia's commuting distance: cities and regions
Australian cycling safety
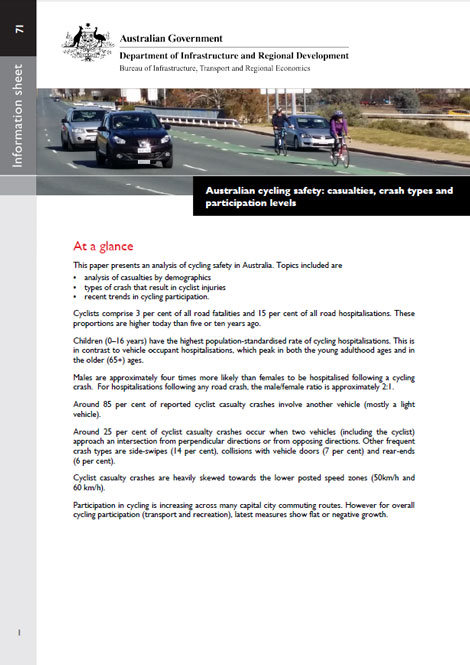
In this paper, several sources of bicycle crash data and exposure data are used to provide an overview of cycling safety and data sources in Australia. Recent trends are identified. Section 1 presents latest casualty and fatality statistics, including tabulations by jurisdiction and age group. Section 2 presents analyses of crash type, vehicles-involved and location characteristics for crashes involving a cyclist casualty, and Section 3 explores recent Australian cycling exposure data.
- Australian cycling safety
Transport infrastructure and land value uplift
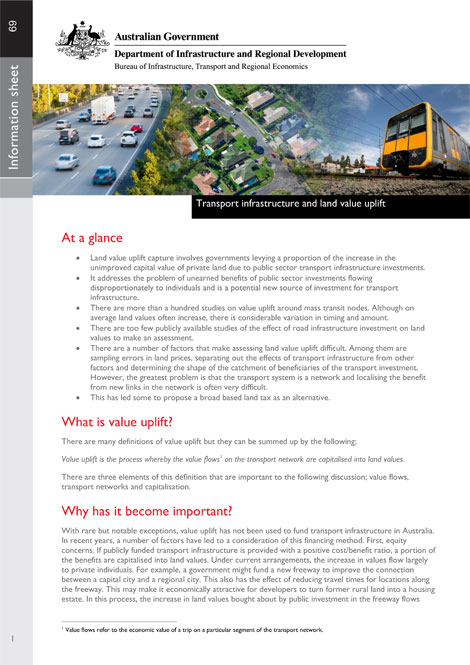
Users of the transport network are not its only beneficiaries. Land owners can also gain as increased value flows along the network are capitalised into land. Value uplift financing attempts to capture a portion of this by levying the landholders in the catchment areas of new infrastructure. The main problem with this system is that is very difficult to localise benefits in a network. This has led some to propose a broad based land tax instead.
- Transport infrastructure and land value uplift
Pedestrians and road safety
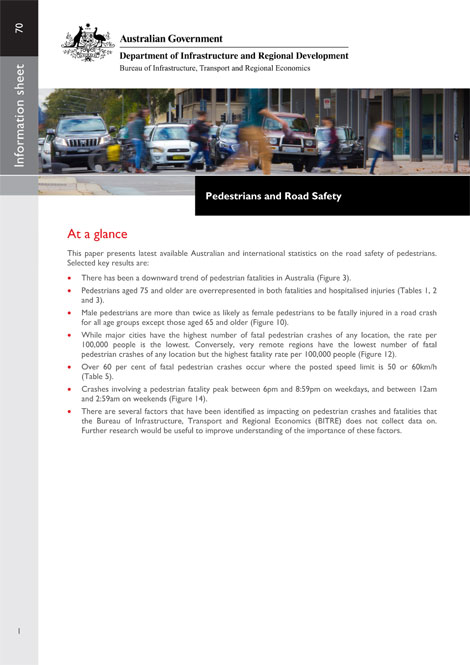
Pedestrians comprise the largest single road user group because almost everyone is a pedestrian at some point. People walk for leisure, to go to work, school or local shops, and to access other modes of transport. In Australia, there has been a consistent downward trend in total road fatalities, including pedestrian fatalities. Since 2005, pedestrian fatalities as a percentage of all road fatalities have remained relatively stable.
- Pedestrians and road safety
The impact of airbags and electronic stability control on Australian light vehicle fatalities
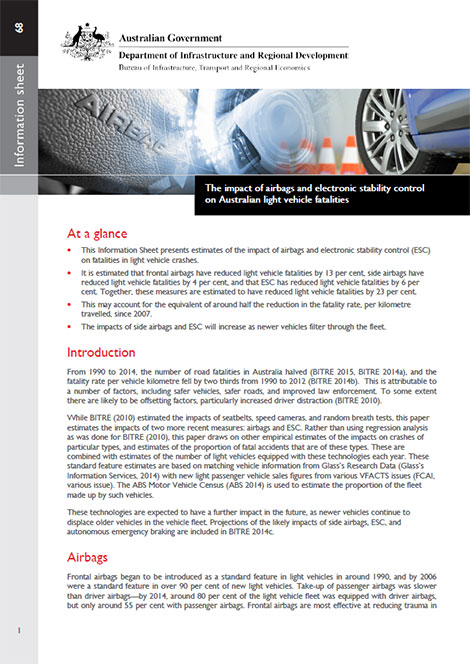
This Information Sheet presents estimates of the impact of airbags and electronic stability control (ESC) on fatalities in light vehicle crashes. It is estimated that frontal airbags have reduced light vehicle fatalities by 13 per cent, side airbags have reduced light vehicle fatalities by 4 per cent, and that ESC has reduced light vehicle fatalities by 6 per cent. Together, these measures are estimated to have reduced light vehicle fatalities by 23 per cent. This may account for the equivalent of around half the reduction in the fatality rate, per kilometre travelled, since 2007. The impacts of side airbags and ESC will increase as newer vehicles filter through the fleet.
- The impact of airbags and electronic stability control on Australian light vehicle fatalities
Changes in Australia's industry structure: cities and regions, 2006–2011
This Information Sheet identifies recent trends (2006 to 2011) in employment by various industries for regional areas, capital cities and non-capital cities. It updates BITRE's previous Information Sheet 32, which focused on employment changes between 2001 and 2006. The information presented in this publication will assist regional communities (including local government and RDAs) to understand how their regions are changing, and help regions map out where their opportunities and challenges might lie.
- Changes in Australia's industry structure: cities and regions, 2006–2011