

Previous issues of Avline have examined Australian domestic and regional aviation. The feature article in this issue focuses on the international sector of the Australian aviation industry which is currently operating at record levels–with more than 21 million passengers carried on flights to or from Australia during 2005.
- Avline No 8–June 2006
Australian Transport Statistics 2006
Australian Transport Statistics provides an easy introduction to a diverse range of transport statistics. Topics include employment, GDP, passenger and freight movements, trade, funding, motor vehicles, fatalities and estimated greenhouse gas emissions attributed to the transport industry. Various international comparisons are included and details provided for the road, rail, marine and aviation sectors. Data are gathered from various sources within the Bureau of Transport and Regional Economics and from external organisations.
Port Level Forecasts of Container and Ship Movements in Australia: 2004–05 to 2024–25
Paper given to the 29th Australian Transport Research Forum conference to be held from 27 to 29 September 2006 in Gold Coast. Authors: Krishna Hamal, Benjamin James, Mark Cregan.
- Port Level Forecasts of Container and Ship Movements in Australia: 2004–05 to 2024–25
Passenger Movements between Australian Cities, 1970–71 to 2030–31
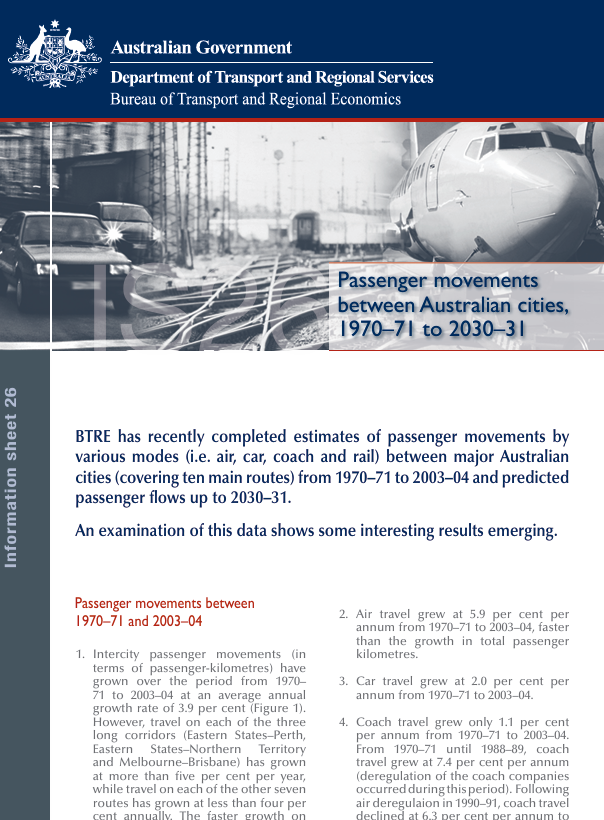
BTRE has recently completed estimates of passenger movements by various modes (i.e. air, car, coach and rail) between major Australian cities (covering ten main routes) from 1970–71 to 2003–04 and predicted passenger flows up to 2030–31.
Waterline No 41—December 2006
In addition to the usual content on wharfside indicators of productivity, Waterline 41 contains a feature article on a set of new indicators of productivity improvements focusing on the interface between port terminals and the trucks and trains that deliver containers to and pick up containers from the terminals.
Indicators include number of trucks processed, container turnaround time, rail transported containers as percent of containers processed on the landside of terminal, and indicators on the availability and use of vehicle booking system time slots at port terminals.
The article includes preliminary estimates of the indicators. However these estimates are based on incomplete data and some, for example rail mode share, are unreliable. They are published at this stage to indicate the intended scope of the new indicators and for comment before formal reporting of the indicators starts in 2007.
Container and Ship Movements Through Australian Ports 2004–05 to 2024–25
This report presents the national and port level forecasts of container and ship movements through Australian ports over the next twenty years.
- Container and Ship Movements Through Australian Ports 2004–05 to 2024–25
Australian maritime trade 2000–01 to 2004–05
Australian maritime trade: 2000–01 to 2004–05 extends data available through the BTRE's Australian Sea Freight publications by including information on markets, shipping lanes, key trade routes, traded commodities and passenger services associated with Australia's maritime trade.
- Australian maritime trade 2000–01 to 2004–05

It highlights the variation in aircraft and passenger traffic during this period and discusses how the operational profile has changed through the introduction of discount flights and more direct services to regional centres.
- Avline No 9–May 2007
Australian sea freight 2004–05
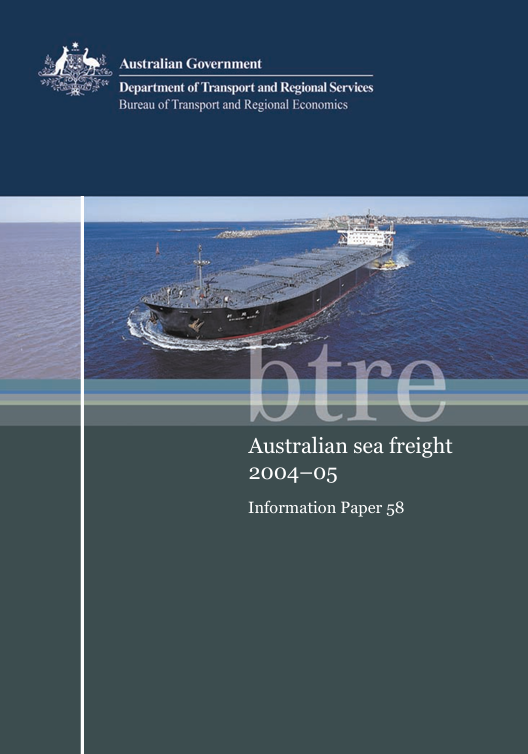
Statistics on the movement of Australian freight by sea, information on port activity, fleet structure and use of coastal permits. This edition focuses on sea freight activity around Australia during 2004–05.
Waterline No 42—July 2007
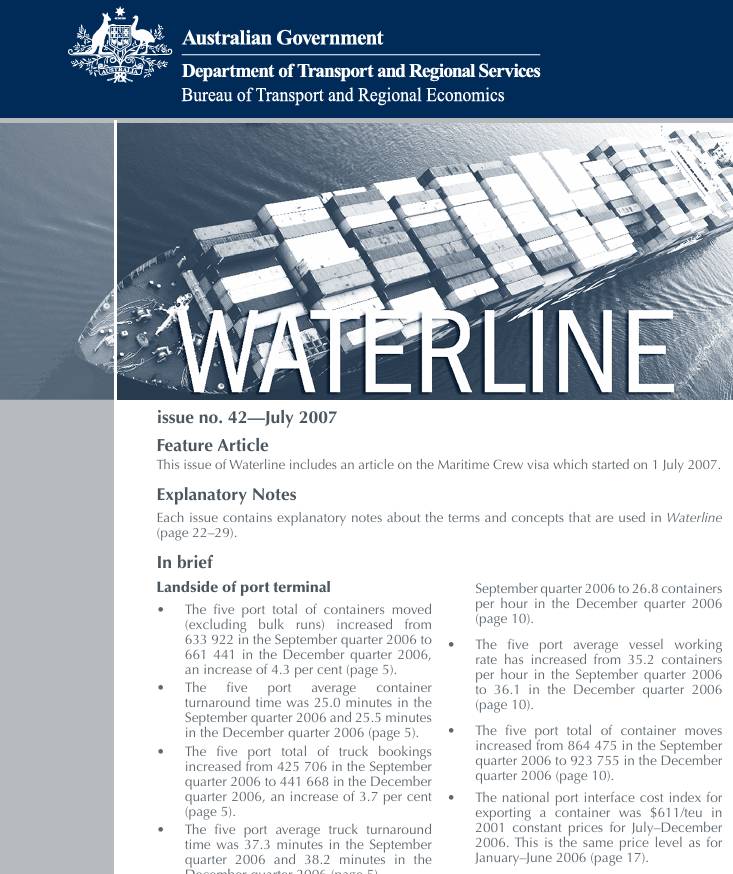
This edition of Waterline includes an article on the Maritime Crew visa which started on 1 July 2007. Waterline 42 incorporates a new section dealing with landside performance indicators, which include containers per truck, average container turnaround time and truck turnaround time. It also includes landside of container terminal task indicators such as total containers by road, TEUs by road and total trucks processed. Some charts also show total containers by rail. The new section commences with the September and December quarters 2006.