Transport Energy and Environment
Chapter 11
This chapter provides information on the Australian measures of transport energy and the environment. Data is sourced from the Department of Climate Change, Energy, the Environment and Water's petroleum statistics and BITRE estimates.
- Road vehicles made up 84 percent of full fuel cycle greenhouse gas emissions from all domestic transport modes in 2023–24, compared to 9 per cent from aviation.
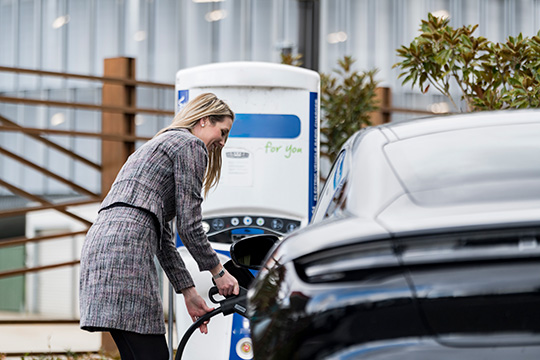
- The national average price for petrol was 196 cents per litre in the 2023–24 financial year.
- In 2023–24, domestic road vehicle full fuel cycle greenhouse gas emissions estimates (carbon dioxide equivalent) reached a record high level of 108 000 gigagrams of CO2 equivalent.
- In 2023–24, there was an estimated 58 billion litres of transport petroleum sold in Australia.
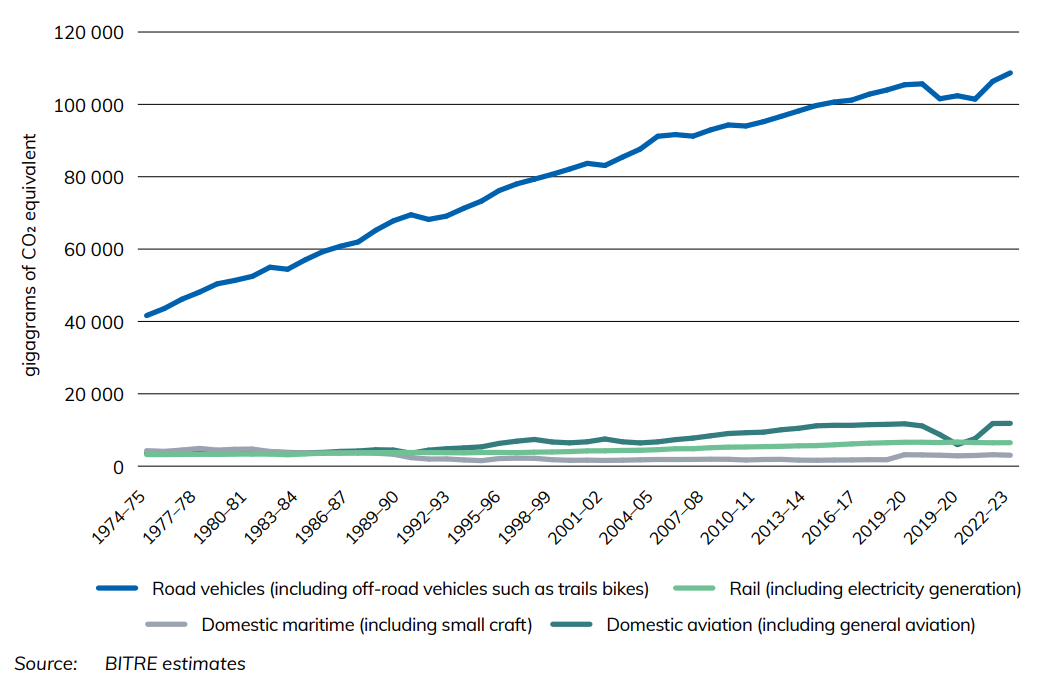
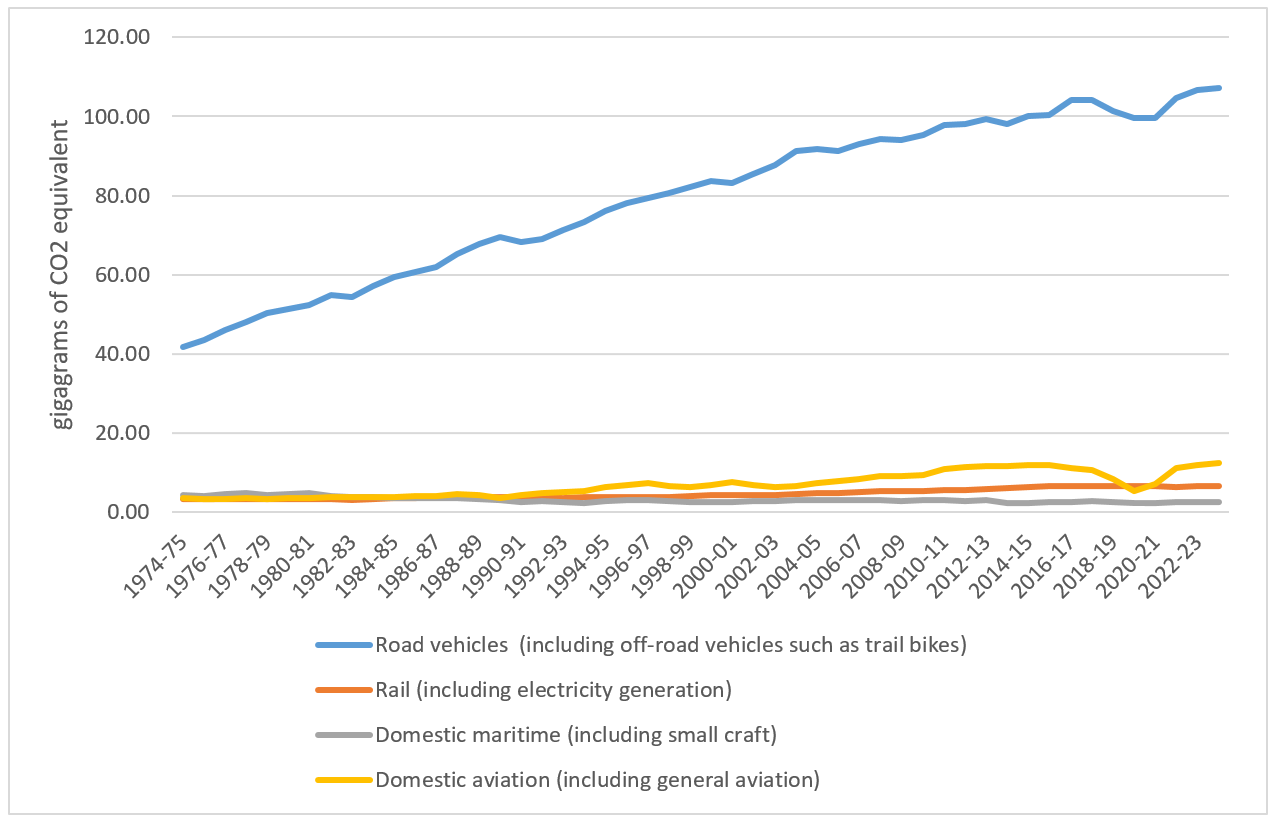
Figure 22 shows full fuel cycle greenhouse gas emissions by transport mode in gigagrams of CO2 equivalent. Transport emissions in Australia have risen steadily since 1974–75, except over the COVID-19 pandemic period, which saw them dip temporarily for road vehicles and domestic aviation. Domestic aviation emissions were most affected, almost halving from 11 116 gigagrams of CO2 equivalent in 2018–19 to 5 955 gigagrams of CO2 equivalent in 2020–21, while road vehicle emissions fell by roughly 3 per cent over the same period.
Figure 22 Transport full fuel cycle greenhouse gas emissions
Download data
- Transport Energy and Environment—Yearbook 2024 (161 KB) - Download Excel file
- Australian Infrastructure and Transport Statistics—Yearbook 2024 - Download PDF
Also see
Chapter 8
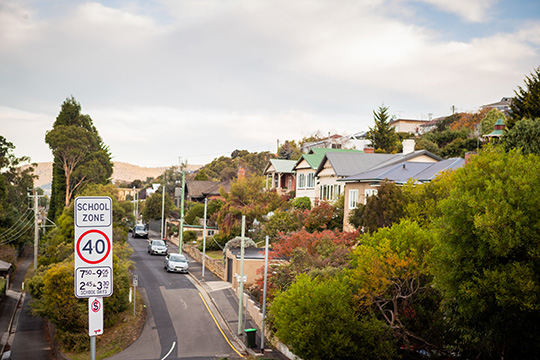
This chapter provides data on Australian safety for road, aviation, rail and maritime transport. This includes data relating to crashes, fatalities, injuries and their rates of occurrence, as well as how this differs for different demographics, states and territories (subject to data availability).
- In 2024, there were 1,294 road deaths, down from 1,737 in 2001.
- 28 aviation fatalities occurred in Australia in 2024.
- Road crashes resulted in approximately 36,000 hospitalised injuries across Australia in calendar year 2022, up from 27,000 in calendar year 2001.
- On Australia’s railways, 22 people died and 66 were seriously injured in 2024 (excludes suspected suicide).
Figure 16 shows the number of fatal crashes over time.
Figure 16 Fatalities by transport mode
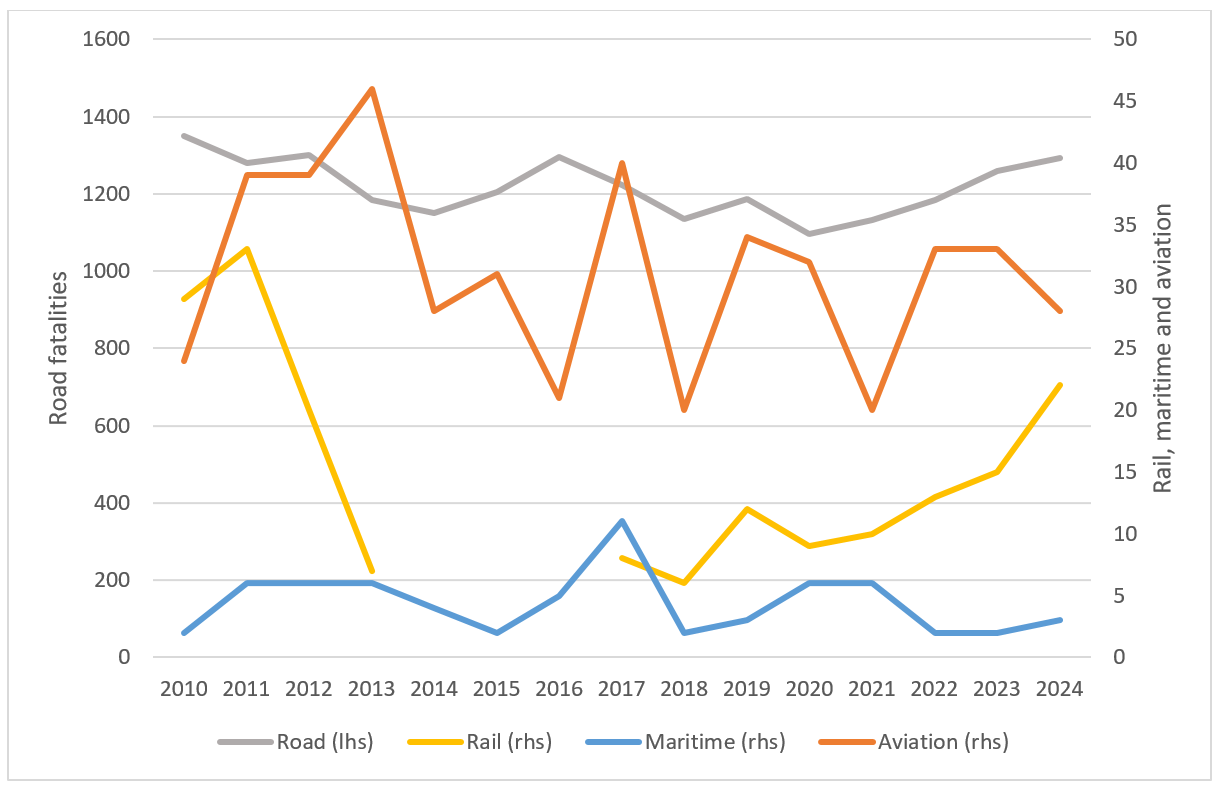
Source: Table 8.1
Download data
- Transport Safety—Yearbook 2025 (154 KB) - Download Excel file
- Australian Infrastructure and Transport Statistics Yearbook 2025 - Download PDF
Also see
Transport Energy and Environment
Chapter 9
This chapter provides information on the Australian measures of transport energy and the environment. Data is sourced from industry participants, the Australia Petroleum Statistics, the Australian Energy Statistics, the Department of Environment, Energy, Climate Change and Water and BITRE’s own estimates.
- Road vehicles made up 84 per cent of full fuel cycle greenhouse gas emissions from all domestic transport modes in 2024-25, compared to 10 per cent from aviation.
- In 2024-25, domestic road vehicle full fuel cycle greenhouse gas emissions estimates (carbon dioxide equivalent) reached a record high level of 108 megatonnes of CO2 equivalent.
- The national average price for petrol was 181 cents per litre in the 2024-25 financial year.
- In 2024-25, there was an estimated 59.2 billion litres of transport petroleum sold in Australia.
This chapter provides information on the Australian measures of transport energy and the environment. The methodology for this year’s estimates has been updated to incorporate new data sources and respond to changes in data availability and quality.
Figure 17 shows the full fuel cycle greenhouse gas emissions in megatonnes of CO2 equivalent. Transport emissions in Australia have risen steadily since 1974-75, except over the COVID-19 pandemic period, which saw them dip temporarily for road vehicles and domestic aviation. Transport emissions rose again in 2024-25, but at a slower rate than previous years post-pandemic.
Figure 17 Transport full fuel cycle greenhouse gas emissions
Source: BITRE estimates
Download data
- Transport Energy and Environment—Yearbook 2025 (131 KB) - Download Excel file
- Australian Infrastructure and Transport Statistics Yearbook 2025 - Download PDF
Also see
Bass Strait Passenger Vehicle Equalisation Scheme Monitoring Report No. 19
The Australian Government spent $101.0 million on the Bass Strait Passenger Vehicle Equalisation Scheme in the 2 years to June 2023 ($41.8 million in 2021–22 and $59.2 million in 2022–23).
Bass Strait Passenger Vehicle Equalisation Scheme Monitoring Report No. 18
The Australian Government spent $77.7 million on the Bass Strait Passenger Vehicle Equalisation Scheme in the 2 years to June 2021 ($40.8 million in 2019–20 and $36.9 million in 2020–21).
Under the scheme passengers travelling with a vehicle across Bass Strait can receive a rebate applied against the vehicle fare charged by a ferry operator.
Population synthesis for travel demand modelling in Australian capital cities
In this research, the proposed synthesis routine has been used to generate full size synthetic populations of households and individuals for Greater Sydney, Melbourne and Brisbane. Two heuristic algorithms have been formulated for data treatment before and after the synthesis process to improve the representation of the synthesised populations. The procedure proposed for data treatment before the synthesis routine ensures the consistency of the input data, whereas the procedure proposed for data treatment after the synthesis routine extends under-synthesised estimates to a complete synthetic population. The synthesis process was tested for its efficacy and the synthesised populations were validated extensively. This research contributes in setting up a replicable population synthesis routine that can be included into a standard methodological toolbox for transport researchers and mainstream social scientists to produce Australian synthetic populations that is essential to microsimulation analysis.
- Population Synthesis for Travel Demand Modelling in Australian Capital Cities
Bass Strait Passenger Vehicle Equalisation Scheme Monitoring Report No. 17
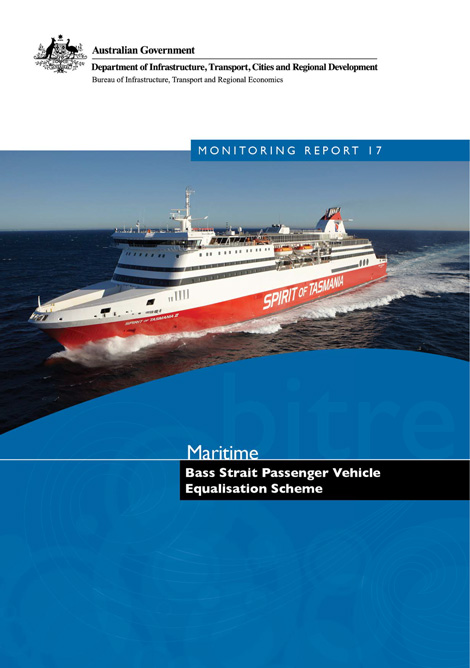
The Australian Government spent $104.1 million in the 2 years to 2018–19 ($51.3 million in 2018–19, and $52.8 million in 2017–18) on the Bass Strait Passenger Vehicle Equalisation Scheme (the Scheme).
Under the Scheme passengers travelling with a vehicle across Bass Strait can receive a rebate applied against the vehicle fare charged by a ferry operator.
Over the two-year monitoring period BITRE estimates that:
- The number of sea passengers with a motor vehicle may have been 29.2% higher than without the Scheme.
- Just under 26 000 additional visitors to Tasmania travelled by sea due to the Scheme in 2018–19 (28 600 new visitors in 2017–18).
These additional visitors to Tasmania spent an estimated $80.6 million in 2018–19 ($88.7 million in 2017–18).
Relationship between transport use and income in Australia
This Information Sheet explores the relationship between income and transport use in Australia by identifying the nature of the relationship between income and different types of transport use, and how public transport use (especially rail) varies with income in different locations. The information presented in this publication will be useful to understand the equity implications of government investment in transport infrastructure, particularly new urban rail infrastructure and implementation of regional development policy for regional cities located within commuting distance of the capital cities.
- Relationship between transport use and income in Australia
Freightline 7—Australian aluminium industry freight transport
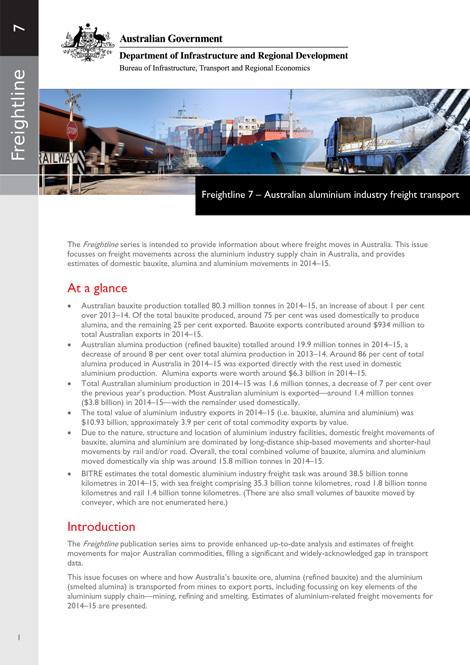
The Freightline series is intended to provide information on interregional freight movements across Australia, filling a major gap in Australian transport-related data and information, to help better inform and support policy development and infrastructure planning. Freightline 1 provides a broad overview of the freight task. Subsequent issues consider specific commodity freight tasks, and include more detailed information about the size and location of major freight movements, supply chain composition and key infrastructure components.
This issue (Freightline 7) focusses on Australian aluminium industry transport supply chains and freight movements in 2014–15.
- Freightline 7–Australian aluminium industry freight transport
Freightline 6—Australian rice freight transport
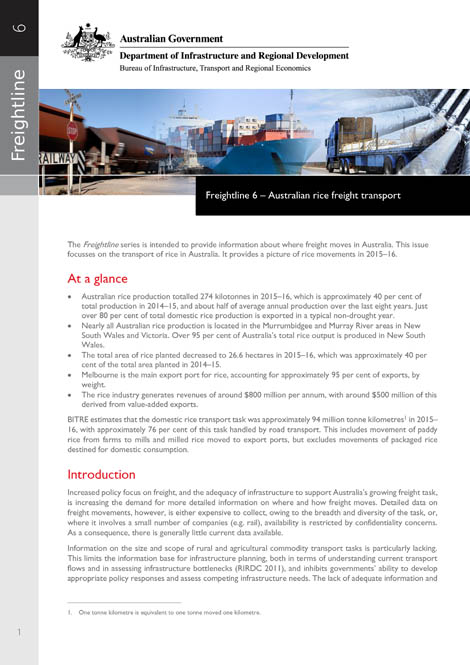
The Freightline series is intended to provide information on interregional freight movements across Australia, filling a major gap in Australian transport-related data and information, to help better inform and support policy development and infrastructure planning. Freightline 1 provides a broad overview of the freight task. Subsequent issues consider specific commodity freight tasks, and include more detailed information about the size and location of major freight movements, supply chain composition and key infrastructure components. This issue (Freightline 6) focusses on Australian rice transport supply chains and freight movements in 2015–16.
- Freightline 6–Australian rice freight transport