Bass Strait Passenger Vehicle Equalisation Scheme Monitoring Report No. 16
The Australian Government spent $44.7 million in 2016–17 on the Bass Strait Passenger Vehicle Equalisation Scheme (the Scheme), and $44.1 million in 2015–16.
Under the Scheme passengers travelling with a vehicle across Bass Strait can receive a rebate applied against the vehicle fare charged by a ferry operator.
Over the two-year monitoring period we estimate that:
- The number of sea passengers with a motor vehicle may have been 29.0% higher than without the Scheme.
- Just under 26 450 additional visitors to Tasmania travelled by sea due to the Scheme in 2016–17 (27 650 new visitors in 2015–16).
These additional visitors to Tasmania spent an estimated $71.4 million in 2016–17 ($74.6 million in 2015–16).
Freightline 5—Australian cotton freight transport
The Freightline series is intended to provide information on interregional freight movements across Australia, filling a major gap in Australian transport-related data and information, to help better inform and support policy development and infrastructure planning. Freightline 1 provides a broad overview of the freight task. Subsequent issues consider specific commodity freight tasks, and include more detailed information about the size and location of major freight movements, supply chain composition and key infrastructure components. This issue (Freightline 5) focusses on Australian cotton transport supply chains and freight movements in 2015–16.
- Freightline 5–Australian cotton freight transport
Freightline 4—Australian coal freight transport
The Freightline series is intended to provide information on interregional freight movements across Australia, filling a major gap in Australian transport-related data and information, to help better inform and support policy development and infrastructure planning. The Freightline series begins with a broad overview of the freight task, followed by separate commodity-specific issues that provide more detailed information about the size and location of major freight movements, supply chain composition and key infrastructure components. Freightline 4 (this issue) focusses on Australian coal transport supply chains and freight movements in 2014–15.
- Freightline 4–Australian coal freight transport
Bass Strait Passenger Vehicle Equalisation Scheme Monitoring Report No. 15
The Ministerial Directions governing the Bass Strait Passenger Vehicle Equalisation Scheme require us to produce a monitoring report every 2 years. Over the monitoring period (2013–14 to 2014–15):
- The Australian Government spent $40.9 million in 2014–15 on the Scheme, up 9.1% from 2013–14, and $37.5 million in 2013–14 (up 14.3% on 2012–13).
- The number of sea passengers with a motor vehicle may have been 23.6% higher than without the Scheme.
- Just under 18 000 new visitors to Tasmania travelled by sea due to the Scheme in 2014–15 (up from 14 500 new visitors in 2013–14).
- New visitors to Tasmania spent an estimated $50.2 million in Tasmania in 2014–15 (up from an estimated $39.0 million in 2013–14).
Freightline 3—Australia sugar freight transport
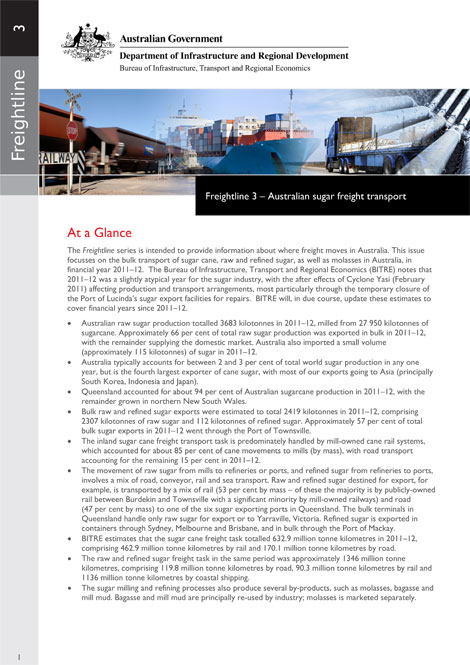
The Freightline series is intended to provide information on interregional freight movements across Australia, filling a major gap in Australian transport-related data and information, to help better inform and support policy development and infrastructure planning. The Freightline series begins with a broad overview of the freight task, followed by separate commodity-specific issues that provide more detailed information about the size and location of major freight movements, supply chain composition and key infrastructure components. Freightline 3 (this issue) focusses on Australian sugar-related transport supply chains and freight movements in 2011–12.
- Freightline 3–Australia sugar freight transport
Freightline 2—Australia iron ore freight transport
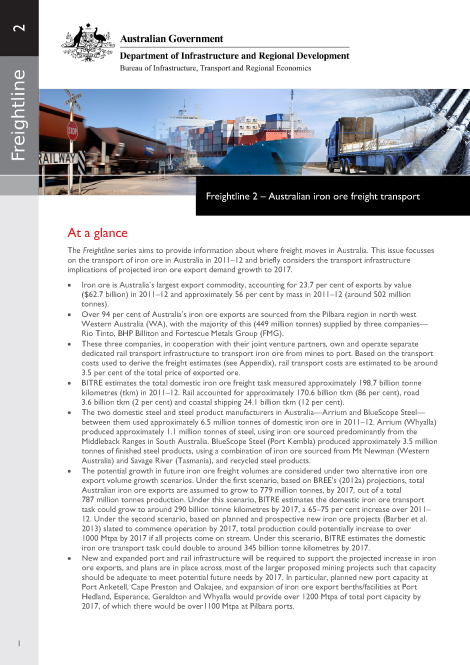
The Freightline series is intended to provide information on interregional freight movements across Australia, filling a major gap in Australian transport-related data and information, to help better inform and support policy development and infrastructure planning. The Freightline series begins with a broad overview of the freight task, followed by separate commodity-specific issues that provide more detailed information about the size and location of major freight movements, supply chain composition and key infrastructure components. Freightline 2 (this issue) focusses on Australian iron ore transport supply chains and freight movements in 2011–12.
- Freightline 2–Australia iron ore freight transport
Bass Strait Passenger Vehicle Equalisation Scheme Monitoring Report No. 14
The Ministerial Directions governing the Bass Strait Passenger Vehicle Equalisation Scheme require us to produce a monitoring report every 2 years. The monitoring report pays specific regard to the movement of fare prices and the movement of the number of eligible passengers and the number of eligible passenger vehicles.
Population growth, jobs growth and commuting flows—a comparison of Australia's four largest cities
This is the first comparative study of spatial changes in population, jobs and commuting patterns within Australia's largest cities. It focuses on recent patterns of change in Sydney, Melbourne, Brisbane and Perth, while also presenting an overview of change in other capital cities and regional cities between 2001 and 2011. The report identifies some common trends and differences across the cities, and investigates the extent to which these recent spatial changes match up to the stated strategic planning goals for the four largest cities.
- Population growth, jobs growth and commuting flows–a comparison of Australia's four largest cities
Population growth, jobs growth and commuting flows in South East Queensland
The South East Queensland report discusses changes in the geography of population and employment and the impacts on commuting, with a view to providing a solid evidence base about the trends that have been shaping the region in recent years. The analysis focuses on changes between 2001 and 2011 (wherever data is available). Further, it explores changes at a range of geographical scales to convey an understanding of the overarching patterns as well as some of the finer details. It also investigates the trends in relation to the relevant strategic planning goals.
- Population growth, jobs growth and commuting flows in South East Queensland
State and Capital City vehicle kilometres travelled, 1990–2012
This information sheet presents estimates of vehicle kilometres travelled in Australia from 1990 to 2012 and vehicle fuel intensity estimates for the same time period. These estimates are presented by vehicle type by fuel type by state, and have also been prepared for capital cities. The information sheet outlines the methodology used to construct these estimates together with an overview of the estimates. The electronic data tables present complete VKT data at a disaggregated level for use in further analysis.
- State and Capital City vehicle kilometres travelled, 1990–2012
- State and Capital City vehicle kilometres travelled, 1990–2012–tables

]