Road Trauma Involving Heavy Vehicles—Annual Summaries
This report presents detailed information on fatal crashes involving heavy vehicles and forms an important part of the evidence base. See also the Quarterly bulletins.
Latest Year: 2021
- Road Trauma Involving Heavy Vehicles 2021 - Dashboard
2021 : At a glance
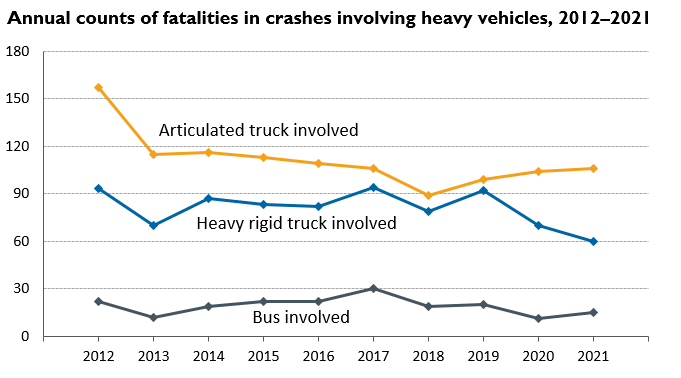
Annual counts of fatalities in crashes involving heavy trucks, 2012–2021
- In 2021, a total of 163 people were killed in crashes involving heavy trucks. This represents 15.4 per cent of total road deaths.
- Of the people killed in these fatal crashes, approximately 50 per cent are occupants in a light vehicle, 25 per cent are occupants in the heavy truck and 25 per cent are other road users (pedestrian, motorcyclist or pedal cyclist).
- The latest hospitalisation data (2019) shows that approximately 510 heavy truck occupants are hospitalised from road crashes each year.
Annual counts of fatalities in crashes involving a bus, 2012–2021
- There was a total of 15 people killed in crashes involving a bus. The trend over the last three years shows a reduction of 13.4 per cent per year.
- Of the people killed in these bus-involved fatal crashes, approximately 11 per cent are occupants of the bus, 33 per cent are occupants of a light vehicle and 57 per cent are other road users.
- Approximately 254 bus occupants are hospitalised from crashes each year.
Data presented in this publication was correct as at January 2023. Due to normal ongoing revisions in road deaths data, comparisons between this publication and later reports will result in minor discrepancies.
Archives
Road safety: modelling a global phenomenon
This report provides an overview of the different patterns of road fatality and injury rates in 21 countries, and their determinants.
The main result of the study are models of road fatality rates as a function of seat belt wearing rates, enforcement activities regarding speed (using speed cameras) and alcohol (with random breath testing), and economic influences (principally unemployment). Experience from around the world also shows that laws lowering speed limits and legal blood alcohol limits are effective in saving lives.
- Road safety: modelling a global phenomenon
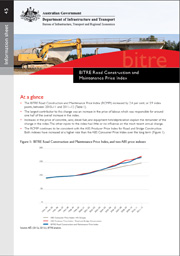
BITRE Road Construction and Maintenance Price Index and Sub-Indexes—2013 update
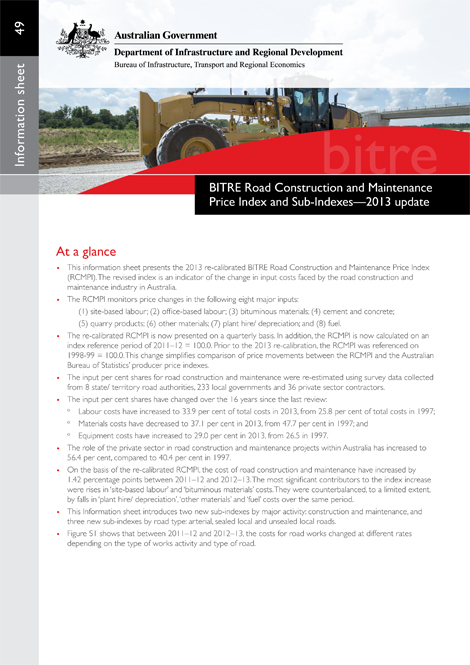
This information sheet presents the 2013 re-calibrated BITRE Road Construction and Maintenance Price Index and Sub-Indexes. The revised index is an indicator of the change in input costs faced by the road construction and maintenance industry in Australia. The sub-indexes show the change in road costs by road types and road works activities.
- BITRE Road Construction and Maintenance Price Index and Sub-Indexes–2013 update
Young Adult Road Safety—A Statistical Picture
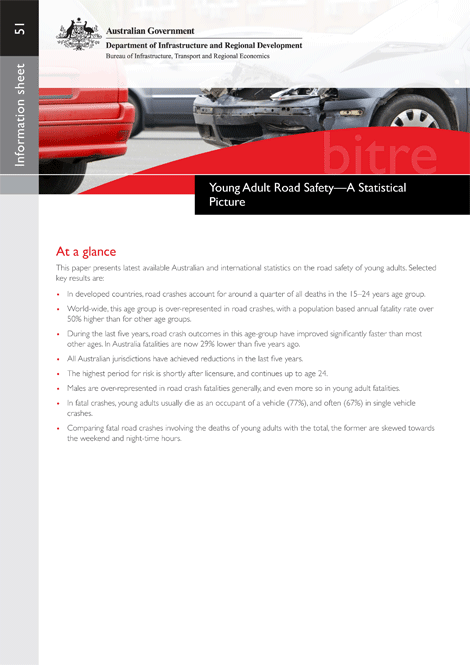
This information sheet presents latest available Australian and international statistics on the road safety of young adults.
- Young Adult Road Safety–A Statistical Picture
International Road Safety Comparisons—Annual
This report presents road deaths and road death rates for Organisation for Economic Co-operation and Development (OECD) nations and Australia. The rates allow for a comparison of Australia’s road safety performance with that of other OECD nations by accounting for the differing levels of population, motorisation and distances travelled. The latest available international data is for 2023.
Fatalities per 100,000 population is the measure specified in the UN Sustainable Development Goals (Indicator 3.61) to monitor road crash trauma.
Latest year: 2023
Archives
Road Trauma Australia—Annual Summaries
This report is the latest in the BITRE series of annual road crash statistical reports. It presents annual counts of road deaths, injuries and standardised rates.
Latest Year: 2024
Archives
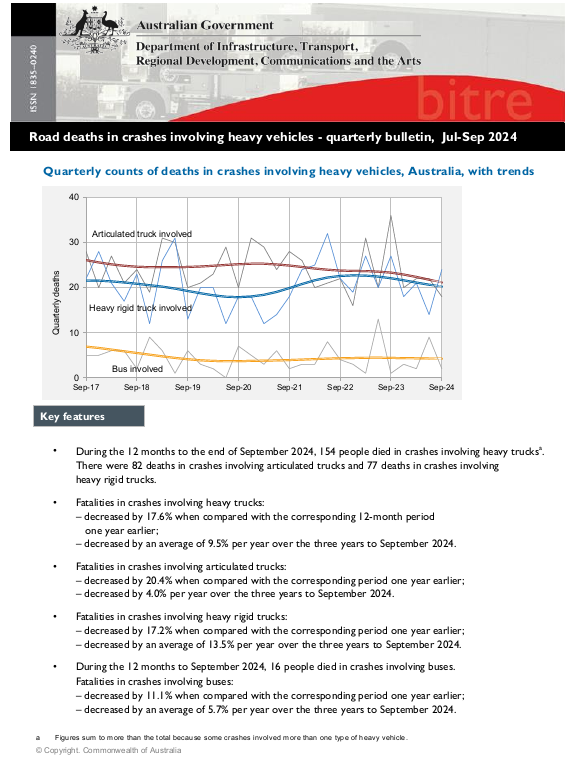
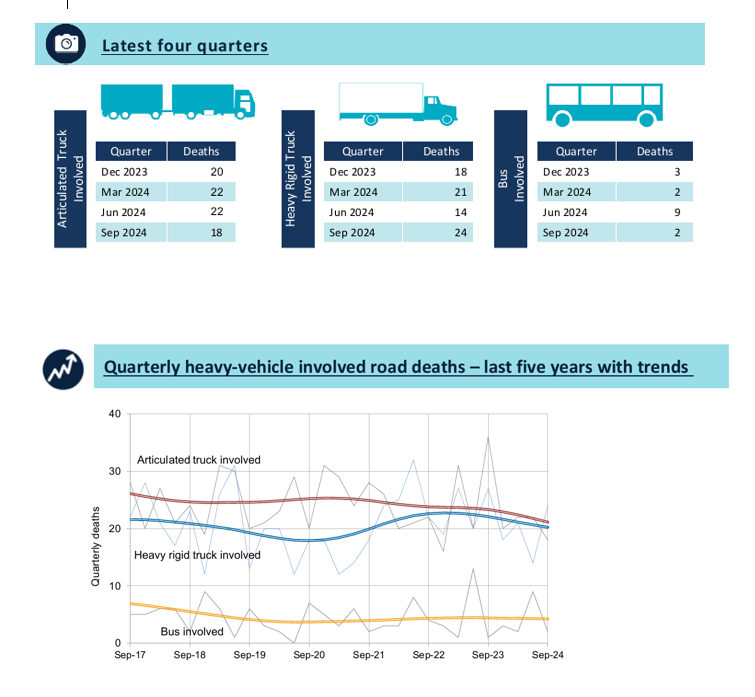
Road Deaths In Crashes Involving Heavy Vehicles—Quarterly Bulletins
This publication is now being published on the DITRDCSA Data Catalogue and the National Road Safety Data Hub.
A quarterly publication tracking counts of fatalities in crashes that involve heavy vehicles.
Latest Quarter: Jul-Sep 2024
Archives
Public transport use in Australia's capital cities, Modelling and forecasting
This report allows understanding on forecasting of city passenger travel by motor vehicles and urban public transport. It will aid planning and policy development regarding urban public transport and motor vehicle traffic in cities.
- Public transport use in Australia's capital cities, Modelling and forecasting
BITRE Road Construction and Maintenance Price Index—2012 update
This publication provides the 2012 update of BITRE's Road Construction and Maintenance Price Index.
- BITRE Road Construction and Maintenance Price Index–2012 update
State and Capital City vehicle kilometres travelled, 1990–2012
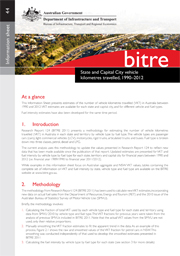
This information sheet presents estimates of vehicle kilometres travelled in Australia from 1990 to 2012 and vehicle fuel intensity estimates for the same time period. These estimates are presented by vehicle type by fuel type by state, and have also been prepared for capital cities. The information sheet outlines the methodology used to construct these estimates together with an overview of the estimates. The electronic data tables present complete VKT data at a disaggregated level for use in further analysis.
- State and Capital City vehicle kilometres travelled, 1990–2012
- State and Capital City vehicle kilometres travelled, 1990–2012–tables

]