Waterline 54—August 2014
Waterline reports on trends in (a) throughput, (b) container handling productivity on the waterfront and the land side of ports in Australia, and (c) the cost of importing and exporting containers. It covers both the unloading of container ships and the transport of containers from container terminals. In Waterline 54, rail throughput data provided by port authorities is incorporated in calculating the throughput and productivity indicators. This issue covers port terminal activity up to the December quarter 2013.
- Waterline No 54
Infrastructure, transport and productivity
This information sheet reviews trends in Australian productivity with a focus on the transport sector.
Well targeted investments in transport infrastructure result in productivity increases that benefit many other industries. The paper provides for specific examples that cover trucks, freight, waterfront and rail productivity enhancements.
- Infrastructure, transport and productivity
Waterline 53—January 2014
Waterline reports on trends in (a) throughput, (b) container handling productivity on the waterfront and the land side of ports in Australia, and (c) the cost of importing and exporting containers. It covers both the unloading of container ships and the transport of containers from container terminals. In Waterline 53, the format of the report has been revised and several new productivity measures have been introduced following consultation with industry. This issue covers port terminal activity up to the June quarter 2013.
- Waterline No 53
Bass Strait Passenger Vehicle Equalisation Scheme Monitoring Report No. 14
The Ministerial Directions governing the Bass Strait Passenger Vehicle Equalisation Scheme require us to produce a monitoring report every 2 years. The monitoring report pays specific regard to the movement of fare prices and the movement of the number of eligible passengers and the number of eligible passenger vehicles.
Tasmanian Freight Schemes—Parameter Review 2013
The Tasmanian Freight Equalisation Scheme operates according to Ministerial Directions (2012) using parameters recommended by the TFES Review Authority (1998). The Tasmanian Wheat Freight Scheme operates under separate Ministerial Directions approved on 25 January 2006.
Australian Sea Freight 2011–12
This is the latest in a series of Bureau of Infrastructure, Transport and Regional Economics (BITRE) reports that provide information on Australian sea freight movements, vessel activity, the use of coastal trading licences, and the size and composition of the Australian trading fleet. This report contains statistics on maritime freight and shipping activities in Australia from 2005–06 to 2011–12.
The report provides a profile of Australia's principal bulk ports and the logistics chain that delivers commodities through those ports. Efficient logistics are essential for these volumes, requiring substantial investment as well as good co-ordination of the different links in the logistics chain. These factors have been especially important in the last decade, with tonnage rising by over 75 per cent. The report illustrates the tasks performed at each port using the broad range of data and indicators that are published by port authorities and bulk terminal operators.
- Australia's Bulk Ports
Tasmanian Passenger and Freight movements
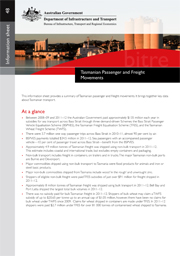
This information sheet provides a summary of Tasmanian passenger and freight movements in 2011–12. It brings together key data about Tasmanian transport from other Bureau publications and unpublished data sources.
- Tasmanian Passenger and Freight movements
Waterline 52—April 2013
This Waterline provides the latest data available on stevedoring productivity and landside performance at Australia's major container ports.
- Waterline No 52
- Landside Performance Indicators

- Stevedoring Productivity
- Port Interface Cost Index
- Ship Visits
- Port Performance–non-financials
- Stevedoring Ship Arrival Reliability
Waterline 51—November 2012
This Waterline provides the latest data available on stevedoring productivity and landside performance. Beginning with this issue, a new wharf side indicator is provided for each port. It measures the average number of crane lifts performed per hour spent in berth by a contained ship. Waterline is the main container port performance report referred to in the National Port Strategy.
- Waterline No 51