Changes in Australia's industry structure: cities and regions, 2006–2011
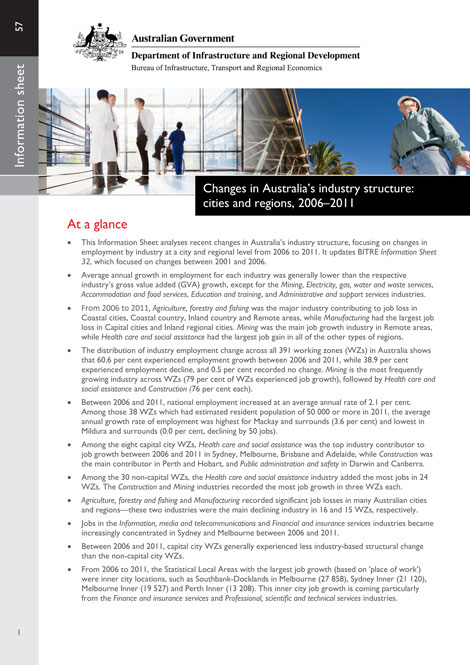
This Information Sheet identifies recent trends (2006 to 2011) in employment by various industries for regional areas, capital cities and non-capital cities. It updates BITRE's previous Information Sheet 32, which focused on employment changes between 2001 and 2006. The information presented in this publication will assist regional communities (including local government and RDAs) to understand how their regions are changing, and help regions map out where their opportunities and challenges might lie.
- Changes in Australia's industry structure: cities and regions, 2006–2011
International trade and cities: what house prices say
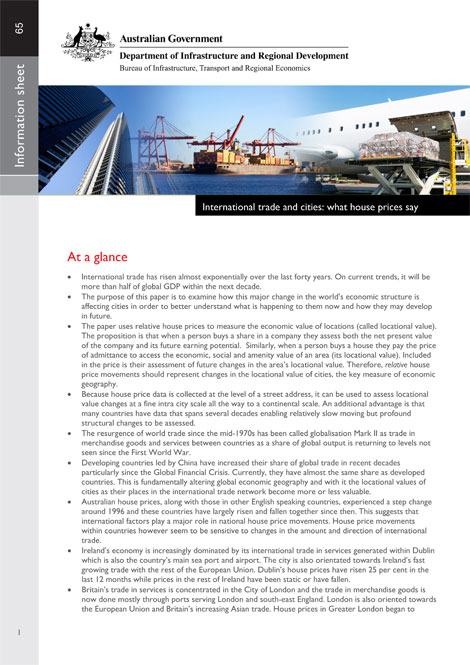
The relationship between changes in the value and direction of trade and house prices are examined for Ireland, Britain, Canada, the United States and New Zealand. It finds a strong relationship between trade patterns and locational value. Australia is examined at a continental scale. As Australias trade is steadily more focused on Asia, the values of those cities located in the north and west have risen faster than the rest.
- International trade and cities: what house prices say
International trade and Australian cities: what house prices say
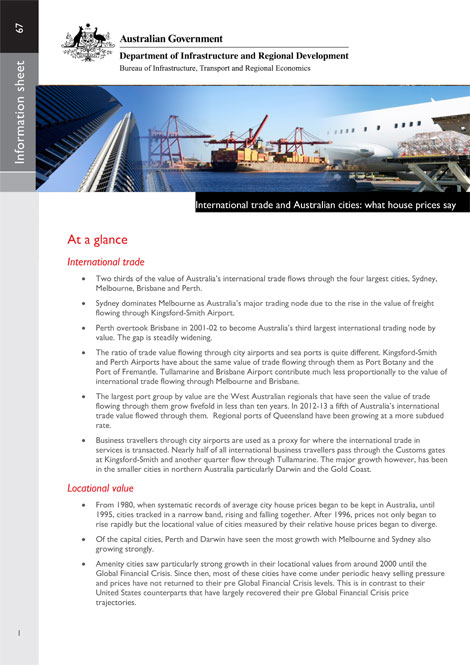
Information Sheet 67 opens with a brief discussion on recent insights into Australian international trade, particularly ways to better measure its real value. It then looks at the changes in the value of international trade flowing through individual sea and airports. Changes in locational value from 1992–2014 are then presented for each city. The relationship between trade patterns and locational values are then tested mathematically.
- International trade and Australian cities: what house prices say
New passenger vehicle fuel consumption trends, 1979 to 2013
The trends evident in BITRE's earlier Information Sheet (BITRE 2009) have continued since 2008. Vehicle sales have increased, with the SUV and LCV categories continuing to increase their shares. With the introduction of compact and more fuel-efficient 4WDs, the growing SUV category has shown a considerable reduction in rated fuel consumption. LCV sales have also been increasing, though not as strongly as SUVs, along with a similarly decreasing level (since about 2006) in rated fuel consumption.
In the past (before 2008), Australian consumers' preference for vehicle characteristics that typically increased fuel consumption (such as higher power, larger size, more accessories or 4WD capability), meant that potential reductions in fuel consumption made possible by technological advances were not fully realised. This has been a worldwide trend in the automobile sector. However, that said, the long-term downward trend in energy intensity has increased in recent years as the latest generation of more fuel efficient light vehicles (including hybrids) entered the market, and with some buyers moving to smaller vehicles as petrol prices rose. The result has been a marked acceleration, over recent years, of the downward trend in the rated fuel consumption (tested L/100km) of new vehicles sold.
- New passenger vehicle fuel consumption trends, 1979 to 2013
BITRE Road Construction and Maintenance Price Index—2014 update
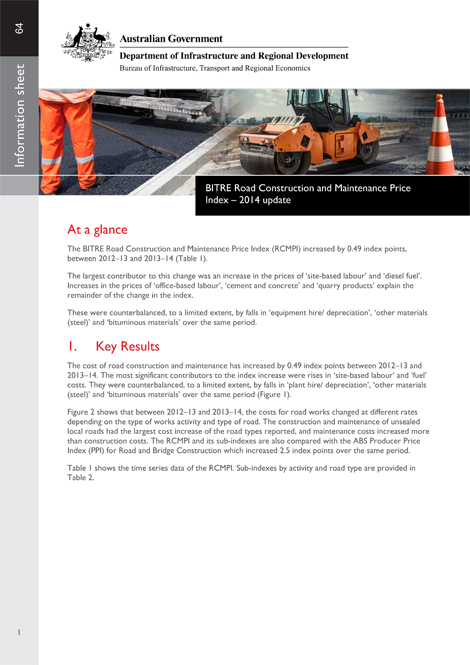
This Information Sheet presents the quarterly Road Construction and Maintenance Price Index figures for the year 2013–14. Additionally, it presents sub-indexes by activity type for road maintenance and road construction, and by road type for local sealed, local unsealed, and arterial roads.
- BITRE Road Construction and Maintenance Price Index–2014 update
Traffic on the national road network, 2011–12

This Information Sheet presents recent road traffic volumes across the Australian National Land Transport Network in 2011–12, based on data provided by States and Territories. It includes charts showing volumes of heavy and light vehicle traffic for all 21 non-urban corridors, and maps for the urban corridors.
- Traffic on the national road network, 2011–12
Major transport employment hubs
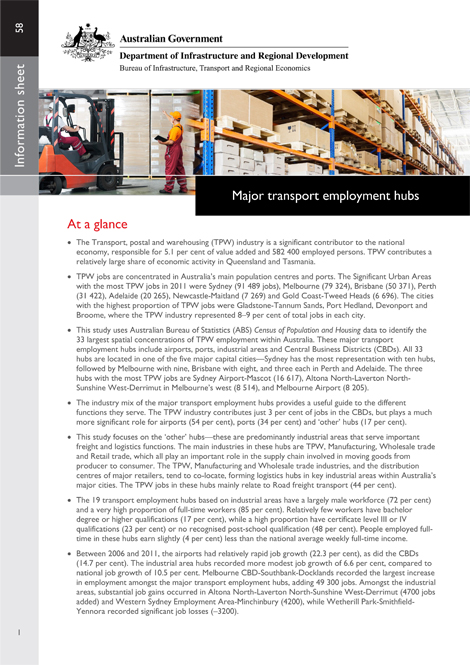
This Information Sheet identifies the 33 largest spatial concentrations of transport industry employment within Australia. These major transport employment hubs are all located within the five most populous capital cities and include airports, ports, CBDs and a range of industrial areas. This study presents evidence on the number of jobs located in each of these transport employment hubs, the industry mix of those jobs, and the characteristics of workers in each location. In particular, it focuses on investigating the nature of employment in the industrial area hubs, many of which serve important freight and logistics functions.
- Major transport employment hubs
National profile of Transport, postal and warehousing workers
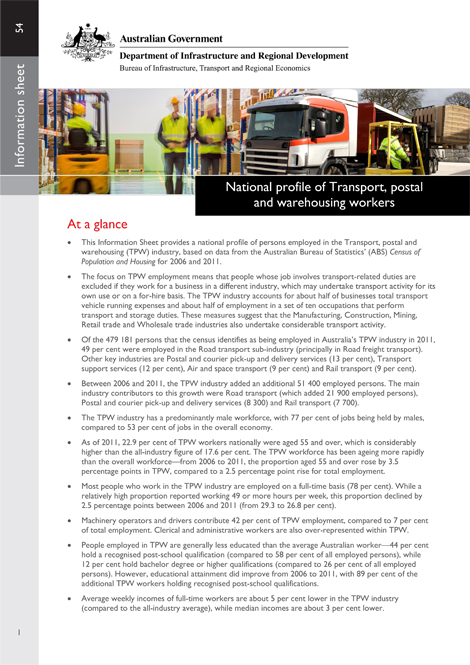
This study aims to improve understanding of the current characteristics of the Transport, postal and warehousing (TPW) workforce and how the workforce is evolving over time. It provides details of the sub-industries in which TPW workers are employed, their hours worked, gender, age, occupation, educational qualifications, income and commuting behaviour. It also describes some of the key changes that occurred between 2006 and 2011, such as the ageing and upskilling of the TPW workforce.
- National profile of Transport, postal and warehousing workers
Long-term trends in urban public transport

BITRE Information Sheet 60 provides detailed long-term trend statistics for Australian urban passenger transport. Historical time-series on passenger movement within the Australian capital cities, covering more than a century, contrast changes over time in patronage on urban public transport (UPT) systems with the corresponding patterns of private road vehicle use.
- Long-term trends in urban public transport
- Urban Transport Summary for 2013
- Latest urban transport statistics
Urban public transport: updated trends
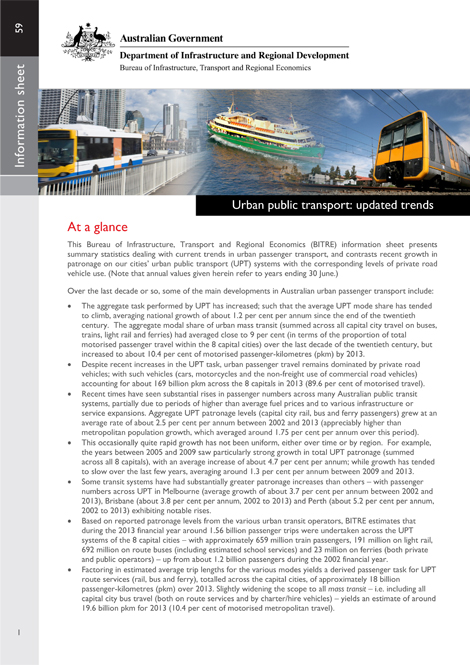
BITRE Information Sheet 59 summarises recent trends in Australian urban passenger transport–contrasting strong growth in urban public transport (UPT) over the last decade (with 2013 task levels almost 30 per cent higher than 2004) with that of private road vehicle use (with car travel in 2013 only about 3 per cent higher than 2004). Details or trend statistics are provided, across the State and Territory capital cities, for modal composition, travel growth rates, UPT cost recovery and transit service levels.
- Urban public transport: updated trends
- Urban Transport Summary for 2013
- Latest urban transport statistics