Freight vehicle congestion in Australia’s five major cities - 2019

This publication is the first of a planned annual series that uses vehicle telematics data to provide measures of traffic congestion for freight vehicles on 53 selected routes across Australia’s five mainland state capital cities—Sydney, Melbourne, Brisbane, Adelaide and Perth. The selected routes comprise the major motorways, highways and arterial roads within each city that service both passenger and freight vehicles. The estimates presented in this report cover calendar year 2019.
The results show peaks in freight vehicle average travel times coincide with morning and evening peak commuter flows—for instance motorways tend to show morning peaks moving towards city CBDs and afternoon peaks moving away from it. Urban motorways exhibit more distinct travel time peak periods than non-motorway routes.
Australia’s light vehicle fleet - some insights
This Information Sheet investigates how the characteristics of Australia’s light vehicle fleet vary across different types of regions, including States/Territories, major cities, city sectors, region types, and small areas. Vehicle characteristics considered include fuel type, average age, cylinders and tare weight. Specific types of vehicles, such as electric vehicles, sports utility vehicles and utilities are also examined. The study also identifies recent changes in the composition of Australia’s light vehicle fleet.
Regional port catchments for road freight
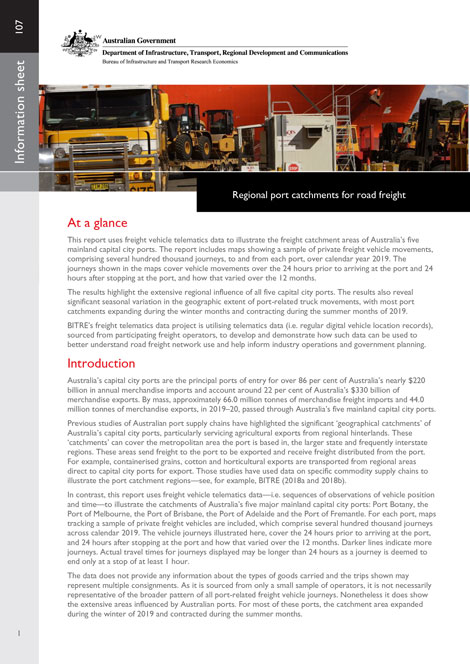
This Information Sheet uses freight vehicle telematics data to illustrate the freight catchment areas of Australia’s five mainland capital city ports. The report includes maps showing a sample of private freight vehicle movements, comprising several hundred thousand journeys, to and from each port, over calendar year 2019. The maps cover the 24 hours prior to arriving at the port and 24 hours after stopping at the port. The results highlight the extensive regional influence of all five capital city ports and also reveal significant seasonal variation in the geographic extent of port-related truck movements.
Impact of COVID-19 on petrol prices in Australia
Australian retail petrol prices are primarily determined by international world oil prices and overseas refined petroleum prices, and variations in exchange rates. As a result of COVID-19 restrictions imposed around the wold, demand for crude oil and refined petroleum products decreased significantly from mid-March 2020 onwards, and led to sharp decreases in crude oil and refined product prices.
The analysis presented in this paper outlines the principal components of Australian retail petrol prices, the impact of COVID-19 on weekly petrol prices and also the typically observed time lag between international refined petroleum product prices and domestic retail petrol prices.
Freight route performance under COVID-19
This Information Sheet provides estimates of the impact of the COVID-19 pandemic on freight vehicle travel times for selected routes in Australian major cities in early 2020. The results show that whilst there was no significant change in freight vehicle traffic volumes over that period, freight vehicles experienced shorter and more predictable travel times on many urban freight routes, primarily due to reduced commuting trips. This helped the freight industry to maintain supply chains during the initial stages of the pandemic. The data underlying the estimates is from the BITRE freight telematics program collection, which is sourcing vehicle position data from a small number of road freight operators.
- Freight route performance under COVID-19
Experimental analysis of networked service provision and hierarchies
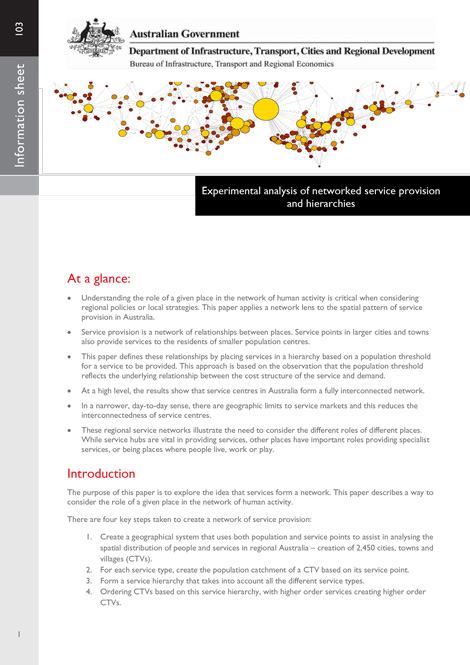
Understanding the role of a given place in the network of human activities is critical when considering regional policies or local strategies. This paper applies a network lens to the spatial pattern of service provision in Australia. It considers the locations of services and their distribution in order to approximate catchment populations, develop population thresholds for each service, and order each service type. From there, the paper establishes a hierarchy of cities, towns and villages and uses this to explore connections between them.
- Experimental analysis of networked service provision and hierarchies
National profile of Transport, postal and warehousing workers in 2016
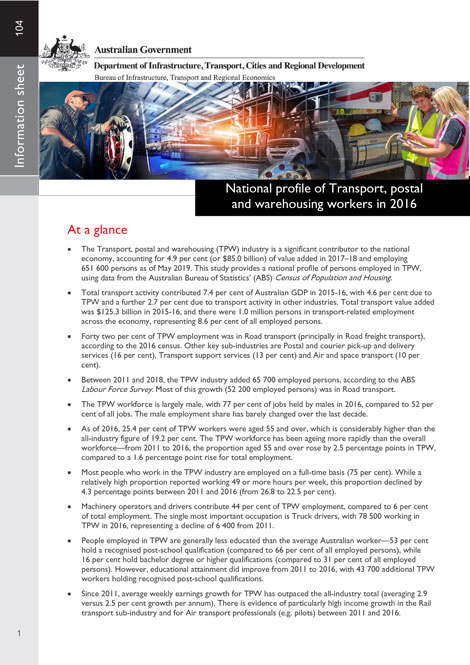
This information sheet is an update of BITRE's previous study on the same subject (BITRE Information Sheet 54) which used ABS 2011 census data. This study used ABS 2016 census data and provides details of the sub-industries in which TPW workers are employed, their employment status, hours worked, gender, age, occupation, educational qualifications, income, work location and commuting behaviour. It also describes some of the key changes that have occurred since 2011, such as the ageing and upskilling of the TPW workforce.
- National profile of Transport, postal and warehousing workers in 2016 [PDF: 863 KB]
National profile of Heavy and civil engineering construction workers in 2016
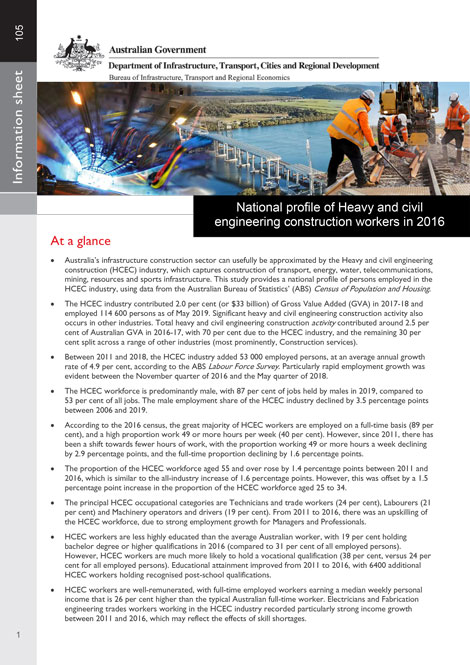
This study explores details of the sub-industries in which HCEC workers are employed, their employment status, hours worked, gender, age, occupation, educational qualifications, income, work location and commuting behaviour. It also describes some of the key changes that have occurred since 2011, including the changing gender mix and the upskilling of the HCEC workforce.
- National profile of Heavy and civil engineering construction workers in 2016
Relationship between transport use and income in Australia
This Information Sheet explores the relationship between income and transport use in Australia by identifying the nature of the relationship between income and different types of transport use, and how public transport use (especially rail) varies with income in different locations. The information presented in this publication will be useful to understand the equity implications of government investment in transport infrastructure, particularly new urban rail infrastructure and implementation of regional development policy for regional cities located within commuting distance of the capital cities.
- Relationship between transport use and income in Australia
Economies of scope and regional services
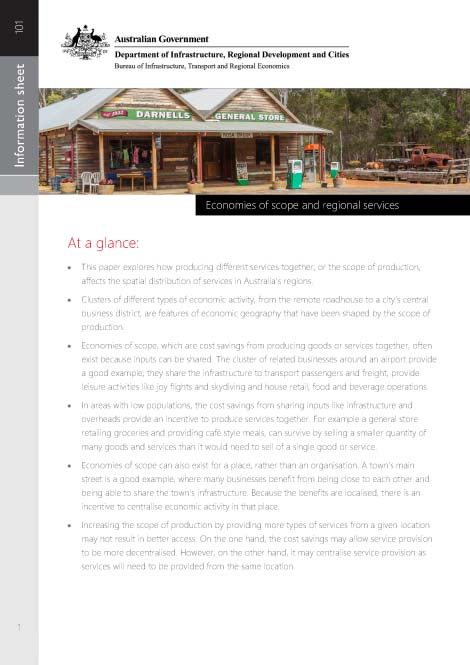
This paper explores how producing different services together, or the scope of production, affects the spatial distribution of services in Australia's regions. Clusters of different types of economic activity, from the remote roadhouse to a city's central business district, are features of economic geography that have been shaped by these economic forces.
- Economies of scope and regional services