International airline activity - summary
Summary
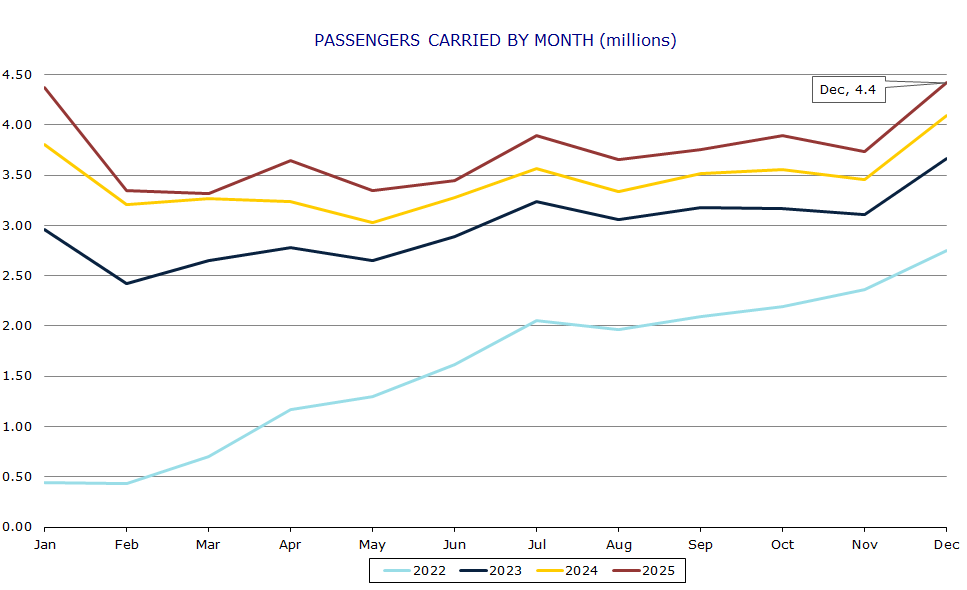
Sixty-two international airlines operated scheduled services to/from Australia during the month (includes three dedicated freight airlines but excludes airlines operating only via code share arrangements).
International scheduled passenger traffic in December 2025 was 4.420 million compared to 4.093 million in December 2024 – an increase of 8.0%.
Passenger traffic for the year ended December 2025 was 44.841 million which is a 8.4% increase over the figure for the year ended December 2024 (41.358 million).
Total seats made available on international scheduled operations to/from Australia during December 2025 were 5.416 million – an increase of 8.5% compared to December 2024. The overall seat utilisation percentage was 83.2% in December 2025. It was 83.7% in December 2024 and 80.1% in December 2023.
Summary of year-on-year activity
| Year ended December 2024 | Year ended December 2025 | Change | |
|---|---|---|---|
| Total passenger movements (million) | 41.358 | 44.841 | 8.4% |
Summary of month-on-month activity
| December 2024 | December 2025 | Change | |
|---|---|---|---|
| Passengers carried (million) | 4.093 | 4.420 | 8.0% |
| Freight (tonnes) | 101 580 | 99 928 | -1.6% |
| Mail (tonnes) | 2 910 | 2 721 | -6.5% |
| Available Seats (million) | 4.991 | 5.416 | 8.5% |
| Flights | 19 253 | 20 959 | 8.9% |
| Aircraft Movements | 19 737 | 21 257 | 7.7% |
Airline On Time Performance, 2025 Calendar Year
Summary – 2025 Calendar Year
For the year ended December 2025, on time performance (OTP) over all routes operated by participating airlines (Hinterland, Jetstar, Qantas, QantasLink, Rex Airlines, Skytrans Australia (formerly Smartlynx Australia), Virgin Australia and Virgin Australia Regional Airlines) averaged 76.9 per cent for on time arrivals and 77.7 per cent for on time departures. The cancellation rate for the year was 2.5 per cent. The equivalent figures for 2024 were 74.6 per cent for on time arrivals, 75.4 per cent for on time departures and 2.6 per cent for cancellations. Airlines’ on time performance varies across the routes they serve. Individual route data by specific airline for 60 routes which operated for at least part of the 2025 calendar year are shown on pages 9-21.
The 2025 on time arrivals figure was lower than the long-term average (average over the period of OTP reporting starting in November 2003) performance for all routes (80.5 per cent) and the on-time departures figure was also lower than the long-term average (81.6 per cent). The rate of cancellations was higher than the long-term average of 2.2 per cent.
On time arrivals
The Qantas network (Qantas and QantasLink combined operations) recorded 77.9 per cent for on time arrivals while the Virgin Australia network (Virgin Australia and Virgin Australia Regional Airlines combined operations) recorded 76.0 per cent. Hinterland achieved the highest on time arrivals at 88.4 per cent, followed by Skytrans Australia at 85.1 per cent, QantasLink at 78.3 per cent, Qantas at 77.2 per cent, Virgin Australia at 76.0 per cent, Jetstar at 75.2 per cent, Rex Airlines at 73.0 per cent and Virgin Australia Regional Airlines at 71.5 per cent.
On time departures
The Qantas network recorded 78.8 per cent for on time departures while the Virgin Australia network recorded 77.0 per cent. Hinterland achieved the highest level of on time departures for 2025 at 92.5 per cent, followed by Skytrans Australia at 86.3 per cent, Qantas at 79.7 per cent, QantasLink at 78.3 per cent, Virgin Australia at 77.2 per cent, Rex Airlines at 76.0 per cent, Jetstar at 73.6 per cent and Virgin Australia Regional Airlines at 67.6 per cent.
Cancellations
Skytrans Australia recorded the highest percentage of cancellations at 8.4 per cent during the year. The second highest cancellation rate was from QantasLink at 3.6 per cent, followed by Qantas at 2.7 per cent, Rex Airlines at 2.5 per cent, Jetstar at 2.2 per cent, Virgin Australia at 1.7 per cent, Virgin Australia Regional Airlines at 1.1 per cent and Hinterland at 0.8 per cent.
Routes
Of the 60 routes which met the criteria for OTP reporting, the Townsville-Cairns route (Jan 2025 only) had the highest percentage of on time arrivals (90.9 per cent) and the highest percentage of on time departures (90.9 per cent). For those routes reporting for the entirety of 2025, Emerald-Brisbane had the highest percentage of on time arrivals (89.8 per cent) and the highest percentage of on time departures (88.4 per cent). The Hamilton Island-Sydney route had the lowest percentage of on time arrivals (60.8 per cent) and the lowest percentage of on time departures (61.6 per cent).
Cancellations were highest on the Canberra-Sydney route at 6.2 per cent, followed by the Sydney-Canberra route at 5.6 per cent, the Port Lincoln-Adelaide and Sydney-Melbourne routes at 4.4 per cent, the Port Macquarie-Sydney and Melbourne-Sydney routes at 4.3 per cent, the Adelaide-Port Lincoln and Gladstone-Brisbane routes at 4.1 per cent, the Sydney-Port Macquarie route at 4.0 per cent and the Devonport-Melbourne route at 3.9 per cent.
Cancellations were lowest on the Melbourne-Ayers Rock at 0.0 per cent, followed by the Sydney-Hamilton Island route at 0.1 per cent, Ayers Rock-Melbourne and Sydney-Cairns routes at 0.3 per cent, and the Perth-Newman and Melbourne-Sunshine Coast routes at 0.4 per cent.
Airports
Of the airports with OTP reporting for 2025, Emerald Airport recorded the highest percentage of on time arrivals (86.2 per cent) and the highest percentage of on time departures (88.4 per cent). Port Macquarie Airport recorded the lowest percentage of on time arrivals (70.0 per cent) and Broome Airport recorded the lowest percentage of on time departures (64.8 per cent). These figures only refer to reported routes and do not cover all flights at these airports.
Table 1: Total Industry On Time Performance for - 2025
| Reporting Airlines | Sectors Scheduled | Arrivals On Time % | Departures On Time % | Cancellations % |
|---|---|---|---|---|
| Hinterland | 18,415 | 88.4 | 92.5 | 0.8 |
| Jetstar | 96,686 | 75.2 | 73.6 | 2.2 |
| Qantas - all QF designated services | 231,962 | 77.9 | 78.8 | 3.2 |
| Rex Airlines | 52,716 | 73.0 | 76.0 | 2.5 |
| Skytrans Australia (formerly SmartLynx Australia) | 6,191 | 85.1 | 86.3 | 8.4 |
| Virgin Australia - all VA designated services | 145,379 | 76.0 | 77.0 | 1.7 |
| All Airlines | 551,349 | 76.9 | 77.7 | 2.5 |
| Individual operating entities | ||||
| Qantas | 88,886 | 77.2 | 79.7 | 2.7 |
| QantasLink | 143,076 | 78.3 | 78.3 | 3.6 |
| Virgin Australia | 143,031 | 76.0 | 77.2 | 1.7 |
| Virgin Australia Regional Airlines | 2,348 | 71.5 | 67.6 | 1.1 |
Figure 1. Total Industry Arrivals and Departures On Time by month from December 2020

Figure 2. Total Industry Cancellations by month from December 2020

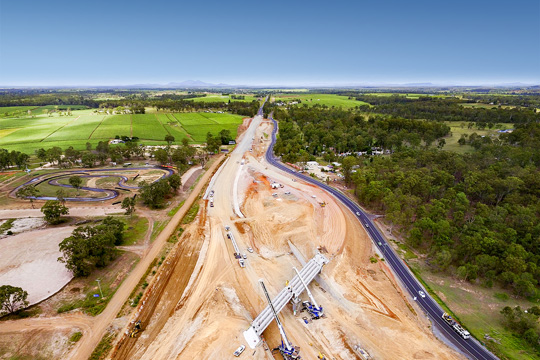
Australian Infrastructure and Transport Statistics Yearbook 2025: road chapter
Chapter 4
- Australian Infrastructure and Transport Statistics Yearbook 2025 - Download full report PDF
- Road—Yearbook 2025 (266 KB) - Download Excel file
- For information on road-related revenue and expenditure - see chapter 3 of the 2025 Yearbook
This chapter provides information on Australian roads including length, use, the vehicle fleet, and the number of vehicle licences.
- An estimated 264 billion vehicle kilometres were travelled on Australia's roads in 2024–25.
- In 2024, there were 476,000 km of paved roads in Australia.
- 20 million Australians had vehicle licences at 2024–25.
- In 2024–25, Sports Utility Vehicles (SUVs) comprised 59% of new motor vehicle sales (excluding motorcycles) compared with only 33% ten years earlier.
Figure 8 shows total vehicle kilometres by vehicle type. Figure 9 shows Australia’s national road network. Total vehicle kilometres travelled fell significantly during the COVID pandemic, only surpassing their previous 2017–18 peak in 2023–24.
Figure 8 Vehicle kilometres travelled by vehicle type
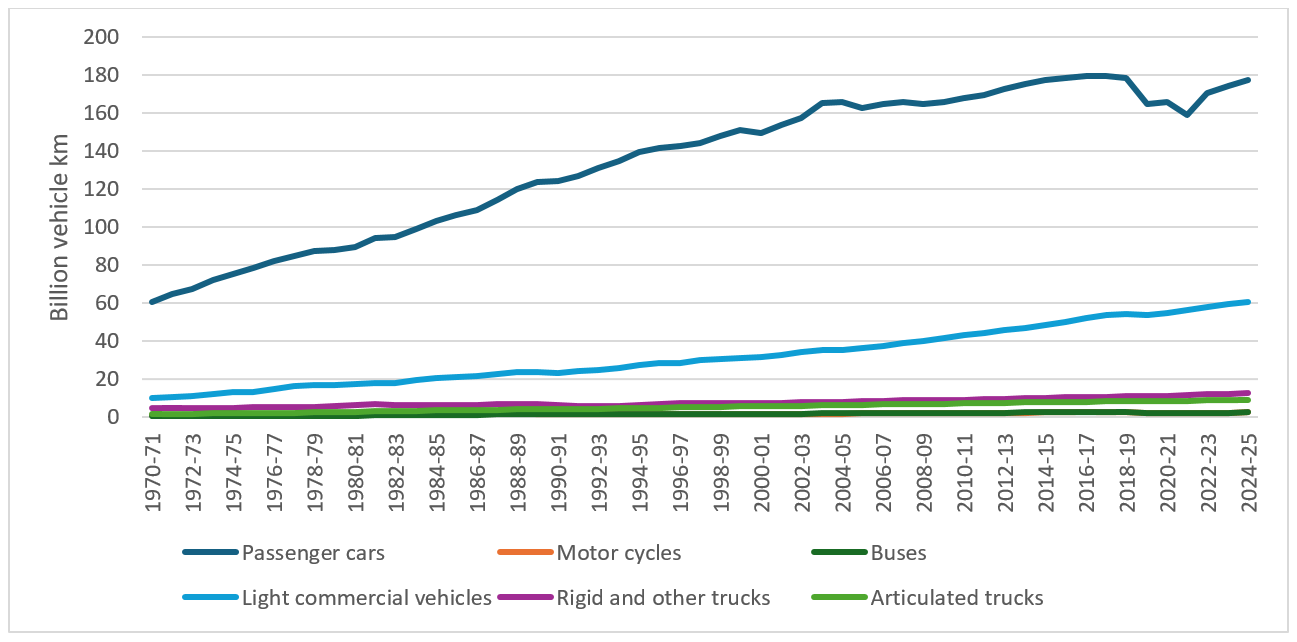
Source: Table 4.2
Figure 9 Map of national road network
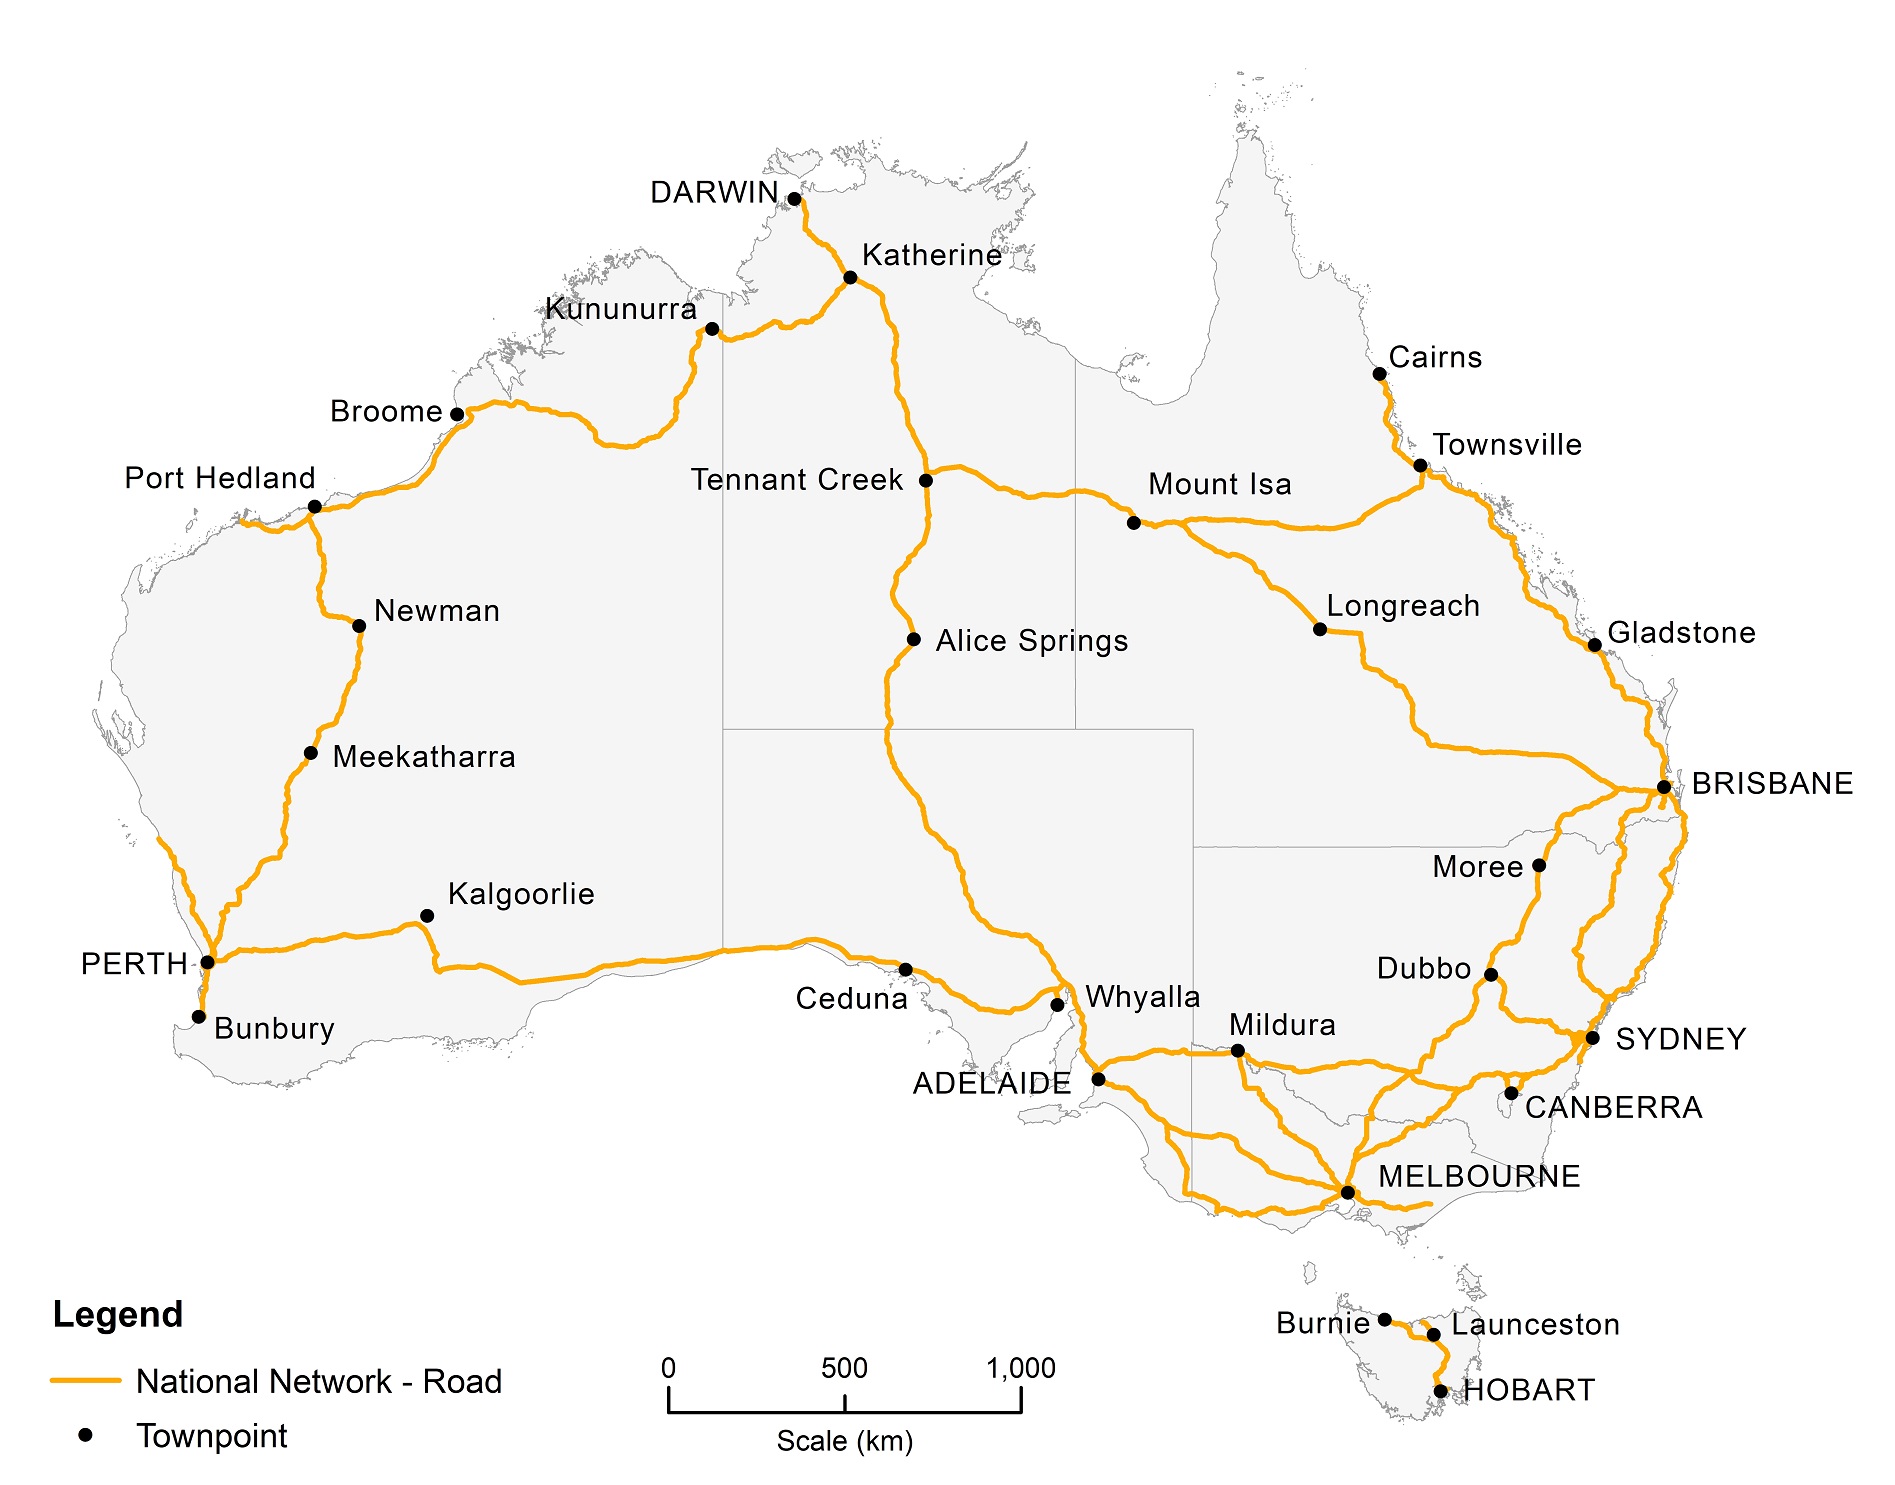
Source: DITRDCSA, 2022
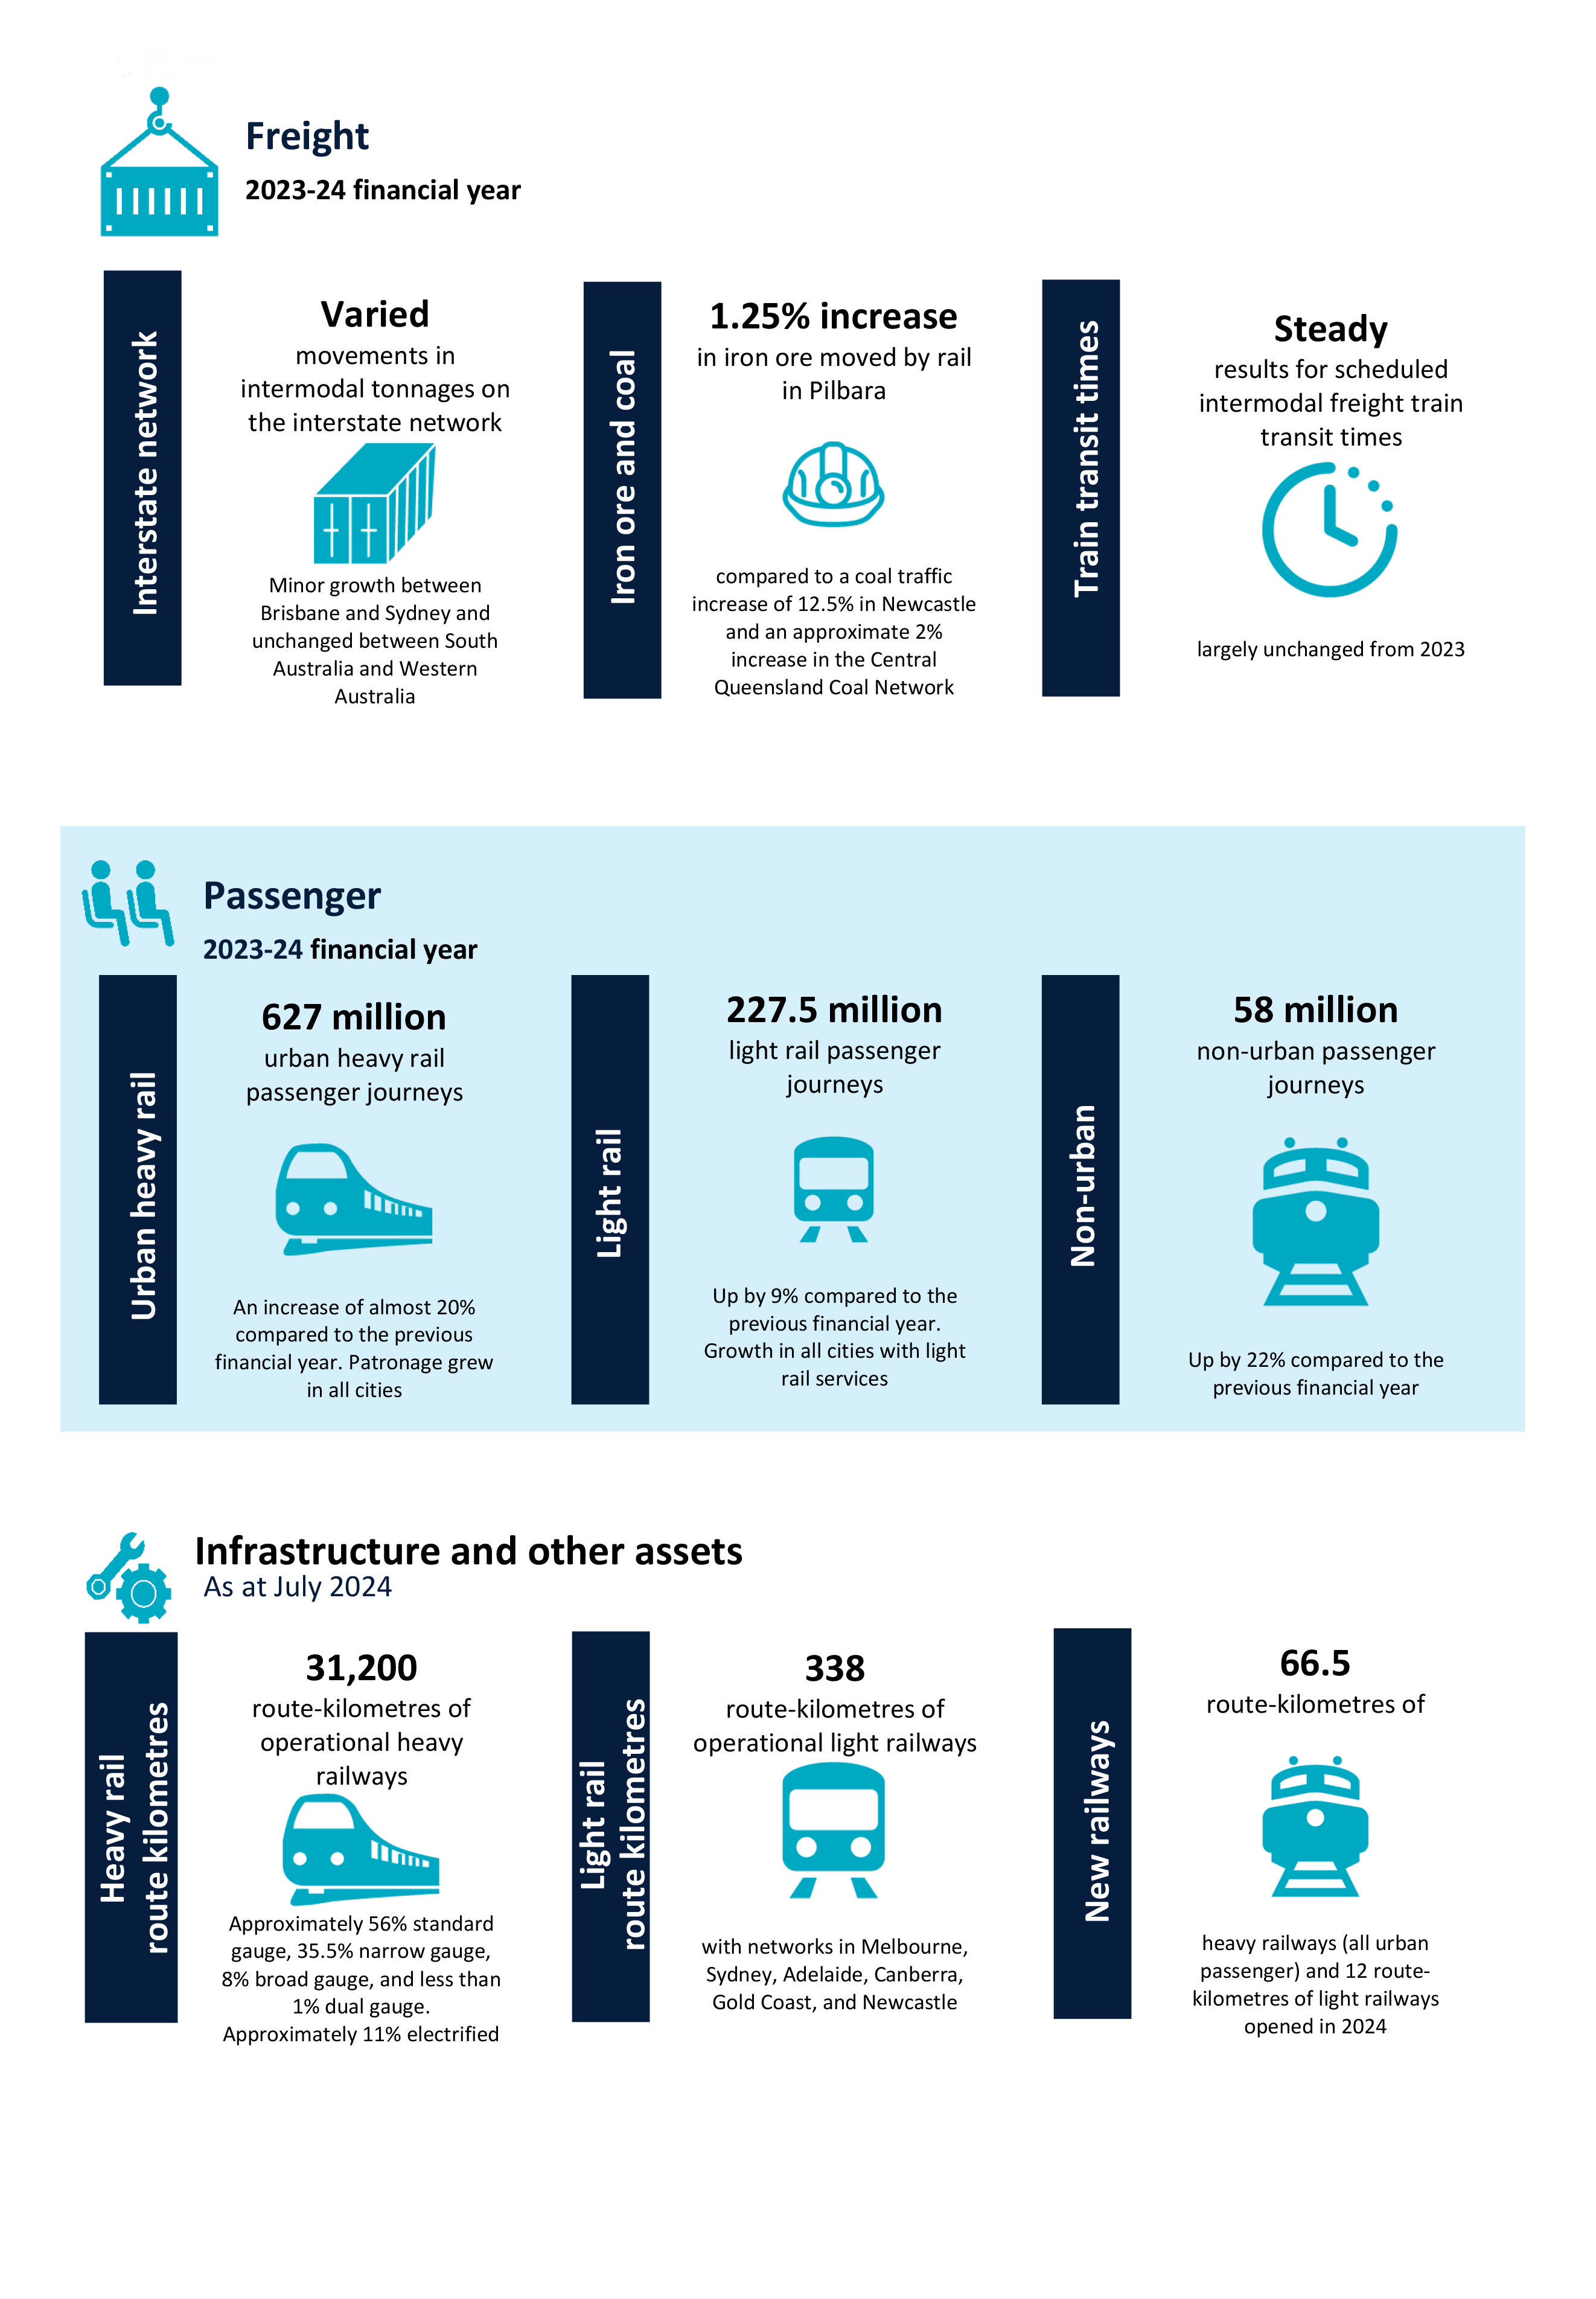
Trainline is a compendium of Australia's railways, providing insights, analysis and an understanding of the railway industry. Australia's railways are evolving via changes inside and outside the industry, including changes in logistics, commodity flows, technology, urban patronage and regional passenger services.
Australian Sea Freight 2023-24
Statistical reports providing information on Australian sea freight movements, vessel activity, the use of coastal trading licences and the size and composition of the Australian trading fleet.
Waterline reports on trends in throughput, container handling productivity on the waterfront and landside of ports in Australia and the cost of importing and exporting containers via five major container ports.
Australian Infrastructure and Transport Statistics Yearbook 2025: rail chapter
Chapter 5: Rail
- Australian Infrastructure and Transport Statistics Yearbook 2025 - Download PDF
- Rail—Yearbook 2025 (99 KB) - Download Excel file
This chapter provides information on rail expenditure, activity and network lengths. Estimates of passenger kilometres up to 2024-25 can be found in Chapter 2 - Passengers.
- People in Melbourne use light rail more than any other city with 155 million passengers in 2023–24.
- People in Sydney use heavy rail more than any other city with 352 million passengers in 2023–24.
- In 2023-24 there were $36 billion of public rail-related expenditure.
Figure 10 shows Australia’s network of railways by gauge and Figure 11 shows rail public transport patronage by million passenger movements. This refers to all trips on suburban rail networks and is based on reporting from train operators. Passenger movements were trending upwards in Sydney, Melbourne, Perth and Adelaide before starting to fall sharply in 2019–20 due to the COVID-19 pandemic. By 2023–24 patronage numbers had generally still not returned to 2018–19 levels.
Figure 10 Australia’s railways, by gauge
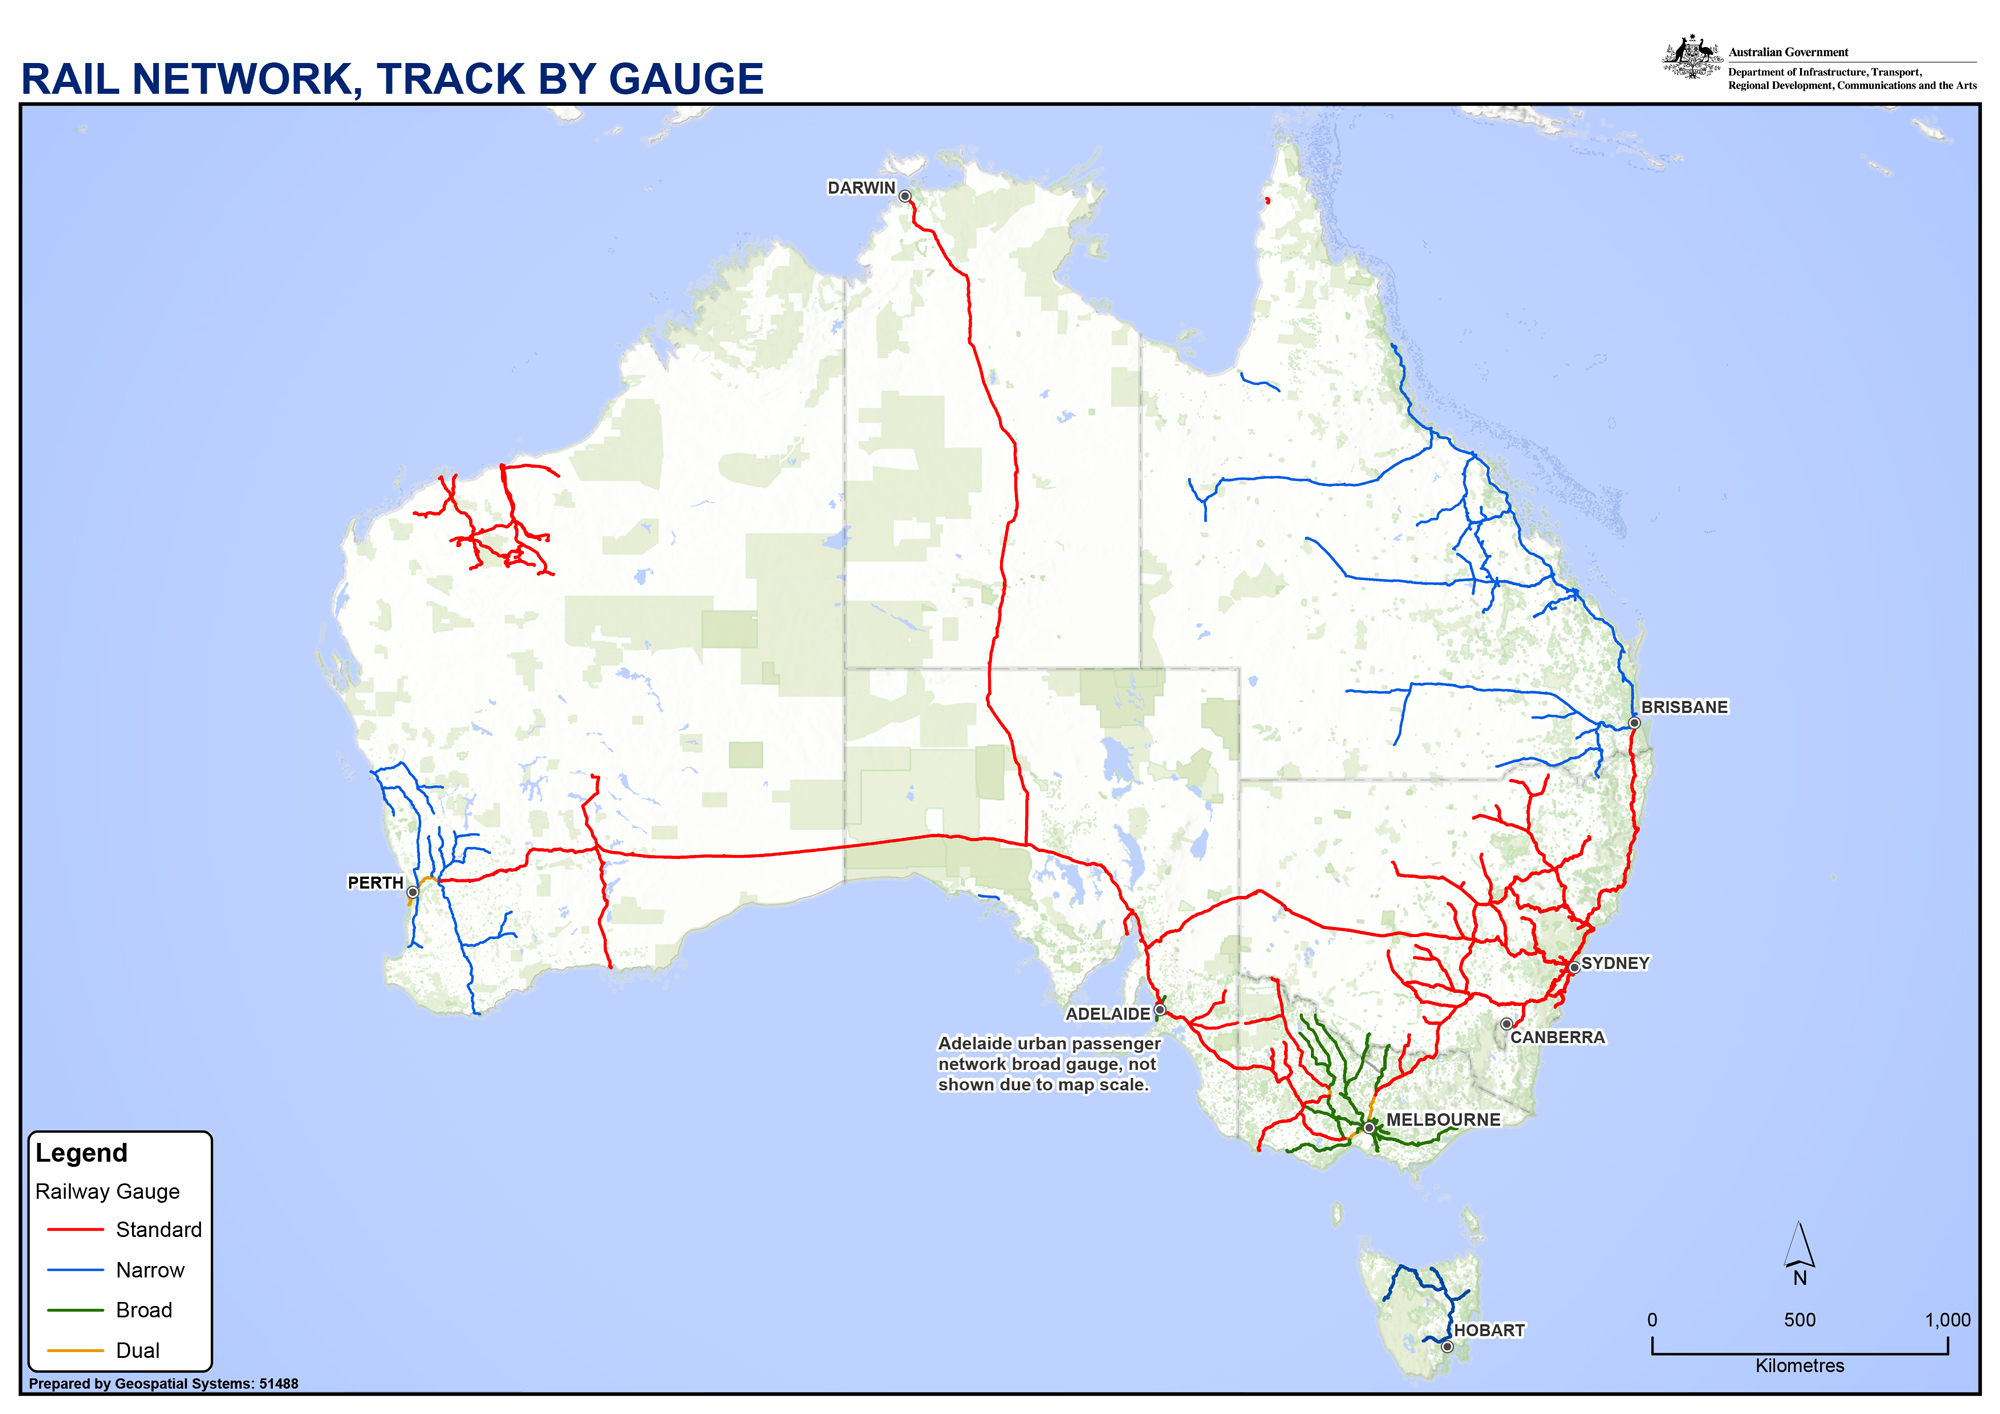
Source: BITRE (2025), Trainline 12
Figure 11 Public transit patronage on heavy rail, Australian capital city networks
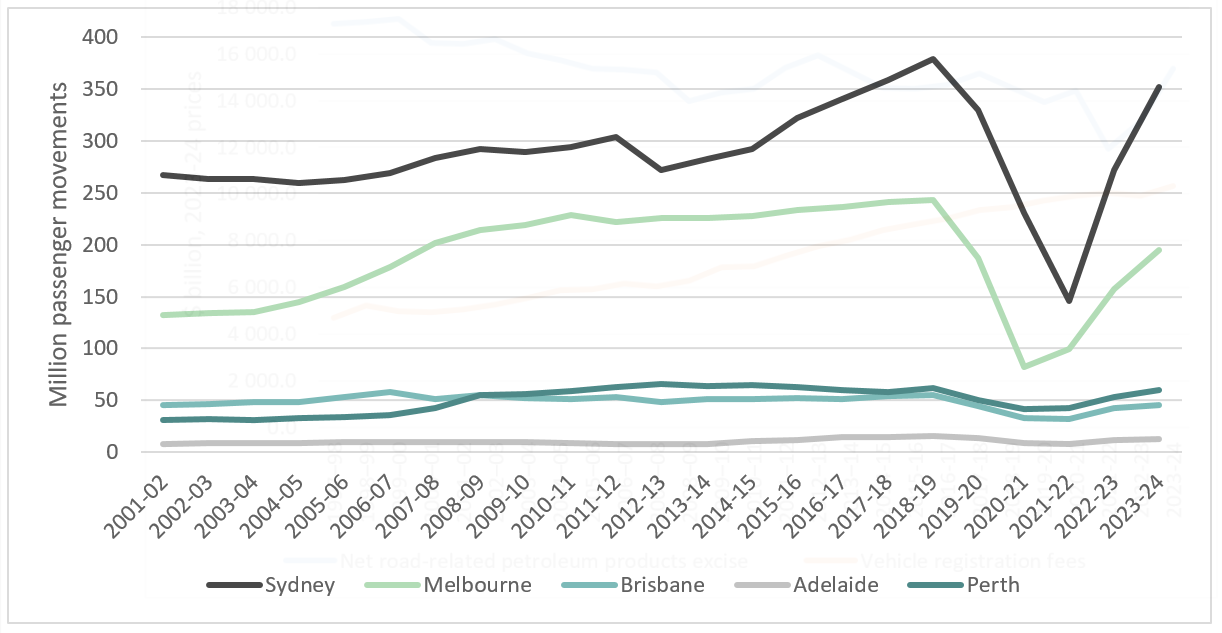
Sources: BITRE (2015), Long-term trends in urban public transport
BITRE (2025), Trainline 12
Prior Trainline publications
Test Trainline 12 page
Trainline is a compendium of Australia's railways. The compendium provides insights, analysis, and an understanding of the railway industry. Australia's railways are evolving, with changes both outside and within the industry. These changes include logistics, commodity flows, technology, urban patronage, and regional passenger services. The publication presents an overview and data on railway transport tasks performed; characteristics of the railways and train operators' rolling stock that runs; and aspects of railway performance, including safety, environment and reliability.
Data on the latest national and state/territory road deaths and fatal crashes can be found on the National Road Safety Data Hub website.
Quarterly heavy vehicle road deaths
Explore up-to-date data tracking counts of fatalities in crashes involving heavy vehicles on the National Road Safety Data Hub.