Related freight reports
For additional freight related information select the relevant publication below.
Australian Infrastructure and Transport Statistics Yearbook 2025: shipping chapter
Chapter 7: Shipping
- Australian Infrastructure and Transport Statistics Yearbook 2025 - Download PDF
- Shipping—Yearbook 2025 (124 KB) - Download Excel file
This chapter provides information on Australian ships, cargo, ports and fleet, including mileage, tonnage and number of vessels. The data is sourced from BITRE’s Australian Sea Freight publication, BITRE’s Waterline publication and BITRE estimates based on Lloyd's List Intelligence data.
- 9.1 million TEUs (twenty-foot equivalent units) were exchanged at container terminals in Brisbane, Sydney, Melbourne, Fremantle, and Adelaide in 2024–25.
- 32,142 port calls were made to Australian ports in 2024–25. The states with the highest number were Western Australia with 9,580 and Queensland with 8,244.
- 5,841 different cargo vessels visited Australian ports in 2024–25.
- There were 53 Australian registered vessels in the Australian trading fleet, including small vessels, and 83 overseas registered vessels in 2022–23.
Figure 14 Principal Australian ports, by commodity
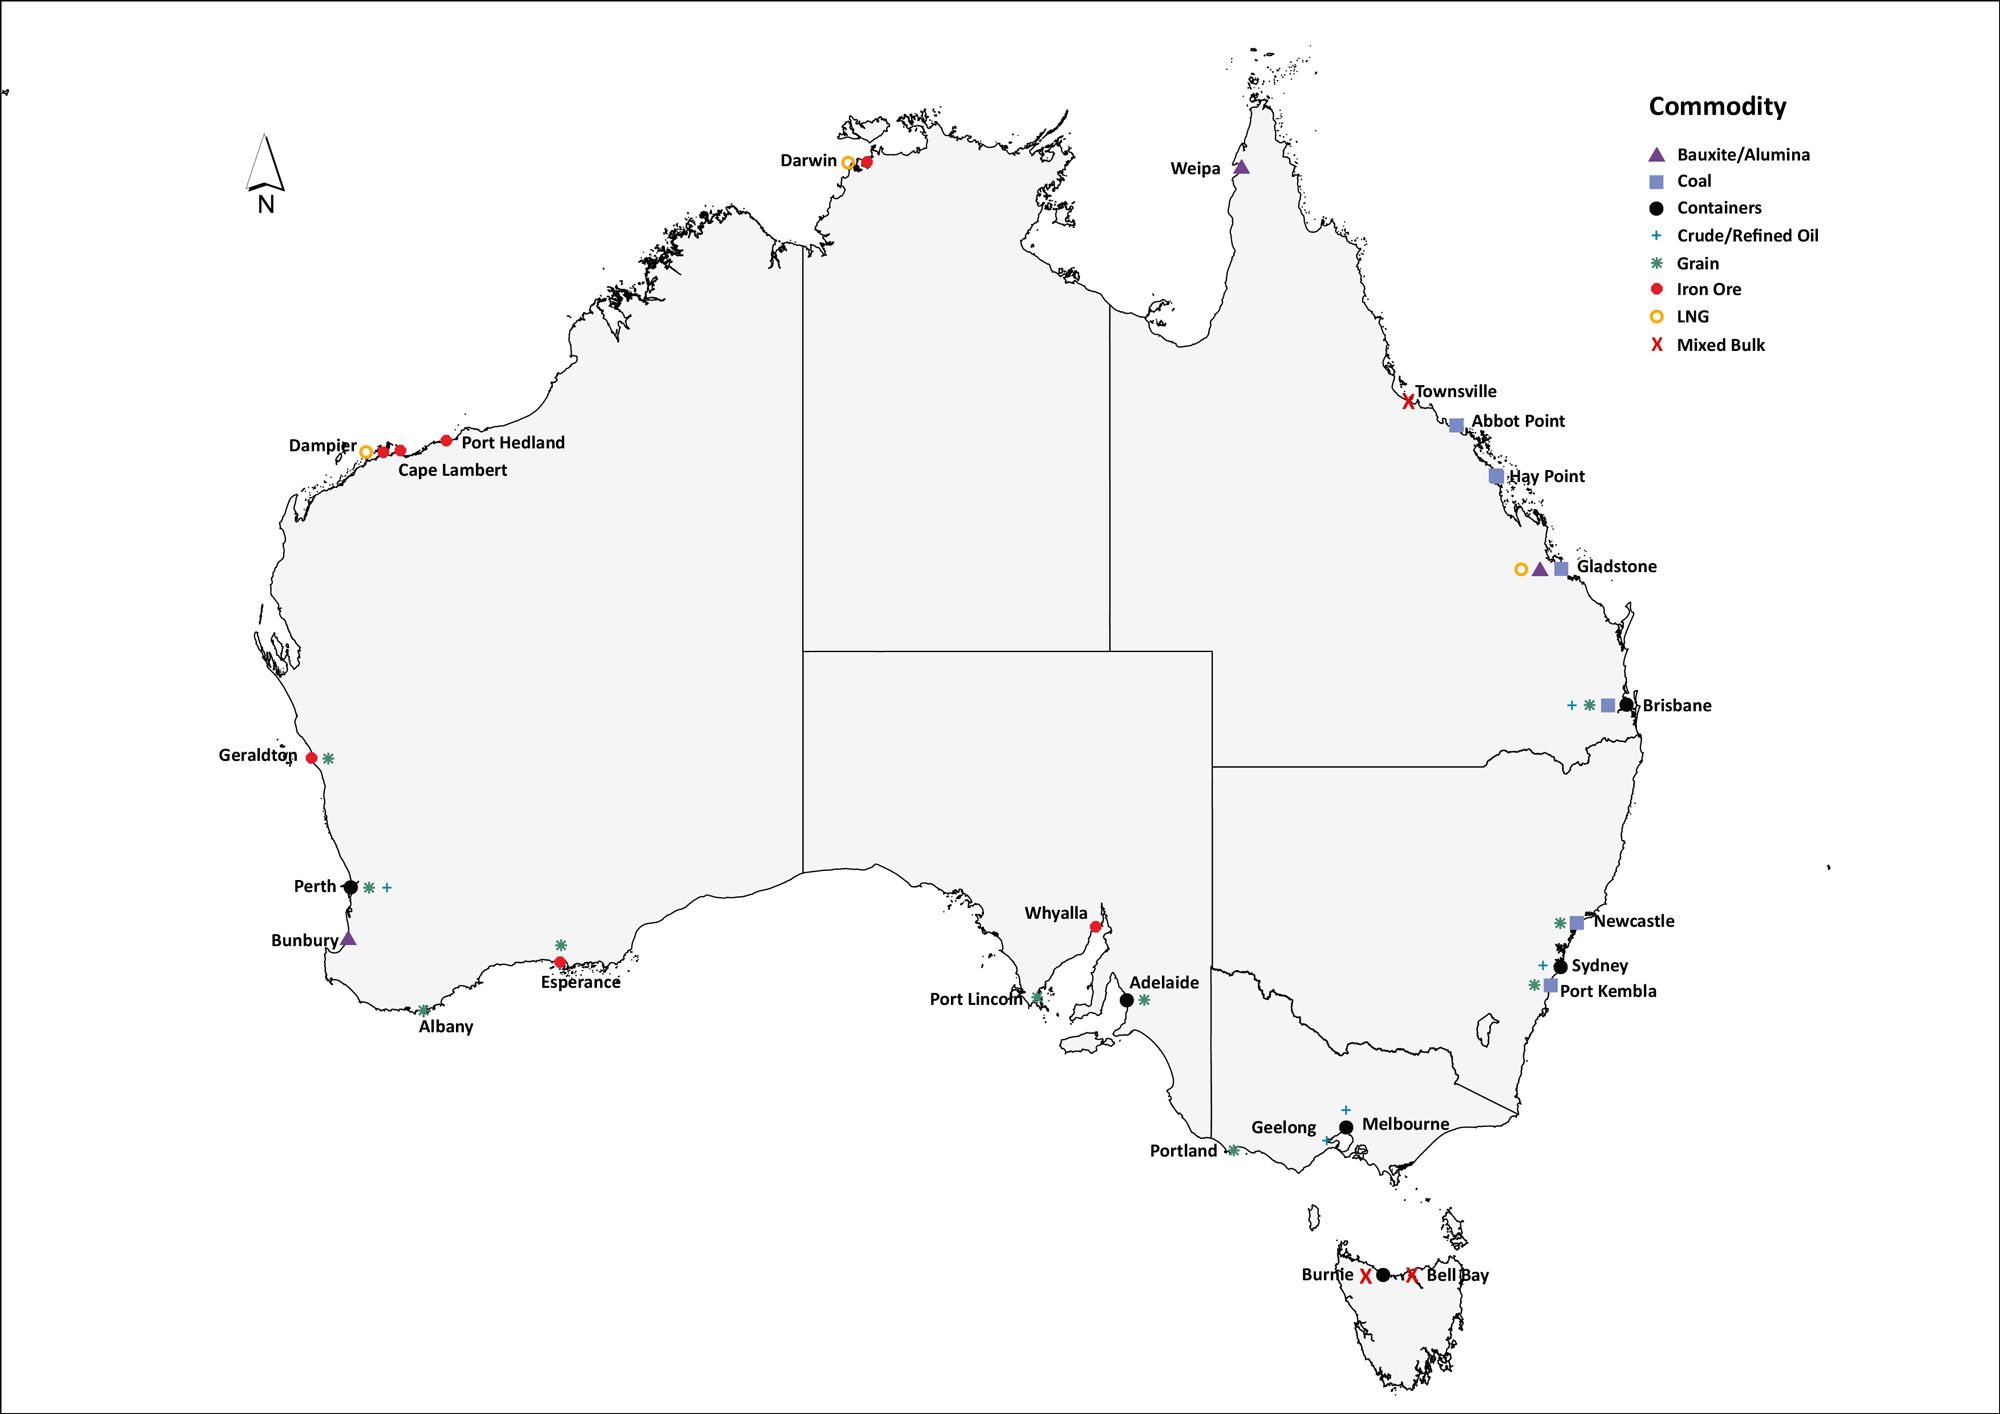
Figure 15 shows the number of port calls by state from 1999-00 to 2024-25. Queensland and Western Australia saw the largest increases and were consistently Australia’s two most visited states by cargo ships.
Figure 15 Number of port calls by state/territory
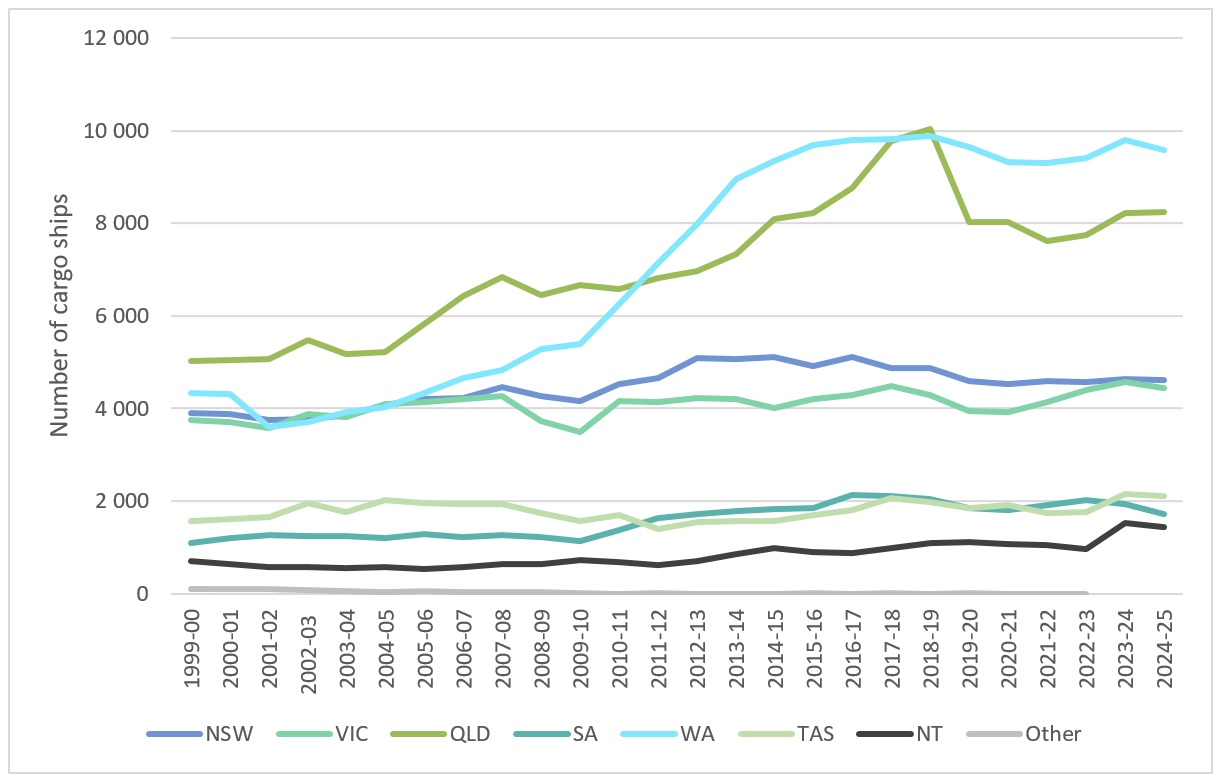
Note: “Other” includes state/territory not clearly specified in the source data.
Data may change slightly from year to year due to revisions to historical data. Ships that have made only port calls in the financial year where the target port equals the previous recorded port are excluded.
Source: BITRE estimates based on Lloyd’s List Intelligence data
Australian Sea Freight 2023–24
This is the latest in a series of BITRE reports that provide information on Australian sea freight movements, vessel activity, the use of coastal trading licences, and the size and composition of the Australian trading fleet.
The latest import and export data has been made available in machine readable form on the National Freight Data catalogue.
Tasmanian Freight Equalisation Scheme Monitoring Report 2024
The Tasmanian Freight Equalisation Scheme (TFES) provides financial assistance for costs incurred by shippers of eligible non-bulk goods moved by sea across Bass Strait. This report is BITRE's second 4-yearly monitoring review of all components of the TFES. The focus is the volume and value of eligible claims for goods shipped between Tasmania and the mainland in the 4 years from 2019–20 to 2022–23.
Bass Strait Passenger Vehicle Equalisation Scheme Monitoring Report No. 19
The Australian Government spent $101.0 million on the Bass Strait Passenger Vehicle Equalisation Scheme in the 2 years to June 2023 ($41.8 million in 2021–22 and $59.2 million in 2022–23).
Waterline reports on trends in throughput, container handling productivity on the waterfront and landside of ports in Australia and the cost of importing and exporting containers via 5 major container ports. It covers the loading and unloading of container ships and the transport of containers from container terminals.
This issue covers port terminal activity up to the June quarter 2023.
Consultation Draft Tasmanian Freight Equalisation Scheme Monitoring Report 2024
Consultation Draft Tasmanian Freight Equalisation Scheme Monitoring Report 2024.
Economic Contribution of Transport in Australia, 2020-21
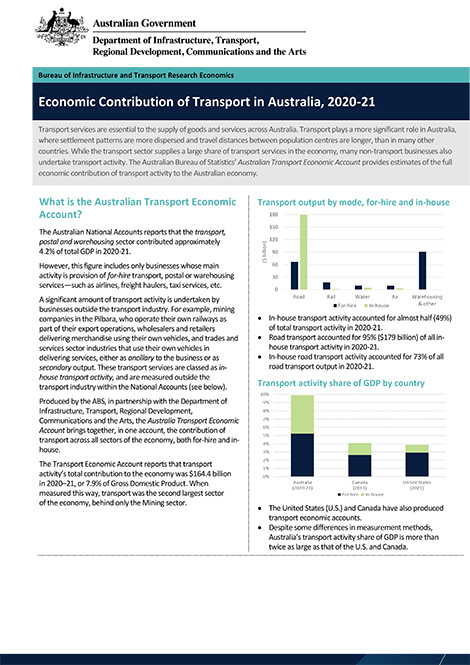
The Australian Bureau of Statistics’ (ABS) Australian Transport Economic Accounts (ATEA) 2020-21 provide estimates of the full economic contribution of transport activity, both for-hire and in-house transport services, to the Australian economy, from 2010-11 to 2020-21.
The ATEA estimates that transport’s total contribution to the economy was $164.4 billion in 2020-21, equivalent to 7.9 per cent of total GDP. Measured in this way, transport was the second largest sector of the economy, behind only the Mining sector.
This release provides a short summary and highlights of the ABS ATEA 2020-21. More detailed ATEA statistics and explanatory notes are available from the ABS website: www.abs.gov.au/statistics/economy/national-accounts/australian-transport-economic-account-experimental-transport-satellite-account
Waterline reports on trends in (a) throughput, (b) container handling productivity on the waterfront and the land side of ports in Australia, and (c) the cost of importing and exporting containers via five container ports. It covers both the loading and unloading of container ships and the transport of containers from container terminals.
This issue covers port terminal activity up to the June quarter 2022.
Australian Sea Freight 2020-21
This is the latest in a series of Bureau of Infrastructure and Transport Research Economics (BITRE) reports that provide information on Australian sea freight movements, vessel activity, the use of coastal trading licences, and the size and composition of the Australian trading fleet. This report contains statistics on maritime freight and shipping activities in Australia from 2011–12 to 2020–21.
The latest import and export data has been made available through a visualisation on the National Freight Data Hub website.